the Technology Interface/Spring 2007
Harby, Ollison, Townsend, and Ulmer
SERVICE LEARNING: A Comparative Study on the Compression Strength Properties of 3D-Printed Rapid Prototyped Components Utilizing Various Manufacturing Build Parameters
by Donald W. Harby
[email protected] Dept. of Engineering Technology University of Central Missouri
Troy E. Ollison
[email protected] Dept. of Industrial Technology University of Central Missouri
Grant R. Townsend
[email protected] Dept. of Industrial Technology University of Central Missouri
Jeffrey M. Ulmer
[email protected] Dept. of Industrial Management University of Central Missouri
ABSTRACT
Industry relies upon rapidly produced structurally sound prototype components. 3D-printed rapid-prototyped components are easy to construct but are not widely accepted in industry as structurally sound viable alternatives to subtractive material machining methods. Through the statistical study of 3D-printed test cylinder specimens, greater understanding on the compressive strength properties of the technology was obtained by the effect of build orientation, cure time after initial part build and cure temperature. The result of the study was that all three input variables had statistical significance on the compressive strength of the rapid prototyped components. Additional studies should be conducted on other rapid prototyped processes to generate a database that industry could use for prototype material and processing selection.
the Technology Interface/Spring 2007
Harby, Ollison, Townsend, and Ulmer
Introduction The topic under study is the compression strength of rapid-prototyped (RP) 3D-printed 1-inch diameter x 2-inch height cylinder specimens. RP technology is relatively new and not well understood in industry regarding its capabilities for conventional prototyping and rapid manufacturing (RM). Through this statistical research project, greater insight into strengths and limitations of 3D-printed components are available with admonitions for future study by other researchers. Problem Statement Potential customers of rapid prototyping technology do not know the compression strength of 3D printed components. In order to bring about additional understanding of this technology, a study should be conducted comparing key variables in the process affecting compression strength. Therefore, what key variables affect the compressive strength of cylindrical 3D printed components? Reason and Purpose of the Study The compressive strength of rapid prototyped components is not well known in industry. While many companies will readily accept a machined component with inherent strength for prototyping purposes, they are not aware or hesitant to use a rapid prototyped part due to ignorance of the technology. The benefit of a strong functionally usable prototype (whether it is RP prototyped or machined) is of great value during the prototyping stage because it allows a company to perform life and endurance testing on new designs in a short amount of time. While some companies have invested in the technology of RP, there are many who have not because of a lack of understanding in how a rapid prototyped physical prototype could be advantageous for thin walled components, multi-shaped configurations or mold making. In essence, many executive management personnel simply do not know how a rapid prototyped component could benefit their operations. Through this study, the compressive strength of 3D rapid prototyped components was documented for further investigation and building-block knowledge enhancement. Manufacturers will benefit by gaining knowledge and understanding on the advantages, disadvantages and physical limitations of 3D printed RP components in relation to other available RP technologies. And researchers will benefit from this study in order to further develop RP technology understanding. Research Question What is the optimal combination of build orientation, cure time after initial part build, and cure temperature for rapid prototyped 3D printed components for optimized compression strength?
the Technology Interface/Spring 2007
Harby, Ollison, Townsend, and Ulmer
Hypothesis Statements To statistically test for the optimal combination of build orientation (x1), cure time after initial part build (x2) and heat cure temperature (x3), the hypothesis statements consist of the following (bi coefficients will be determined in the study): Null Hypothesis: (HO): β1 = β2 = β3 = 0. There is no significant difference in compression strength for 3D-printed rapid prototyped components regardless of build orientation, cure time, or heat cure temperature. Alternative Hypothesis: (H1): β1 ≠ β2 ≠ β3 ≠ 0. There is a significant difference in compression strength for 3D-printed rapid prototyped components regardless of build orientation, cure time, or heat cure temperature. The regression equation is per the following configuration: Y = b1x1 + b2x2 + b3x3 + Int. + e1 Where Y = Compression strength in pounds, b1 = build orientation coefficient, x1 = build orientation, b2 = cure time after initial build coefficient, x2 = cure time after initial part build, b3 = heat cure temperature coefficient, x3 = heat cure temperature, Int. = Y Intercept and e1 = error. Assumptions of the Study In this study, multiple regression was used to statistically identify the significant predictors of optimal 3D-printed rapid prototyped component strength. All variables were considered to be without error in accuracy and reliability. The categorical independent variable build orientation in the chamber was coded with zero (built horizontally) or one (built vertically). The independent variables of cure time and cure temperature are continuous. The independent variables of layer thickness, ambient temperature, and humidity were assumed to be controlled and stable due to 3D printer consistency, room temperature stability and the placement of the components in a sealed plastic bag. The independent variable of error was present in the final test results and will be present in the prediction equation. The dependent variable of compression strength is continuous as measured in pounds of compression strength prior to rupture. All variables (independent and dependent) are assumed to be normal. Homogeneity of variance for the variables was assumed for the test. The assumptions of random sampling and measurement error are all within the regression equation model. Homoscedasticity was also assumed for the independent variables. Per Hayden (2005), homoscedasticity is when “the variance of prediction errors is the same for all values of the linear combination of the independent variables”. The independent variables were considered to be linear in relationship to the dependent variable. Multiple regression is a robust statistical tool and can tolerate minor deviations from this assumption. 3D-printed test specimens were of equal size. Lastly, the multicollinearity (correlation between one another) is not present for the independent variables.
the Technology Interface/Spring 2007
Harby, Ollison, Townsend, and Ulmer
Limitations and Delimitations of the Study Violation of any of the assumptions will create a limitation for the research study. Correlation of the independent variables (multicollinearity) would also violate the multiple regression analysis conducted. Sample size is also a limitation to this study due to the number of printed test specimens. The variables of component build orientation, cure time, or cure temperature may not be causation to the resulting compression strength. The apparent correlation of the delimited component build orientation, cure time, or cure temperature may not take into account all variables. Error, humidity, equipment repeatability and reliability may all play a factor in the study’s results as well. This would result in the prediction equation not being correct. Literature Review Rapid Prototyping Technologies Cooper (2001) provides the following definition of rapid prototyping: “Rapid Prototyping is the layer-by-layer fabrication of three-dimensional physical models directly from a computer-aided design (CAD).” In essence, rapid prototyping grew out of Computer-Aided Design towards solid modeling (3 dimensional) in the late 1980’s. In 1986, Charles Hull developed the first rapid prototyping process at 3D Systems called Stereolithography (SLA). SLA works by building prototypes by layering thin consecutive sections with a photosensitive resin that cures when exposed to an ultraviolet (UV) laser beam. All rapid prototypes created go through the following development sequence (Cooper, 2001): 1. Concept – An idea of a product or component is visualized. 2. Preliminary Design – The idea is drawn into a computer CAD program. Design checks can be performed like stress analysis, fit, form and function. 3. Preliminary Prototype Fabrication – Rapid prototyping is produced at this point – in place of old methods of manually machining prototypes out of metal or wood. The ability to modify the CAD design and “print out” new rapid prototypes with little skilled mechanical labor (such as a machinist) brings forth the savings here. Plus, the turn-around time is greatly reduced. 4. Short-Run Production – Rapid prototyping technology can be used here to produce several prototypes or rapid tooling (with rapid prototyping machines) if needed. 5. Final Production – At this phase hard tooling for dies and molds are made. Although at the present time rapid prototype parts are not used for this phase, rapid prototyped tools may be the next big development.
the Technology Interface/Spring 2007
Harby, Ollison, Townsend, and Ulmer
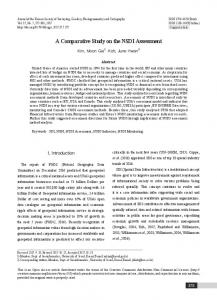
The rapid prototyping cycle basically works per the illustration in Figure 1:
Figure 1. The Rapid Prototyping Cycle Cooper (2001) lists the following as the primary methods of rapid prototyping: 1. Fused Deposition Modeling (FDM) 2. Laminated Object Modeling (LOM) 3. Stereolithography Apparatus (SLA) 4. Selective Laser Sintering (SLS) 5. Laser Engineered Net Shaping (LENS) Fused Deposition Modeling Review Fused Deposition Modeling (FDM) materials consist of investment casting wax, acrylonitrile butadiene styrene (ABS) plastic, medical grade ABS thermoplastic, and elastomers. FDM is applied from a 0.070-inch filament spool through a heated tube (held just above the melting point of material) extruding the material in the typical layer-by-layer method. FDM uses STL files for conversion into a QuickSlice (QS) format. QS was developed by Stratasys and SDRC for Stratasys, Inc.’s 3D Modeler. Slices can vary from 0.005 to 0.015 inches. Build envelopes are typically 10 inch x 10 inch x 10 inch minimum. For an example of FDM’s capabilities, a 12-inch replica of the space shuttle was built in 3 hours (See Figure 2). The author felt that the same model would have required 10-20 man-hours in manual machining.
the Technology Interface/Spring 2007
Harby, Ollison, Townsend, and Ulmer
Figure 2. Fused Deposition Created Space Shuttle Model
The advantage of FDM methods is the strength, temperature stability and capability of the materials used. The disadvantages of FDM methods are the slow build speed and the inability to build thin vertical columns (plastic extrusion tip can shift these walls). Laminated Object Modeling Review Laminated Object Modeling produces rapid prototyped part in three-dimensions using paper, plastic, or composites. The Helisys Corporation developed the LOM technique. In this rapid prototyping method, layers are cut by a laser and cumulatively added to the layer below it. See Figure 3 for an illustration of how the laminating material is processed.
Figure 3. Laminating Object Modeling Setup
the Technology Interface/Spring 2007
Harby, Ollison, Townsend, and Ulmer
Build envelopes start at 10 inch x 15 inch x 14 inch with material thickness varying from 0.0038 to 0.0050 inches. The prototype is pressed together by a heated roller - an adhesive on the back of the laminating sheet bonds adjacent sheets together. LOM prototype modelers use STL files, which can be scaled for final LOM prototyping size. Finished LOM prototypes come out of the modeler in a solid laminated block. It is at this point that a technician removes hatch-patterned blocks away from the desired prototype features. LOM prototypes are typically used for concept verification, fit-check analysis, direct use components, or casting and molding patterns. LOM can hold tolerances of +/- 0.010 inches. The advantages of LOM techniques are the inexpensiveness of materials; high-speed development, good accuracy and the materials are safe to humans. The disadvantages are the decubing (removal of unwanted cross-hatches), smell of fumes from the hot adhesive, and the fire hazard aspect of burning through materials with a laser. Stereolithography Discussion Stereolithography Apparatus (SLA) was developed and marketed by 3D Systems Corporation in 1987. SLA uses photosensitive resins that are cured with an initializing laser causing photopolymerization (the liquid resin is converted to a solid). The resultant prototype is a thermoset (one-time use, non reusable) build materials consisting of acrylates and epoxy resins. Parts are generated directly from CAD files using “SLA Slice (a trademarked software package from 3D Systems)” converting the final usage file into a STL modeling file. See Figure 4 for the layout of the SLA system. More coverage of the SLA process will be discussed in the SLS section, since a good deal of the information presented earlier in another submittal to the instructor covered both SLA and SLS in detail. Also see http://computer.howstuffworks.com/stereolith4.htm for further research on SLA (HowStuffWorks, n.d).
Figure 4. The Stereolithography Apparatus
the Technology Interface/Spring 2007
Harby, Ollison, Townsend, and Ulmer
Selective Laser Sintering Discussion Efunda (2003) explains that Selective Laser Sintering (SLS) was developed and patented by DTM Corporation of Austin, Texas in 1989 by a University of Texas Graduate, Carl Deckard. Mr. Deckard optimized rapid prototyping by coming up with an alternative technology that uses refined powder, laser beams, and computer control. The technology consists of two refined powder cylinders on either side of a larger work cylinder, a leveling roller, a CO2 laser, magnifying lenses, computer controlled mirror (for reflecting laser beam – actually, the computer controls all of the actions), a cover plate, and the refined powder (See Figure 5 for the general construction).
Figure 5. Selective Laser Sintering Basic Construction
The Selective Laser Sintering and 3-D Printing Process By viewing the illustration in Figure 5, it is relatively easy to visualize how the system works. The process starts with the center cylinder being pushed up all the way to the top of its travel. The “powder cartridge feeding / collecting system” is ready for processing by having a full compliment of refined powder. The leveling roller is off to one side, to the left of the left feeder. As the process starts, the left feeder lifts a small amount of powder above the cover plate. Then the roller rolls to the right, pushing the powder into the slightly recessed center work cylinder (the amount of depression below the cover plate determines the layer thickness in the z axis). After depositing the powder, the leveling roller rolls all the way over to the right, passing over the right feeder. It is at this point that the CO2 laser turns on; magnification and conditioning of the beam occurs while passing through the lenses; and the mirror directs the beam down into the powder, in computer-pre-defined patterns, to sinter (burn) the powder into hardened structures as
the Technology Interface/Spring 2007
Harby, Ollison, Townsend, and Ulmer
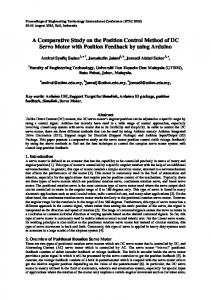
defined by the rapid prototyping computer file. After the laser process is finished, the beam shuts off, the right feeder lifts a small amount of powder above the cover plate, the center cylinder slightly depresses further below the cover plate, and the roller pushes the powder over the cylinder to fill the center work cylinder’s cavity… and so on as discussed when the roller moved from the left to right in the first part of this process. Once the part has been completely constructed and sintered into the final three-dimensional shape, the prototype and surrounding powder, in the center cylinder is removed. The prototype is then brushed off to remove loose powder, final sanded, and finished with paint or left in the sintered condition for viewing and possibly prototype structural integrity testing. To give the reader an animated view of SLS in process, link to http://www.sdsc.edu/tmf, look down the left column of the website, click on “LOM movie”, you may chose Quicktime 1.5M or Mpeg – 1.4M to view a prototype being sintered (TMF, n.d.). The 3-D Printing process is almost identical to the selective laser sintering process, except that instead of a laser, a inkjet printer cartridge deposits a proprietary liquid binder onto the powder. Handling of the 3-D printed component is not as strong as the sintered part, but it provides the designer with a good physical fit and form prototype. 3DP was originally developed at Massachusetts Institute of Technology (MIT) and is low cost, small in size, fast and capable of being used in office environments (Fidan, 2004). As was mentioned earlier, this process deposits powdered materials, which can be aluminum oxide, silicon carbide, silica, or zirconia in very thin layers. After a layer of powdered material is deposited an ink-jet selectively binds the powder together to eventually form a complete prototype part. Figure 6 illustrates the 3DP process that was implemented during this study.
Figure 6. Three-Dimensional Printing Process
the Technology Interface/Spring 2007
Harby, Ollison, Townsend, and Ulmer
SLS – to – SLA Comparison Efunda (2003) also compares SLS to SLA by stating that the SLA process is limited due to the use of photosensitive resins that are weak, lacking the structural integrity of SLS components that are melted together. Furthermore, SLS is more dimensionally accurate than SLA due to SLA’s dimensional instability, and SLS does not require resin-constructed periphery structures inside the work cylinder as SLA does. SLS parts can be made out of polymer powders such as “nylon, elastomer”, and even metal (something that SLA components cannot be made from).” The negative aspect of SLS components is the rougher surface finish than SLA due to the powdery grain structures created by the SLS process. For further understanding of the Selective Laser Sintering, please see the following websites: 1. 2. 3. 4.
http://www.foundryonline.com/selectiv.htm http://www.bath.ac.uk/~en0dpj/SLS.htm http://home.att.net/~castleisland/sls_int.htm http://www.cs.hut.fi/~ado/rp/subsection3_6_3.html
Another website that supplements the literature review on SLS is located at http://www.objet.co.il/pdf/Technology_compare.pdf, it covers an interesting article published by Todd Grimm (2002), titled “Stereolithography, Selective Laser Sintering and PolyJet: Evaluating and Applying the Right Technology.” In this article / website, Mr. Grimm states the following tidbits about Selective Laser Sintering (SLS – to remind you) in the area of refined powder materials, component accuracy, component stability, post-processing, surface finish, feature definition, environmental resistance, part sizes, build times, and application considerations. SLS utilizes the greatest range of materials that can be used to verify structural integrity directly by testing the sintered prototype – eliminating the need to construct patterns for investment casting or other tertiary prototyping operations. The materials used are polyamide (nylon), glassfilled polyamide, elastomeric polymers (rubber-like structures), modified polystyrene (for investment casting processing, where the SLS component is burned away inside the sand mold as the hot metal is poured into the casting mold), and stainless steel (grade 420 – granule edges sintered in SLS processing, then a secondary baking process occurs to further consolidate the metal constructed part). See Figure 7 for an example of a part in comparison to the powder it came from.
Figure 7. SLS – Completed part and powder
the Technology Interface/Spring 2007
Harby, Ollison, Townsend, and Ulmer
SLS - SLA Accuracy SLS constructed parts are less accurate than SLA constructed components. This is due to SLS shrinkage rates of 3.0 to 4.0 % and less predictable powder shifting during the sintering process as powder is heated and “shifts” during sintering. The z-growth factor is also a consideration of less accuracy in SLS parts. As components are constructed, the z-height (the lowering of the center work cylinder to create a new sintered layer) can be distorted as the laser heats up the top layer and additional layers beneath it, giving rise to possible distortions in the final prototype component. SLS – SLA Stability The stability of SLS components is deemed to be quite well by Grimm as the component is cooled and cleaned of residue powder. Also, unlike SLA produced parts, SLS components remain dimensionally stable over time regardless of subjection to heat, chemicals, or humidity. This feature naturally gives SLS components the advantage when environmental issues have to be considered. Overall SLS – SLA Features Post-processing of SLS components is very straightforward and can consist of sanding the prototype to a desired texture. Removal of support structures or assembly aides is not necessary with SLS derived structures. The surface finish (Ra – Roughness Average) of SLS components can vary from 89 to 580 micro-inches, whereas SLA components can range from 13 to 340 micro-inches in surface finish. The rough texture in SLS is due to the powder used in the process. Feature definition in SLS parts isn’t as good as SLA components, SLA can yield 0.010-inch edge definition – SLS is at 0.025 inches. By far, SLA components would probably give the designer the best looking part due to the better surface definition over that of SLS. Though the tradeoff would be in lack of material strength and dimensional accuracy longevity. A part size of SLS components is listed to have a maximum work envelope of 13 inches x 11 inches x 15 inches in the Sinterstation 2500plus (DTM Corp. machine, by Mr. Carl Deckard’s company) SLS processing device per Grimm (2002). Larger sizes are possible if prototypes are built in sections and then glued together. Build times for SLS components are hard to predict based upon the various features that SLS components may have over that of SLA and PolyJet components. Typically components from all three types of processes can take anywhere from 1.5 to 2.3 hours. SLS – SLA Application Considerations
the Technology Interface/Spring 2007
Harby, Ollison, Townsend, and Ulmer
Application considerations for SLS components over that of SLA produced prototypes comes down to what the components are going to be used for. If a well-defined prototype is needed that doesn’t require strength or can vary in size over time and variability in environmental conditions, then SLA produced components would be the first choice. But if a stable, albeit rougher, component is desired that will maintain structural integrity over time in a myriad of environmental conditions, then a SLS component is the part of choice. As a further consideration for SLS components, Grimm (2002) also points out the ability of metal constructed SLS components to be used for tooling designs and investment castings. By being able to use metals in the rapid prototyping SLS process, time may be saved in the prototyping stage resulting in getting the product to market faster. This concurrent engineering principle is yet another way in which industry can use new technology to further refine and consolidate design and development. As presented in my previous study, and submittal, regarding Selective Laser Sintering, another good resource is located at http://www.atirapid.com/tech/te_sls.html, with a title of “Selective Laser Sintering: Put Your Rapid Prototypes to the Test (2002).” This website was authored and is maintained by Accelerated Technologies Inc., which was formerly DTM Corp. of Austin Texas. Yes, this is the founding company for SLS as started by Carl Deckard in 1989. Accelerated Technologies lists the following possible applications for SLS: 1. 2. 3. 4.
Power tool housings for functional testing. Engine components subjected to high temperatures. Pumps and valves that transmit harsh chemicals. Patterns for complex investment castings.
Mention is even made of how SLS components have been used on the space shuttle and station due to their structural integrity and ability to meet custom specifications. The website also states that cured SLS components can be infiltrated with other metals (such as copper, tin, and others) to further enhance the micro-grain structure of a SLS part. Key to industry-wide acceptance of SLS produced components is its ability to provide superior performance for “functional analysis, form & fit analysis, field testing, investment casting patterns, and tooling inserts (Accelerated Technologies, 2002).” Part tolerance for SLS parts can range between 0.005 to 0.020 inches. Features can be designed with wall thickness at greater than 0.030 inches. All SLS parts are machineable and sandable. Typical part deflection (sintering temperature for bonding the granules) is between 200 to 350 degrees Fahrenheit. Layer thickness is roughly 0.004 to 0.006 inches. If sectional parts are to be constructed in the SLS process and then joined together to make a larger component, cyanoacrylate (super glue) or 2-part epoxy may be used as the joining material. Typical lot sizes for SLS prototype runs, per the website, is anywhere from 1 to 100 parts, with build time being in the neighborhood of 0.5 to 24.0 hours – depending on material, component size, and structural features.
the Technology Interface/Spring 2007
Harby, Ollison, Townsend, and Ulmer
Accelerated Technologies lists a costing range for SLS components at $100.00 to $1700.00, depending, again, on the material, component size, and structural features. Selective Laser Sintering – to – Concurrent Engineering Recap To cap off this section on Selective Laser Sintering, we shall briefly discuss how concurrent engineering principles are fulfilled in SLS rapidly produced prototypes. First, by choosing SLS components, the designer is able to draw a component in CAD, convert the image into a STL file, construct the physical model in a SLS machine, infiltrate the part with additional metal in a curing oven (if the part needs additional strengthening, and isn’t a nylon or an elastomeric part), sand off rough features, and possibly paint the final product for show and tell. With the typical method of prototype manufacture, a designer draws the component in CAD, prints off the drawing on paper, a machinist views the print, machines the part in plastic or aluminum, shapes the part through sanding or polishing, and possibly paints the end product – also for show and tell. The major refinement to the process is the elimination of a highly paid machinist to manufacture the component on a lathe or mill. This capability to reduce human work and intervention is substantial enough to qualify it for inclusion in fulfilling concurrent engineering guidelines. Additional concurrent engineering conformance could also be applied by having the ability to transfer computerized CAD data to a CAM STL file and manufacture a component through standardized and automated actions within the computer. Selective Laser Sintering & Stereolithography Drawbacks The only downside apparent in the SLS is the initial cost to buy and operate a SLS system. Cooper (2001) lists the purchase cost of a DTM Corporation (now Accelerated Technologies, Inc.) Sinterstation is roughly $250,000 to $380,000. Plus, the annual operating cost is approximately $35,000. The footprint alone of the mammoth machine will require about 200 square feet and weighs in at 6,275 pounds! As I’m sure you can quickly surmise, this technology is not for the faint of heart or money. If a company chooses to go the SLS route, they will most assuredly need to keep the machine operating constantly in order to get their return on investment. For comparison purposes, Stereolithography isn’t cheap either. Stereolithography machines can run “in excess of $250,000” with resins costing “$800 per gallon (HowStuffWorks, n.d.).” So as one can see, rapid prototyping may be nice, but it isn’t cheap! Laser Engineered Net Shaping (LENS) Technology Cooper (2001) shares that the Laser Engineered Net Shaping (LENS) process was developed by the Sandia National Laboratories under the Cooperative Research and Development Agreement (CRADA). LENS technology predominately uses metal powders such as stainless steel (316), tool steel (H13), and titanium (Ti-6-4) although other steels and ceramics are used as well.
the Technology Interface/Spring 2007
Harby, Ollison, Townsend, and Ulmer
The LENS prototyping build envelope is 12 inch x 12 inch x 12 inches minimum and operates via four feeder tubes injecting powdered metal into the focal point of a high powered laser in an argon gas environment in order to prevent powder oxidation. LENS tolerance accuracy is +/- 0.020 inches with deposition repeatability of +/- 0.005 inches in the X & Y planes and +/- 0.020 inches in the Z plane. Deposition line width can vary from 0.010 to 0.100 inches. Build rates can go up to 1.0 cubic inches per hours. Final parts are fully cured with full strength and density of the base material. Therefore prototype parts may be used in the end-use product for prototyping testing verification or for actual production run use. The advantages of the LENS process is the construction of strong functional components in metal quickly and directly from CAD – coupled with the excellent choices of metals that can be manipulated in the process. Disadvantages of the LENS process is the rough surface finish and low dimensional accuracy resulting in the necessity to have most final prototypes sanded and polished as a secondary operation. Rapid Prototyping Costing & Configuration Finish-Up Cooper (2001) lists office modeler systems in the $30,000 to $60,000 price range - this would include the Fused Deposition Modeling (FDM) and Laminated Object Modeling (LOM). Rapid prototyping systems using polymers and low-end powders fell within the $125,000 to $300,000 range – this would include Stereolithography (SLA) and Selective Laser Sintering (SLS). Direct metal systems like Laser Engineered Net Shaping (LENS) are over $400,000. For each system, annual maintenance contracts can be quite costly and should be considered in the final cost per hour calculation for prototype manufacture. See Figure 8 for a general breakdown of domestic rapid prototyping systems.
the Technology Interface/Spring 2007
Harby, Ollison, Townsend, and Ulmer
Figure 8. Domestic Selection of Rapid Prototyping Systems
A Prototype Definition A prototype is a three-dimensional representation of an idea converted from a two-dimensional perspective (CAD), converted from a three-dimensional “mind’s eye” concept. The physical prototype is in essence a “Clarifier of Reality (Jacobs, 1996).” In fact, three-dimensional models (in this case, prototypes) help us to view prototype feature areas of acceptance or prototype areas needing improvement. Without the physical example, it is possible to miss important design issues that could be present in a two-dimensional drawing, but which would quickly alert a technician of an issue when examining the three-dimensional representation. CAD File Format Considerations
the Technology Interface/Spring 2007
Harby, Ollison, Townsend, and Ulmer
All solid 3D models created using rapid prototyping machines begin with CAD files. Most of the RP machines being used rely upon STL (Solid Model) files, files that have been converted from the original CAD files. Naturally this can result in conversion errors that can be detrimental to resultant physical prototypes (McDonald, Ryall, & Wimpenny, 2002). Modeling of CAD files fall into two basic categories – Surface Modeling and Solid Modeling. Within Surface Modeling, surfaces are defined by a network of curves, or cross-sections, and by wireframe methods. Solid Modeling on the other hand offers geometry definition through the joining and subtraction of spheres, cylinders and cubes through Boolean operations. CNC Mill and Lathe Prototyping Another often-neglected method in the world of rapid prototyping is the method of machining prototype parts from solid chunks of metal or plastic. Each prototype machined has been created on a CAD station, converted to a computer-aided manufacturing format, and ultimately machined on a CNC mill or lathe (McDonald, Ryall, Y Wimpenny, 2002). See Figure 9 for a picture of a CNC mill in operation. Although this method has only been lightly touched in this research project, this is actually the method of choice chosen for many small manufacturing companies. First, the block of material is relatively cheap to purchase. Second, there are usually several machine shops in towns across America for small companies to outsource their work to. And third, the cost to machine a single prototype can be fairly inexpensive when it is compared to the initial purchase cost of a rapid prototyping system. In essence, there is nothing wrong with spending a couple of thousand dollars on a couple of prototype parts if you only do a few each year. The real benefit in rapid prototyping parts comes when a large company is constantly manufacturing prototype parts and must do so in only a few days or weeks. When this condition exists, rapid prototyping equipment is the route to go.
Figure 9. A CNC Mill in Action
the Technology Interface/Spring 2007
Harby, Ollison, Townsend, and Ulmer
Method of Study Population and Sampling Test specimens were 3D-printed at 1-inch diameter x 2 inches in height (ASTM, 2005) – Meeting 2:1 ratio required for compression testing (h/d = 2 inch / 1 inch = 2). Cylinders were drawn in AutoCAD 2004 as a STL file and then were imported into the Z-Corporation software program. Cylinders were then built into vertical and horizontal patterns for the study (See Figure 10 and 11).
Figure 10. Z-Corporation Horizontal Build Pattern
Figure 11. Z-Corporation Vertical Build Pattern
the Technology Interface/Spring 2007
Harby, Ollison, Townsend, and Ulmer
Eight groups of test cylinder specimens were created (104 total) for compression testing. After the build of each specimen in the RP chamber (See Figure 12), they were sealed in a plastic bag and labeled (See Figure 13). Specimens requiring curing temperature were heated for one hour per the prescribed temperature for one hour. The curing temperature treatment occurred 12 hours into the cure time. Specimens were tracked and bagged per the following groupings: 1. 13 specimens – Vertical build orientation, 24-hour cure time, and 75 degrees Fahrenheit cure temperature. 2. 13 specimens – Vertical build orientation, 24-hour cure time, and 150 degrees Fahrenheit cure temperature. 3. 13 specimens – Vertical build orientation, 48-hour cure time, and 75 degrees Fahrenheit cure temperature. 4. 13 specimens – Vertical build orientation, 48-hour cure time, and 150 degrees Fahrenheit cure temperature. 5. 13 specimens – Horizontal build orientation, 24-hour cure time, and 75 degrees Fahrenheit cure temperature. 6. 13 specimens – Horizontal build orientation, 24-hour cure time, and 150 degrees Fahrenheit cure temperature. 7. 13 specimens – Horizontal build orientation, 48-hour cure time, and 75 degrees Fahrenheit cure temperature. 8. 13 specimens – Horizontal build orientation, 48-hour cure time, and 150 degrees Fahrenheit cure temperature.
Figure 12. Z-Corporation 3D-Printer RP Build Chamber
the Technology Interface/Spring 2007
Harby, Ollison, Townsend, and Ulmer
Figure 13. Sealed Bag Example
Prior to the compression force test, the parts were removed from the sealed bags and measured for diameter and then turned at 90 degrees and measured again so that an average roundness could be obtained. Average diameter was included in the raw tables for future reference. The length of the specimens was also measured to verify that length did vary significantly. Compression force was measured in pounds. See Figure 14 for the MTS compression force tester. Figure 15 illustrates a test specimen after the maximum strength has been surpassed. MTS compression strength was recorded in pounds-per-square-inch (P.S.I.) as the maximum amount of force that the test specimen would withstand prior to rupture. Reference Appendix A through H for raw data collected for the study.
Figure 14. MTS Compression Force Tester
the Technology Interface/Spring 2007
Harby, Ollison, Townsend, and Ulmer
Figure 15. Test Specimen in the test position
The best sample size obtainable was 13-test cylinder specimens for 8 groups. For this study, alpha (α) is set at .05. This assures that only 1 out of 20 chances that H0 will not be rejected if it is actually true – this is a Type 1 Error (Minium, Clarke & Coladarci, 1999). A lower alpha value of .10 could be less expensive to gather data (in other words, do this study over a short time span with less samples), but it increases the possibility of a Type 1 Error to 1 out of 10 chances. If human medical testing were involved, instead of a rapid prototyped component strength study, then an alpha level of .01, or .001, would have been chosen to minimize the likelihood of a Type 1 Error (no room for margin when conducting tests that may involve humans). By setting the alpha at .05, this gives us a regression coefficient confidence interval of 95%. This means that we are 95% sure that the independent variables analyzed are affecting the dependent variable. Therefore based upon our study of RP component strength, an alpha level of .05 is justified. Also, if this were an industrial study where a lot of money (or a continued good relationship from the vendor to the customer) was at stake depending on our test results, then it may be wise to change the level to .01 (although it will cost the company more money to gather the data) – this is known as producer’s risk (Aft, 1998). From the producer’s standpoint, this would be an in-house issue and faulty product would be identified and segregated before it is shipped to the customer. In this research project, beta (β) is of lesser concern due to the nature of the experiment. If beta were at .10, then this would mean that only 1 out of 10 chances that H0 will be accepted when it is actually false – this is a Type 2 Error (Minium, Clarke & Coladarci, 1999). In many industrial studies, both alpha and beta are identified to find a happy medium of product manufacture acceptability. The interplay between of alpha and beta is stated per Howell (n.d.) accordingly “as one goes down, the other goes up.” Sample size is also affected by beta because with lower sample sizes, beta is higher in value. Per Sachs (1982), the choice of a beta value in an industrially related problem is directly tied to cost and should be kept as low as possible (the lower the beta, the higher the cost). An equal beta-to-alpha level of .05 was considered appropriate if the cost can be kept low enough. Beta is also known as consumer’s risk (Aft, 1998). From the consumer’s standpoint, this would be accepting a product that should have been rejected. Naturally from the industrial manufacturer’s viewpoint, they would much rather catch
the Technology Interface/Spring 2007
Harby, Ollison, Townsend, and Ulmer
faulty product in-house before it goes to the customer. For once it reaches the customer, it can cost substantially more in return costs, field replacement, and potentially the loss of a customer for future business. That is why alpha is usually set at a lower level than beta. Power is a factor dependent on beta because the equation is Power = 1 - β. Power is the probability of “powerfulness” in a test. Also, it is the probability of “correctly rejecting the false hypothesis” (Kachigan, 1986). Generally, increasing sample size increases power (Freund & Williams, 1966) – under “Power Efficiency” definition. In the case of this study, increasing sample size (power) was not an option due to the available build powder and time on the 3D printer. Therefore, based upon the aforementioned section, the compression force tests will be conducted on 13 samples (104 total) per each configuration (8 total). To summarize this section, per Pelletier (2005) when given a choice, always go with continuous data over attribute data. Attribute data requires much higher levels in sample size. As you read in the previous discussions on alpha, beta, and power, all contribute to the calculation of a proper sample size. Variables Variables consist of the following (see prior sections for additional discussion): 1. Independent variable of component build orientation is coded (making it categorical): zero – Built horizontally, 1 – Built vertically in the 3D rapid prototyping build chamber. 2. Independent variables of test time and cure temperature are continuous (interval / ratio). 3. Independent variables of layer thickness, ambient temperature, and humidity are considered to be controlled and stable. 4. Independent variable of error will be present in final test results. 5. Dependent variable of compression strength is continuous (interval / ratio). Measurement Instruments and Materials A Z-Corporation Model 310 3D Printer constructed the cylinder test specimens. Material for the specimens consist of ZP102 (plaster-based) powder and ZB 56 binder. Curing of the specimens occurred in a Honacast Division “Honarota RM-470” oven with an Acu-Rite thermometer being used to verify curing temperature. A generic (“made in China”, no vendor name) stainless-steel 0-6 inch calipers verified specimen diameter and length. A MTS 1000 Lb. Load Cell computing station performed the compression strength test. The University of Central Missouri owns both the 3D rapid prototyping printer and the MTS testing station. With this equipment, the researcher was able to control the building of the test specimens and data collection in the final test.
the Technology Interface/Spring 2007
Harby, Ollison, Townsend, and Ulmer
Statistical Analysis Multiple regression using the stepwise procedure with a probability of F entry at .05 and removal at .10 was used to determine optimal 3D-printed rapid prototype component construction. Through the use of the stepwise procedure in multiple regression, it was possible to view the variance in the dependent variable due to the input variation of all independent variables. Statistical significance was set at an alpha at .05 (Type 1 Error: 1 out of 20 chances that H0 will not be rejected if it is actually true). Assumptions of multiple regression was verified by checking the normality of the residuals (Normal P-P Residuals Plot: predicted minus observed values) and a review of descriptive statistics for kurtosis and skew. Through the analysis of residuals we were able to view deviant residuals, which could affect our analysis in tandem with identifying if our variance of residual independent variable values are increasing or decreasing with the change in compression force. Analysis of R and R-Squared for correlation of the independent variables to the dependent variable was discussed. Correlation “R” is “a single number that describes the degree of relationship between two variables (Trochim, 2001). Per Coddington (2004), low level correlations are less than a Pearson R value of .60; mid level correlations at .60 to .79; and strong level correlations at > .79 (all fit for positive correlations – would also apply to “-“ correlations). R can vary from –1 to +1. R2, from 0 to 1 in value, the multiple correlation (also called the coefficient of multiple of determination), is “the percent of the variance in the dependent explained uniquely or jointly by the independents. R-squared can also be interpreted as the proportionate reduction in error in estimating the dependent when knowing the independents. That is, R2 reflects the number of errors made when using the regression model to guess the value of the dependent, in relation to the total errors made when using only the dependent’s mean as the basis for estimating all cases (Garson, n.d.)”. Eigenvalues were generated by the collinearity diagnostics of SPSS 13.0 to verify that multicollinearity was not a problem. Within the stepwise coefficients table, zero-order, partial and part correlation were also used to analyze multicollinearity issues. An ANOVA F Statistic, and significance number, was calculated by SPSS 13.0 to determine if the Null Hypothesis should be rejected. A 95% confidence interval calculation will be listed for maximum compression force. Lastly, a regression equation was created to allow the prediction of optimal build orientation, cure time after initial part build and heat cure temperature. The regression equation will follow this format: Y = b1x1 + b2x2 + b3x3 + Int. + e1 Where Y = Compression strength in pounds, b1 = build orientation coefficient, x1 = build orientation, b2 = cure time after initial build coefficient, x2 = cure time after initial part build, b3 = heat cure temperature coefficient, x3 = heat cure temperature, Int. = Y Intercept and e1 = error. Effects of layer thickness, ambient temperature, humidity and error are not listed, but are an integral part of the final regression equation.
the Technology Interface/Spring 2007
Harby, Ollison, Townsend, and Ulmer
Research Plan Compression tests were conducted on cylindrical rapid-prototyped (RP) 3D-printed cylinders using build orientation (vertical and horizontal), cure time after initial part build and cure temperature in order to determine an optimal configuration. Controlled variables consist of cure temperature, layer thickness, ambient temperature and humidity. From initial build to the compression strength tests, 48 hours had elapsed.
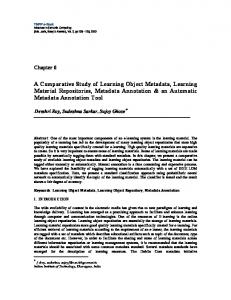
Results of the Study Residual Plot Analysis The Figure 16 Normal P-P Plot of Residuals of the stepwise multiple regression residuals analysis provides a plot of cases that fairly matched the plotted line. Because residual cases should match the plotted line to have equal homogeneity of variance, this assumption has not been violated. Figure 17 of the compression strength regression standardized residual histogram also supports this finding because it appears normal in form. Through the residual plot analysis, homoscedasticity appears to be present because “the variance of prediction errors is the same for all values of the linear combination of the independent variables (Hayden, 2005)”.
Figure 16. Normal P-P Plot of Residuals
the Technology Interface/Spring 2007
Harby, Ollison, Townsend, and Ulmer
Histogram
Dependent Variable: StrengthLbs
Frequency
30
20
10
0 -3
-2
-1
0
1
2
3
4
Mean = -5.67E-16 Std. Dev. = 0.985 N = 104
Regression Standardized Residual
Figure 17. Compression Strength Regression Standardized Residual
Dependent Variable Descriptive Statistics Analysis of the descriptive statistics in Table 1 reveals that compressive strength skew is at 1.655 and kurtosis is at 2.851. With skew at 1.655, this means that it has a positive skew (0 would be normal); +/- 2.0 is within normal acceptability limits. At a kurtosis of 2.851 implies that it is leptokurtic [narrow base]; a kurtosis of +/- 2.0 is considered normal. Hence, it appears that the distribution is not completely normal in shape while the residual plots would indicate that it is normal. For our purposes, the dependent variable of compression strength was accepted as normal. Analysis of plots was not necessary because there are not enough discrete variables to create a plot or provide a better indication of skew and kurtosis due to only two points on each independent variable. Descriptive Statistics
StrengthLbs BuildOrient CureTimeF CureTempF Valid N (listwise)
N Statistic 104 104 104 104 104
Minimum Statistic 20.0 .0 24 75
Maximum Statistic 131.5 1.0 48 150
Mean Statistic 50.676 .500 36.00 112.50
Std. DStatistic i i 22.1289 .5024 12.058 37.682
Variance Statistic 489.686 .252 145.398 1419.903
Skewness Statistic Std. Error 1.655 .237 .000 .237 .000 .237 .000 .237
Table 1. Descriptive Analysis on Variables
Kurtosis Statistic Std. Error 2.851 .469 -2.040 .469 -2.040 .469 -2.040 .469
the Technology Interface/Spring 2007
Harby, Ollison, Townsend, and Ulmer
Correlation Analysis Table 2 provides a detailed listing of R and R-Squared correlation results of the three independent variables of build orientation, cure time and cure temperature as it relates to the dependent variable of compression strength. Per Coddington (2004), low-level correlations are less than a Pearson R value of .60; therefore, the correlation of .576 for model 1 is low from build orientation to compression strength. When the independent variables of build orientation and cure temperature were present in model 2, the correlation increased to a mid level correlation (ranging from .60 to .79) of .764. In model 3, with all three independent variables present, the correlation became strong at .794 (>.79 is considered strong). This seemed to indicate that the addition of adding the independent variable of cure time did little to enhance the correlation beyond model 2. In model 1, R-Squared yields a low score of .332, meaning that only 33.2 percent of the correlation is explained by the independent variable of build orientation. In model 2, this jumps up to 58.4 percent. In model 3, the value rises slightly to 63.1 percent. Hence, other factors in the study must be affecting the compression strength of the test cylinder specimens. Model Summary d Change Statistics Model 1 2 3
R R Square .576a .332 .764b .584 .794c .631
Adjusted R Square .325 .575 .620
Std. Error of the Estimate 18.1785 14.4199 13.6390
R Square Change .332 .252 .048
F Change 50.630 61.102 12.896
df1 1 1 1
df2 102 101 100
Sig. F Change .000 .000 .001
a. Predictors: (Constant), BuildOrient b. Predictors: (Constant), BuildOrient, CureTempF c. Predictors: (Constant), BuildOrient, CureTempF, CureTimeF d. Dependent Variable: StrengthLbs
Table 2. Model Summary for Correlation
Statistical Significance Table 3 provides good indication that models 1, 2 and 3 all are significant at .000. Therefore, additional statistical analysis is necessary to determine the best independent variable settings for optimal specimen strength as expressed in the regression equation (also known as prediction equation).
the Technology Interface/Spring 2007
Harby, Ollison, Townsend, and Ulmer
ANOVAd Model 1
2
3
Regression Residual Total Regression Residual Total Regression Residual Total
Sum of Squares 16731.01 33706.68 50437.69 29436.30 21001.39 50437.69 31835.34 18602.35 50437.69
df 1 102 103 2 101 103 3 100 103
Mean Square 16731.008 330.458
F 50.630
Sig. .000a
14718.149 207.935
70.783
.000b
10611.780 186.024
57.045
.000c
a. Predictors: (Constant), BuildOrient b. Predictors: (Constant), BuildOrient, CureTempF c. Predictors: (Constant), BuildOrient, CureTempF, CureTimeF d. Dependent Variable: StrengthLbs
Table 3. ANOVA Table for Significance
It is also apparent in Table 4 that significance did not change much when SPSS 13.0 used the stepwise procedure to step through model 1 through 3 to determine the least significant independent variable. Aside from model three’s cure time significance of .001, all models had independent variables with a significance of .000. It is also apparent in Table 4 through each modeling sequence that build orientation maintained high unstandardized coefficients and standardized coefficients. This means that build orientation is contributing much more to the regression equation than the other two independent variables of cure temperature and cure time. Review of the correlations of zero-order to partial and part, all indicate that the variance present can be explained because partial and part did not change much in value. In Table 5, Eigenvalues are available to consider collinearity. Generally, when Eigenvalues approach zero, there is concern for possible intercorrelation between the independent variables. In this case, the Condition Index value maximum of 10.050 does not point out a problem with multicollinearity. Per SPSS 13.0 (2004), multicollinearity is not a problem until the Condition Index exceeds 15. Coefficients a
Model 1 2
3
(Constant) BuildOrient (Constant) BuildOrient CureTempF (Constant) BuildOrient CureTempF CureTimeF
Unstandardized Coefficients B Std. Error 63.360 2.521 -25.367 3.565 30.201 4.690 -25.367 2.828 .295 .038 44.610 5.981 -25.367 2.675 .295 .036 -.400 .111
Standardized Coefficients Beta -.576 -.576 .502 -.576 .502 -.218
t 25.134 -7.115 6.440 -8.970 7.817 7.458 -9.484 8.264 -3.591
Sig. .000 .000 .000 .000 .000 .000 .000 .000 .001
Zero-order
Correlations Partial
-.576
-.576
-.576
-.576 .502
-.666 .614
-.576 .502
-.576 .502 -.218
-.688 .637 -.338
-.576 .502 -.218
a. Dependent Variable: StrengthLbs
Table 4. Model Significance, Coefficients and Correlation Checks
Part
the Technology Interface/Spring 2007
Harby, Ollison, Townsend, and Ulmer
Collinearity Diagnostics a
Model 1 2
3
Dimension 1 2 1 2 3 1 2 3 4
Eigenvalue 1.707 .293 2.558 .392 .050 3.439 .427 .100 .034
Condition Index 1.000 2.414 1.000 2.554 7.163 1.000 2.838 5.864 10.050
(Constant) .15 .85 .01 .03 .96 .00 .01 .00 .99
Variance Proportions BuildOrient CureTempF .15 .85 .05 .01 .91 .04 .03 .94 .03 .01 .95 .02 .00 .50 .03 .48
CureTimeF
.01 .02 .50 .48
a. Dependent Variable: StrengthLbs
Table 5. Collinearity Diagnostic for Independent Variable Linear Relationships
Using Table 3, the SPSS F value is equal to 57.045 at a significance level of .000. Per Minium, Clarke & Coladarci (1999) F Distribution Table, the calculated Critical F Value is 2.70 (df = 3 for regression / numerator, df = 103 for residual / denominator). Because the calculated Critical F Value of 2.70 is less than the SPSS F value of 57.045, the null hypothesis is rejected. Furthermore, the SPSS significance level of .000 also supports this determination because it is less than the alpha level of .05. Confidence Interval In Table 6, descriptive statistics are provided to determine the confidence interval for compression strength. Using a mean of 50.676 pounds, a standard error at 2.1699, a standard deviation of 22.1289, and a confidence interval of 95%, it can be determined that 95% of all maximum compression strength for 3D printed components will be from 46.423 to 54.929 pounds. Descriptive Statistics
StrengthLbs Valid N (listwise)
N Statistic 104 104
Minimum Statistic 20.0
Maximum Statistic 131.5
Mean Statistic Std. Error 50.676 2.1699
Std. DStatistic i i 22.1289
Table 6. Descriptive Statistics for the Confidence Interval Regression Equation The following regression equation is founded upon the coefficients of Table 4, model 3, because all three independent variables affect the final product of compression strength in pounds.
the Technology Interface/Spring 2007
Harby, Ollison, Townsend, and Ulmer
Y = -25.367*(Build Orientation) - .400*(Cure Time After Initial Part Build) + .295*(Heat Cure Temperature) + 44.610 Conclusions and Recommendations Null Hypothesis Rejection Compressive strength of 3D-printed rapid prototyped parts is dependent upon the build orientation, cure time after initial part build and heat cure temperature per the tests conducted in this comparative study. The null hypothesis statement of (HO): β1 = β2 = β3 = 0 was rejected because there is a significant difference in compression strength for 3D-printed rapid prototyped components regardless of build orientation, cure time, or heat cure temperature. Null hypothesis rejection was determined when the significance value was zero and the calculated critical F Value of 2.70 was less than the SPSS F Value of 57.045. Assumption Testing, Limitations and Delimitations Before the determination of the null hypothesis status, several key assumptions were tested. The Normal P-P Plot of Residuals using stepwise multiple regression yielded a plot of observed to expected cases that approximately matched the plotted line. A compression strength regression standardized residual histogram also provided a normal distribution for reference. Through the analysis of the compression strength descriptive statistics, skew was normal at 1.655, but kurtosis was at 2.851. While kurtosis was beyond normal +/-2.0 distribution limits, the closely fitted residual plots displayed a normal curve, thus considered normal. With these plotted tests, homogeneity of variance is equal and homoscedasticity is present. The limitation of sample size did not seem to be a factor in the rejection of the null hypothesis. It is possible that the correlation of the delimited independent variables of component build orientation, cure time and cure temperature may not have taken into account all of the other possible variables. Moreover, it is also possible that the non-controllable variables of error, humidity, equipment repeatability and reliability could have affected the end test results as well. Multiple Regression Modeling and Correlation Discussion In the stepwise method for multiple regression, three models were presented for review. Model 3 was used to get the best modeling visualization using the three independent variables of build orientation, cure temperature and cure time. Model 3 provided a Pearson R value of .794 with an R-Squared value of .631. While the Pearson R value relates to a strong correlation, the RSquared value of .631 means that only 63.1 percent can be accounted for in the model. Therefore, other factors in the study must be affecting the compression strength of the test cylinder specimens. It was determined that all three models were statistically significant at .000 using an ANOVA table for significance. These results necessitated additional analysis to determine the proper variable settings for optimal test specimen strength. Unstandardized Coefficients, Collinearity and Eigenvalue Analysis It was determined through unstandardized coefficient analysis that build orientation had the greatest effect on the regression equation than the variables of cure time or cure temperature.
the Technology Interface/Spring 2007
Harby, Ollison, Townsend, and Ulmer
Likewise, zero-order, partial and part correlations yielded similar numbers on each variable indicating that the variance present could be explained within the model. Eigenvalue analysis confirmed that collinearity was not a problem since the condition index maximum value was at 10.50, well below the concern level of 15, nor was intercorrelation of the independent variables since the Eigenvalue did not approach zero. Confidence Intervals and the Regression Equation Through a 95% confidence interval calculation, a range of 46.423 to 54.929 pounds was determined for 3D-printed components. The final regression equation for compression strength in pounds was determined to be the following. Y = -25.367*(Build Orientation) - .400*(Cure Time After Initial Part Build) + .295*(Heat Cure Temperature) + 44.610 Final Conclusions Table 7 tabulates mean dependent compression values from independent build orientation, cure time, and heat cure temperature variables. While each variable was tested to be statistically significant, meaning that all variables had a significant effect on compression force, the summarized values in compression force indicate that a horizontal build, cured for 24 hours, at a cure temperature of 1500F provided the highest strength at 95.2 lbs. Through analysis of Table 7, it also appears that all horizontally built components are stronger, regardless of whether they underwent a 24 or 48 hour cure time; neither did a 750F or 1500F cure temperature seem to change the results. It is apparent, though, that the cure temperature of 1500F strengthened the part regardless of the build orientation or the cure time. Build Orientation Vertical Vertical Vertical Vertical Horizontal Horizontal Horizontal Horizontal
Cure Time - Hrs. 24 24 48 48 24 24 48 48
Cure Temp. - 0F 75 150 75 150 75 150 75 150
Compression Force - Lbs. 37.6 42.1 25.4 46.9 47.1 95.2 48.4 62.8
Table 7. Compression Force Test Results
Industrial Benefits of this Study and Future Studies Through analysis of the comparative data, industrial leaders interested in optimizing prototyping will have an idea of the compressive strength properties of 3D-printed rapid prototyped parts. In addition, the study is a stepping-stone to other rapid prototyping technologies needing investigation.
the Technology Interface/Spring 2007
Harby, Ollison, Townsend, and Ulmer
The comparative study was a good study because replication of the test could occur through the design, preparation, printing, processing, and ultimately the compression testing of other rapidprototyped test cylinder specimens using different materials. This should not be limited to materials only used in 3D rapid prototyping technologies, but should be expanded to include other common prototyping materials and technologies used in industry. Once the database is created for material strength comparison, interested parties in industry could chose the appropriate material for the task under consideration. Further research in the area of 3D-printed rapid prototyped parts should be attempted by building the same test cylinder specimens using other rapid prototyped technologies, with divergent materials and processing variations. Technologies to be tested include Fused Deposition Modeling (FDM), Laminated Object Modeling (LOM), Stereolithography Apparatus (SLA), Selective Laser Sintering (SLS), Laser Engineered Net Shaping (LENS) and Computer-Aided Machining (CAM). Once the study is complete, the database of strength in components could be of considerable worth to companies that must bring products to market with short lead times and a high level of confidence in the prototype components validated. Another component of the database should include costs to manufacture the products (determined by volume of material and complexity of the part), initial startup costs for the RP technology, maintenance costs of the equipment, training level of operators using the equipment, and projected useful life of the equipment or RP technology.
the Technology Interface/Spring 2007
Harby, Ollison, Townsend, and Ulmer
References 1. 3D Systems, “3D Lightyear File Preparation Software for the SLA/ SLS Systems, July 2003, http://www.3dsystems.com/products/software/index.asp 2. Accelerated Technologies, Inc., “Selective Laser Sintering: Put Your Rapid Prototypes To The Test”, 2002, http://www.atirapid.com/tech/te_sls.html 3. Aft, L.S., “Fundamentals of Industrial Quality Control (3rd ed.), 1998, Boca Raton: St. Lucie Press 4. American Society for Testing and Materials, “ASTM D1037-99 Standard Test Methods for Evaluating Properties of Wood-base Fibers and Particle Panel Materials”, 2005, West Conshohocken, PA: ASTM International 5. Castle Island Co, “Selective Laser Sintering”, June 2003, http://home.att.net/~castleisland/sls_int.htm 6. Coddington, C.E., “ITEC 6112: Analytical Studies and Planned Experimentation in Industry”, Online course taken through East Carolina University in the Fall of 2004 by Ulmer, J. 7. Cooper, K.G., “Rapid Prototyping Technology; Selection and Application”, 2001, New York: Marcel Dekker, Inc. 8. Dolenc, A., “An Overview of Rapid Prototyping Technologies In Manufacturing: Selective Laser Sintering”, 1994, http://www.cs.hut.fi/~ado/rp/subsection3_6_3.html 9. Efunda: Engineering Fundamentals, “Rapid Prototyping”, 2003, http://www.efunda.com/processes/rapid_prototyping/sls.cfm 10. Foundry Online: University of Texas (n.d.), “Rapid Prototyping – Selective Laser Sintering (SLS)”, 2003, http://www.foundryonline.com/selectiv.htm 11. Freund, J.E., & Williams, F.J., “Dictionary / Outline of Basic Statistics”, 1966, Toronto, Canada: General Publishing Company 12. Garson, G.D., “Quantitative Research in Public Administration”, No Date, http://www2.chass.ncsu.edu/garson/pa765/regress.htm 13. Glory Educational Resource, Inc., 2002, http://www.k12college.com/Webpages/CollegeProfessional/CadCam/Main.asp 14. Grimm, T., “Stereolithography, Selective Laser Sintering and PolyJet: Evaluating and Applying the Right Technology”, 2002, http://www.objet.co.il/pdf/Technology_compare.pdf 15. Hayden, I.M., “SOT 703 - Advanced Statistical Analysis in Technology [Online Course]”, 2005, Terre Haute, Indiana: Indiana State University 16. Howell, D.C., “Statistical Methods for Psychology”, No Date, http://www.psych.utoronto.ca/courses/c1/statstoc.htm 17. HowStuffWorks, “How Stereolithography (3D Layering) Really Works”, No Date, http://computer.howstuffworks.com/stereolith4.htm 18. Jacobs, P.F., “Stereolithography and other RP&M Technologies: From Rapid Prototyping To Rapid Tooling”, 1996, New York: American Society of Manufacturing Engineers 19. Jones, D., “Selective Laser Sintering”, No Date, http://www.bath.ac.uk/~en0dpj/SLS.htm 20. Kachigan, S.K., “Statistical Analysis: An Interdisciplinary Introduction to Univariate & Multivariate Methods”, 1986, New York: Radius Press
the Technology Interface/Spring 2007
Harby, Ollison, Townsend, and Ulmer
21. McDonald, J.A., Ryall, C.J., & Wimpenny, D.I., “Rapid Prototyping Casebook”, 2001, Wiltshire, United Kingdom: The Cromwell Press 22. Minium, E.W., Clarke, R.C., & Coladarci, T., “Elements of Statistical Reasoning (2nd ed.)”, 1999, Danvers, MA: John Wiley & Sons, Inc. 23. Pelletier, J., “Regal-Beloit Lean Six Sigma Black Belt Training”, 2005, Training session conducted at the Lean Six Sigma Black Belt meeting for Ulmer, J., Beloit, Wisconsin 24. Sachs, L., “Applied Statistics: A Handbook of Techniques”, 1982, New York: SpringerVerlag 25. SPSS, “SPSS 13.0 for Windows - Help Section [Computer Software]”, 2004, Chicago, Illinois: Lead Technologies Inc. 26. Trochim, M.K., “The Research Methods Knowledge Base (2nd ed.)”, 2001, Cincinnati, OH: Atomic Publishing Company 27. Xpress 3D “ZCorp 3D Printing”, January 2007, http://www.xpress3d.com/Zcorp3DP.aspx 28. Z Corporation, “Z Corporation High-Definition, Low-Cost 3D Printers”, No Date, http://www.zcorp.com/home.asp
the Technology Interface/Spring 2007
Harby, Ollison, Townsend, and Ulmer
Appendix A Table A1 Vertical Build (1) - 24 Hour Cure Time - 75 0 F. Cure Temperature Measurements Sample No.
Dia. 1
Dia. @ 90
1
1.011
2
0
Compression
Ave. Dia.
Length
Lbs.
P.S.I.
1.013
1.012
2.012
30.9
39
1.014
1.013
1.014
2.013
42.9
55
3
1.019
1.011
1.015
2.016
41.3
53
4
1.015
1.016
1.016
2.019
40.4
51
5
1.016
1.018
1.017
2.019
38.9
50
6
1.012
1.015
1.014
2.012
37.2
47
7
1.016
1.016
1.016
2.012
33.6
43
8
1.017
1.013
1.015
2.011
33.9
43
9
1.019
1.017
1.018
2.016
39.5
50
10
1.013
1.014
1.014
2.019
41.1
52
11
1.013
1.013
1.013
2.012
38.9
50
12
1.015
1.013
1.014
2.016
36.1
46
13
1.015
1.016
1.016
2.015
34.6
44
the Technology Interface/Spring 2007
Harby, Ollison, Townsend, and Ulmer
Appendix B Table B1 Vertical Build (1) - 24 Hour Cure Time - 150 0 F. Cure Temperature Measurements Sample No.
Dia. 1
Dia. @ 90
1
1.017
2
0
Compression
Ave. Dia.
Length
Lbs.
P.S.I.
1.015
1.016
2.013
36.9
47
1.015
1.015
1.015
2.017
47.0
60
3
1.012
1.011
1.012
2.012
41.2
52
4
1.015
1.015
1.015
2.018
45.2
58
5
1.014
1.013
1.014
2.012
41.9
53
6
1.012
1.013
1.013
2.011
42.1
54
7
1.013
1.012
1.013
2.022
45.2
58
8
1.013
1.017
1.015
2.016
36.4
46
9
1.016
1.014
1.015
2.013
44.0
56
10
1.014
1.012
1.013
2.014
38.3
49
11
1.013
1.016
1.015
2.017
41.0
52
12
1.016
1.014
1.015
2.013
38.0
48
13
1.014
1.014
1.014
2.013
49.5
63
the Technology Interface/Spring 2007
Harby, Ollison, Townsend, and Ulmer
Appendix C Table C1 Vertical Build (1) - 48 Hour Cure Time - 75 0 F. Cure Temperature Measurements Sample No.
Dia. 1
Dia. @ 90
1
1.017
2
0
Compression
Ave. Dia.
Length
Lbs.
P.S.I.
1.018
1.018
2.017
24.5
31
1.010
1.013
1.012
2.009
27.5
35
3
1.013
1.010
1.012
2.009
20.7
26
4
1.011
1.012
1.012
2.017
27.4
35
5
1.014
1.014
1.014
2.016
23.7
30
6
1.012
1.015
1.014
2.013
20.0
25
7
1.016
1.012
1.014
2.020
29.7
38
8
1.015
1.015
1.015
2.010
28.1
36
9
1.013
1.017
1.015
2.012
21.9
28
10
1.010
1.014
1.012
2.012
25.3
32
11
1.016
1.018
1.017
2.019
28.9
37
12
1.017
1.015
1.016
2.021
25.0
32
13
1.012
1.016
1.014
2.015
27.1
35
the Technology Interface/Spring 2007
Harby, Ollison, Townsend, and Ulmer
Appendix D Table D1 Vertical Build (1) - 48 Hour Cure Time - 150 0 F. Cure Temperature Measurements Sample No.
Dia. 1
Dia. @ 90
1
1.016
2
0
Compression
Ave. Dia.
Length
Lbs.
P.S.I.
1.014
1.015
2.023
46.3
59
1.018
1.016
1.017
2.018
46.9
60
3
1.020
1.022
1.021
2.016
40.8
52
4
1.016
1.017
1.017
2.015
49.1
62
5
1.015
1.020
1.018
2.017
48.7
62
6
1.019
1.012
1.016
2.017
45.6
58
7
1.021
1.016
1.019
2.029
44.9
57
8
1.015
1.017
1.016
2.017
44.8
57
9
1.022
1.021
1.022
2.018
45.8
58
10
1.018
1.017
1.018
2.014
45.5
58
11
1.019
1.018
1.019
2.024
60.5
77
12
1.014
1.019
1.017
2.013
45.2
58
13
1.020
1.015
1.018
2.018
45.7
58
the Technology Interface/Spring 2007
Harby, Ollison, Townsend, and Ulmer
Appendix E Table E1 Horizontal Build (0) - 24 Hour Cure Time - 75 0 F. Cure Temperature Measurements Sample No.
Dia. 1
Dia. @ 90
1
1.016
2
0
Compression
Ave. Dia.
Length
Lbs.
P.S.I.
1.004
1.010
2.016
38.9
50
1.012
1.002
1.007
2.016
36.5
46
3
1.003
1.012
1.008
2.019
42.0
53
4
1.026
1.008
1.017
2.017
44.8
57
5
1.001
1.017
1.009
2.018
45.3
58
6
1.011
1.010
1.011
2.019
50.0
64
7
1.015
1.010
1.013
2.018
57.8
74
8
1.013
1.011
1.012
2.019
63.9
81
9
1.004
1.017
1.011
2.021
48.8
62
10
1.005
1.016
1.011
2.021
43.4
55
11
1.012
1.010
1.011
2.019
46.3
59
12
1.012
1.006
1.009
2.019
42.8
54
13
1.009
1.010
1.010
2.020
51.4
66
the Technology Interface/Spring 2007
Harby, Ollison, Townsend, and Ulmer
Appendix F Table F1 Horizontal Build (0) - 24 Hour Cure Time - 150 0 F. Cure Temperature Measurements Sample No.
Dia. 1
Dia. @ 90
1
1.009
2
0
Compression
Ave. Dia.
Length
Lbs.
P.S.I.
1.008
1.009
2.020
92.9
118
1.015
1.003
1.009
2.022
77.6
99
3
1.015
0.999
1.007
2.025
65.1
83
4
1.015
1.003
1.009
2.020
71.8
91
5
1.013
1.003
1.008
2.022
99.1
126
6
1.017
1.000
1.009
2.021
98.1
125
7
1.009
1.013
1.011
2.020
91.9
117
8
1.016
1.005
1.011
2.018
61.3
78
9
1.013
1.010
1.012
2.019
131.5
167
10
1.004
1.009
1.007
2.019
105.6
134
11
1.010
1.007
1.009
2.024
97.8
125
12
1.013
1.005
1.009
2.020
119.7
152
13
1.010
1.006
1.008
2.024
124.6
159
the Technology Interface/Spring 2007
Harby, Ollison, Townsend, and Ulmer
Appendix G Table G1 Horizontal Build (0) - 48 Hour Cure Time - 75 0 F. Cure Temperature Measurements Sample No.
Dia. 1
Dia. @ 90
1
1.005
2
0
Compression
Ave. Dia.
Length
Lbs.
P.S.I.
1.022
1.014
2.017
44.7
57
1.008
1.010
1.009
2.018
42.4
54
3
1.002
1.010
1.006
2.021
41.7
53
4
1.009
1.013
1.011
2.022
45.8
58
5
1.017
0.999
1.008
2.021
49.1
63
6
1.014
1.011
1.013
2.020
44.3
56
7
1.016
1.005
1.011
2.020
53.9
69
8
1.016
1.003
1.010
2.019
65.7
84
9
1.006
1.026
1.016
2.019
52.3
67
10
1.006
1.021
1.014
2.019
47.0
60
11
1.013
1.018
1.016
2.017
46.3
59
12
1.007
1.014
1.011
2.020
46.8
60
13
1.009
1.015
1.012
2.019
49.4
63
the Technology Interface/Spring 2007
Harby, Ollison, Townsend, and Ulmer
Appendix H Table H1 Horizontal Build (0) - 48 Hour Cure Time - 150 0 F. Cure Temperature Measurements
Compression
Sample No.
Dia. 1
Dia. @ 900
Ave. Dia.
Length
Lbs.
P.S.I.
1
1.006
1.011
1.009
2.019
42.2
54
2
1.006
1.012
1.009
2.019
43.3
55
3
1.005
1.001
1.003
2.019
51.5
66
4
1.002
1.021
1.012
2.020
61.6
78
5
1.006
1.011
1.009
2.019
48.6
62
6
1.013
1.012
1.013
2.019
54.9
70
7
1.016
1.003
1.010
2.019
68.7
87
8
1.007
1.006
1.007
2.019
83.8
107
9
1.005
1.015
1.010
2.019
86.7
110
10
1.012
1.010
1.011
2.017
48.9
62
11
1.012
1.001
1.007
2.020
77.9
99
12
1.010
1.006
1.008
2.019
62.9
80
13
1.022
1.001
1.012
2.024
85.4
109