Service Quality - Developing a Service Quality Index (SQI) in the Provision of Commercial Bus Contracts David A. Hensher, Peter Stopher and Philip Bullock, Institute of Transport Studies, Faculty of Economics and Business The University of Sydney, NSW 2006
[email protected] [email protected] [email protected]
26 September 2001 ABSTRACT The measurement of service quality continues to be a challenging research theme and one of great practical importance to service providers and regulatory agencies. The key challenges begin with the identification of the set of potentially important dimensions of service quality perceived by passengers, current and potential. We then have to establish a way of measuring each attribute and identifying their relative importance in the overall calculation of satisfaction associated with existing service levels. Once a set of relevant attributes has been identified, this information can be integrated into programs such as monitoring and benchmarking, and even in contract specification. This paper, building on earlier research by the authors, investigates ways of quantifying service quality and comparing the levels within and between bus operators. The importance of establishing suitable market segments and the need to scale the service quality index for each operator to make meaningful comparisons is highlighted.
BACKGROUND There is extensive literature (Fielding et al 1985) on measuring the cost efficiency and cost effectiveness of bus services and operations. A major data input is the level of service output, typically measured on the demand side by annual passenger trips or passenger kilometres and on the supply side by vehicle kilometres. As aggregate indicators of total output, these measures implicitly assume homogeneity of service quality. Passengers, however, evaluate services in many ways that may not be systematically associated with the amount of use of the service; indeed it is unclear whether aggregate passenger kilometres can be a proxy for differences in passenger satisfaction across bus segments. Several studies have since refocused on the measurement of service quality, investigating the role of trade-off methods such as stated preference (eg Prioni and Hensher 2000, Hensher 1991 and Swanson et al 1997) and univariate procedures that rate individual service items on a satisfaction scale (Cunningham et al 1997). Although a passenger may perceive specific aspects of service quality as either positive or negative, we assume that the overall level of passenger satisfaction is best measured by how an individual evaluates the total package of services offered. Appropriate weights attached to each service dimension will reveal the strength of positive and negative sources of overall satisfaction. The stated preference (SP) paradigm enables us to develop preference formulae for a large number of service level scenarios, which can be implemented at the bus business level to establish operator-specific indicators of service delivery quality and effectiveness. The resulting satisfaction (utility) indicators obtained from the SP experiments measure the expected utility that a passenger obtains from the current levels of service and how this might change under alternative service level regimes 1 . In 1999, the Institute of Transport Studies (ITS) began researching ways the bus and coach industry in New South Wales (Australia) might capture customer satisfaction with service levels (Prioni and Hensher 2000, Hensher and Prioni in press). The intention was to provide insights into how quality could be built into a possible future government performance assessment regime, including calculating value for money in commercial bus contracts. It would also provide insights into the effectiveness of service levels from a passenger viewpoint and identify which service aspects are working best and which need more improvement. ITS undertook a pilot program in which an on-board customer survey was undertaken with the support of 25 operators, focusing on a current trip and seeking information on passenger perceptions of service levels on 13 predetermined attributes. Stated choice (SC) methods were used, in which a sample of passengers were asked to choose their most preferred package from a number of alternative packages of service levels based on these attributes. Multinomial logit (MNL) models were estimated to establish the relative weights attached to the statistically significant attributes, representing the contribution of each service attribute to the calculation of an overall Service Quality Index (SQI). The pilot program showed the value of SQI as a way to capture customer perceptions of service quality. In 2000, we embarked on the development phase. Two key features were identified that needed more attention: selection of service segments within an operator’s domain, and a carefully structured sampling plan. This paper presents the findings of this development phase. One major public operator and one major private operator were invited to participate and asked to propose service segments. A total of nine segments were surveyed in this current round, sufficient to establish a benchmarking capability for ongoing monitoring for each segment and, through aggregation, for each operator. First is an overview of the data requirements for quantifying SQI, including the selection of the attributes and the role of stated choice methods. The sampling plan is then presented. The logistics of data collection are described followed by a summary of the sample responses and a profile of the data on passenger perceptions of current service levels. Next, we describe the statistical models that establish the weights associated with each attribute in each service segment for each operator. Because we wish to benchmark each operator’s market segment against the other segments, we introduce some specific details of how the statistical analysis is undertaken. In brief, because the relative importance of an attribute in a segment is scaled for comparability within the segment, to be able to undertake comparisons between segments we have to rescale the weights. The SQI measures are then calculated for each market segment with a comparison between each segment in terms of the overall SQI and its constituent attributes. The paper concludes with a summary of major findings.
1
Given the heterogeneity of the population of bus passengers, segment-specific service quality indicators can be identified.
DATA REQUIREMENTS AND ATTRIBUTE SELECTION FOR SERVICE QUALITY MEASUREMENT The Stated Preference Approach The task is to develop an SQI that can be incorporated into a performance assessment regime that measures service effectiveness meaningfully from a passenger perspective. Such an index should be able to be decomposed into its constituent sources of passenger satisfaction. It should also map into an aggregate demand-side indicator of passenger output to establish the role of the latter as a practical approximation of the social welfare significance of bus service levels. With a complex disaggregation of service quality, data reflecting the experience from an existing trip alone, referred to as revealed preference (RP) data, are usually inappropriate. There is potentially too much confounding in RP data. Furthermore some attributes of interest (e.g., air conditioning, low floor entry) may not exist today on many urban buses, so their influence cannot be determined. SP methods provide the data richness required for quantifying an SQI, involving an SC experiment in which we systematically vary comb inations of levels of each attribute to reveal new opportunities relative to existing service levels (Hensher 1994, Hensher et al 1999, Louviere et al 2000). The attributes must be anchored to current experience, so that respondents can understand and relate to the attribute levels in a realistic way (Stopher 1998). It is then important to create the other possible levels as reasonable variations on either side of current experience. Failure to do this leads to respondents providing poor quality and inappropriate responses, as they try to relate to attribute levels that are totally outside their experience and sometimes difficult to imagine (Louviere et al 2000). Through the experimental design approach, we survey a sample of travellers making choices between the current and other trip attribute level bundles. This approach is capable of separating out the independent contributions of each service component and hence is capable of providing an SQI that is a rich representation of the sources of service (dis)utility. Defining the Empirical Setting and the SP Experiment To help select attributes for SQI, we undertook an extensive literature review and a survey of bus operators with a wealth of experience on what customers look for in a good service (Prio0ni and Hensher 2000). We also benefited from the earlier pilot study (2). Together with extensive discussions during the development stage with key bus operators in Sydney, we concluded that thirteen attributes describe the major dimensions of service quality fro m a user’s perspective2 . The range of levels selected for each attribute are shown in Table 1. The attribute ranges were selected in consultation with the operators as representative of achievable variability. Table 1: Attributes and Attribute Levels in the SP Experiment 1 2 3 4 5 6 7 8 9 10 11 12 13
Attribute Bus travel time Bus fare Ticket type
Level 1 25% less 20% less Cash fare 50% more service
Level 2 Same Same Pre-purchased bus-only 10trip ticket ( ) or weekly ( ) Same as now
Level 3 25% more 20% more Integrated (bus and other mode) 50% less service
Buses per hour at this bus stop (i.e., frequency) Time of arrival at bus stop Time walking to bus stop Seat availability on bus Information at bus stop Access to bus Bus stop facilities Temperature on bus Driver attitude General Cleanliness on board
On time Same Seated all the way Timetable and map Wide entry, no steps Seats only Too hot Very friendly Very clean
5 min late An extra 5 mins Stand part of the way Timetable, no map Wide entry, 2 steps Seats under cover Just right Friendly enough Clean enough
10 min late An extra 10 mins Stand all of the way No timetable, no map Narrow entry, 4 steps No seat or shelter Too cold Generally unfriendly Not clean enough
Through a formal statistical design, the attribute levels are combined into bus packages before being translated into a survey form. The full factorial design consists of 313 combinations of the three levels of the13 attributes. To produce a practicable and understandable design for respondents, we restricted the number of 2
These 13 attributes are not the same set as those evaluated in the pilot.
combinations to 81 choice sets using a fractional design that permits reduction of the number of bus packages, without losing important statistical information (Louviere et al 2000). A pretest showed that respondents were able to evaluate consistently three choice sets resulting in 27 different survey forms. To allow for a rich variation in the combinations of attribute levels to be evaluated as service packages in the SP experiment, each bus operator received 8 sets of 27 different survey forms (i.e., 216 forms) and instructions on how to organise the survey. Sampling Strategy The overall sampling plan was to distribute approximately 500 surveys on each of three segments (route types) from each of three depots, totalling 4,500 surveys. In addition, each of peak and off-peak runs were to be surveyed in each segment. The sample design was a multistage sample where the first stage was a stratified sample of routes within segments, the second stage a stratified sample of bus runs within sampled routes for each of peak and off-peak, and the third stage a census of riders on selected runs. The third stage census makes it easier to administer in the field, because the surveyors do not have to perform any type of selection process, and cannot introduce a bias into the procedure. It also reduces the addition of further sampling error at this stage. In this paper, the segments are assigned the identifiers S1 to S9. Some segments were CBDbased services while others were local and cross regional services serving rail stations and local centres. Peak travel was sampled more heavily than off-peak, with 2,700 surveys in the peak (7am –9am) and 1,800 in the off-peak (10a m-2pm). Within each depot, the surveys were assigned equally to each segment. Thus, each segment was to have 500 surveys distributed, with 300 in the peak and 200 in the off-peak, rounded upwards to allow complete runs to be sampled. Each route in these segments was sampled approximately equally, as far as average ridership per run allowed. For 3 segments, there were only two or three routes in each segment. In the 6 other segments, there were too many routes to allow even one run per route to be included in the sample, so a simple random sample of routes and runs was chosen from each segment, until the desired expected ridership was reached. Logistical Issues in Data Collection The coordinator for each operator was briefed the week before the survey began and provided with the survey forms (sorted by bus segment) and the sampling rules. ITS sorted and allocated the 27 sets of survey forms, to ensure an equal distribution within each segment. The survey was undertaken in the last week of November and first week of December in 2000. One operator used their own senior staff to distribute and collect the forms and the other operator hired a survey firm for this task. Although specific bus runs were provided by the sampling plan, the most important compliance condition was that the appropriate number of forms were distributed within each route within each segment for each of the two time periods (7-9am and 10am-2pm). For certain segments, operators were concerned about crowding conditions hampering the distribution of the forms. Shortage of interviewers on these segments combined with a higher number of bus runs meant that the required number of surveys could always not be circulated. In addition, there were often few customers on off-peak services as well as more elderly passengers for which there was a high rate of refusal. For other segments crowding was not a concern and so the full number of survey forms could be distributed using a similar number of interviewers as on the more crowded segments. For the off-peak components of S2 and S3 the actual number of forms distributed exceeded the planned distribution, though this did not offset the shortfall in peak distributions. Overall, sufficient forms were returned to undertake the segment-specific analysis and determination of SQI. SAMPLE RESPONSE Table 2 presents response rates in several ways for each operator, segment and time of day. First is the planned distribution, followed by the number returned. The survey instrument comprised two double-sided A4 pages. The first side had 25 questions about the current trip and the respondent. Each of the remaining three sides set out one choice set for the SP experiment. The returns are grouped into four categories: front page details (RP) incomplete, RP completed only, RP plus one experiment only completed, RP plus two experiments completed, and entire form completed. Surveys that have the RP and at least one SP experiment completed are useful in statistical analysis: usable surveys are the sum of the latter three categories.
Table 2: Response Rates by Segment Segment
Time of day Planned Dist
S1
Peak Off-peak Peak Off-peak Peak Off-peak Peak Off-peak Peak Off-peak Peak Off-peak Peak Off-peak Peak Off-peak Peak Off-peak
S2 S3 S4 S5 S6 S7 S8 S9
343 200 241 158 328 216 310 203 322 210 302 193 337 224 303 220 297 214
Status of Survey Form Completion Total RP RP RP + RP+ RP+ Responses incomplete only SP1 SP1+ SP1+ SP2 SP2+ SP3 21 31 10 15 86 163 1 50 12 9 84 156 2 27 4 11 60 104 26 51 9 12 90 188 69 23 5 11 59 167 59 69 17 13 74 232 10 39 12 13 68 142 9 47 8 6 64 134 13 45 16 19 98 191 8 72 12 14 86 192 13 51 15 11 49 139 8 52 16 16 35 127 0 20 6 16 95 137 1 45 9 8 38 101 2 6 3 5 43 59 4 42 15 8 46 115 2 12 5 4 28 51 2 17 1 9 29
Total usable responses (% of total responses)
Usable responses as % of Planned Dist
111 (68) 105 (67) 75 (72) 111 (59) 75 (45) 104 (45) 93 (65) 78 (58) 133 (70) 112 (58) 75 (54) 67 (53) 117 (85) 55 (54) 51 (86) 69 (60) 37 (73) 10 (34)
32 53 31 70 23 48 30 38 41 53 25 35 35 25 17 31 12 5
The actual number handed out is not known. This was partly due to the method used to administer the survey. When respondents returned blank forms, interviewers handed the same form to the next passenger. Logistical issues such as these will need to be re -assessed for future surveys. The number handed out was also not always the same as designed, because there were runs on which there were fewer passengers than expected. These response rates are considered good for an on-board bus survey, where response rates are often as low as 15 to 25 percent. Only 3 segments showed a response rate against the planned distribution below 25 percent. In addition, completion rates of the surveys are considered good for on-board surveys indicating that the instrument is working well and that response to the survey has been positive. However, although interviewers were instructed not to give surveys to schoolchildren, they did so, which inflated the numbers somewhat, while providing surveys that must be excluded. Data Profile Table 3 provides a profile of the socioeconomic composition of sampled passengers. For each categorical person characteristic we provide the distribution of category membership; for each continuous variable we provide the mean, standard deviation and range. In Table 3, totals are the number of respondents, excluding school children, who completed one or more SP experiments. Age and income were transformed from categorical data to continuous data (for modeling purposes). Lowest (18 and under) and highest age categories (65 and over) were recoded into 18 and 70 respectively. The lowest (under $12,000) and highest (over $80,000) income categories were recoded into $12, 000 and $100,000 respectively. Table 3: Socioeconomic Data by Segment Variable (%) Gender Female Male Missing Total (N) Main occupation (%) Employed full time Student Looking for work Retired or pensioner
Segment S5 S6
S1
S2
S3
S4
56.0 40.7 3.2 216
62.4 34.4 3.2 186
60.3 36.3 3.4 179
66.1 33.3 0.6 171
57.1 40.8 2.0 245
38.4 18.5 11.6 11.1
40.9 23.7 5.9 5.9
41.3 17.9 7.3 13.4
56.7 24.0 4.1 3.5
43.3 27.8 2.4 13.9
S7
S8
S9
All
54.2 36.6 9.2 142
52.9 45.9 1.2 172
65.0 33.3 1.7 120
46.8 51.1 2.1 47
58.6 38.5 2.9 1478
37.3 14.1 2.1 38.7
68.6 11.6 1.7 10.5
46.7 18.3 3.3 19.2
51.1 23.4 4.3 6.4
46.5 20.2 5.0 13.4
Home duties Other Missing Total (N) Age (years) Mean Standard Deviation Missing N N Income (dollars) Mean Standard Deviation Missing N
10.6 9.3 0.5 216
12.4 9.7 1.6 186
13.4 5.6 1.1 179
3.5 6.4 1.8 171
3.3 9.0 0.4 245
2.8 4.2 0.7 142
1.7 4.7 1.2 172
33.5 14.6 1 216
31.7 13.5 2 186
36.2 16.0
34.4 13.4 2 171
35.7 16.1 3 245
43.7 19.6 1 142
37.7 15.3 2 172
39.6 16.8
28590.4 16688.5
31664.9 22147.3 2 186
28935.8 17014.7
37918.5 20518.9 2 171
30573.6 19980.2 3 245
28652.2 18149.8 2 142
48436.0 24316.4 2 172
32406.9 19190.7
216
179
179
7.5 5.0 120
120
120
4.3 8.5 2.1 47
6.9 7.1 0.9 1479
35.3 14.7 1 47
36.1 15.9 12 1497
36584.8 22198.3 1 47
33294.8 20845.2 13 1479
The attributes associated with the SP design are summarised in Table 4 and Table 5 but only for the levels associated with the current trip (RP levels). These are useful, because they are the basis of the input data used to calculate the SQI. A very high proportion of the sample had a seat all the way, suggesting either that there were few standing passengers or that standing passengers found it difficult to complete the surveys. This will need to be checked in future surveys, because it may be a potential source of bias. The other attributes have a good spread of responses in at least two of the three levels. On-board temperature is “just right” for about 75% of passengers; the balance see it as too hot (and rarely too cold). Buses tend to be either very clean or clean enough and drivers tend to be very friendly or friendly enough. Table 4: Revealed Preference Data by Segment (Categorical Variables) Attribute (%) Seat all the way Stand for part of the way Stand all the way Total (N)
S2
S3
95.8 3.2 0.9 216
97.3 2.7
96.6 2.8 0.6 179
Seat availability on bus 92.4 91.4 5.8 8.6 1.8 171 245
186
S4
Segment S5 S6
S1
S7
S8
S9
All
95.0 5.0
100.0
142
94.8 3.5 1.7 172
120
47
95.3 4.1 0.6 1478
45.8 37.3 16.9 142
32.6 58.1 9.3 172
24.2 62.5 13.3 120
8.5 74.5 17.0 47
24.1 49.9 26.0 1478
99.3 0.7
Seats only Seats under cover No seats or shelter Total (N)
6.9 52.8 40.3 216
10.2 30.1 59.7 186
15.6 49.7 34.6 179
Bus stop facilities 36.8 31.4 48.5 54.3 14.6 14.3 171 245
Timetable and map Timetable but no map No timetable and no map Total (N)
9.7 32.9 57.4 216
4.8 30.6 64.5 186
5.0 30.7 64.2 179
Information at bus stop 25.1 27.3 49.7 48.6 25.1 24.1 171 245
18.3 40.1 41.5 142
18.6 45.3 36.0 172
6.7 18.3 75.0 120
8.5 27.7 63.8 47
14.8 37.7 47.5 1478
Wide entry, no steps Wide entry, two steps Narrow entry, four steps Other Total (N)
8.8 74.5 13.4 3.2 216
8.1 78.0 7.5 6.5 186
24.6 57.0 12.8 5.6 179
Access to the bus 19.9 37.6 70.2 55.1 4.7 4.1 5.3 3.3 171 245
4.2 77.5 14.1 4.2 142
45.9 44.2 5.8 4.1 172
49.2 41.7 5.8 3.3 120
29.8 61.7 6.4 2.1 47
24.5 62.8 8.4 4.3 1478
Just right Too hot Too cold Total (N)
60.6 38.9 0.5 216
68.8 31.2
72.6 26.3 1.1 179
Temperature on bus 77.8 87.3 19.3 6.1 2.9 6.5 171 245
45.1 52.8 2.1 142
64.0 32.6 3.5 172
76.7 22.5 0.8 120
89.4 10.6 47
70.6 27.1 2.3 1478
27.9
Cleanliness of bus 24.0 29.4
26.1
33.7
34.2
36.2
29.0
Very clean
24.1
186 32.3
Total (N)
70.4 5.6 216
65.6 2.2 186
69.8 2.2 179
Very friendly Friendly enough Very unfriendly Total (N)
36.6 59.7 3.7 216
42.5 54.3 3.2 186
40.8 55.3 3.9 179
Clean enough Not clean enough
70.8 5.3 171
65.3 5.3 245
Friendliness of Driver 15.2 30.6 78.9 62.4 5.8 6.9 171 245
69.7 4.2 142
57.0 9.3 172
59.2 6.7 120
53.2 10.6 47
65.8 5.2 1478
34.5 61.3 4.2 142
18.0 77.9 4.1 172
24.2 72.5 3.3 120
34.0 66.0
30.9 64.7 4.4 1478
47
On-time running (i.e., unreliability) shows buses arriving up to 25 minutes early or late with an average in the 0.2-3 minute range. The majority of buses however arrived between 3 minutes early and 3 minutes late. This is one attribute on which the regulator places a great deal of importance (because it is relatively easy to measure external from the passenger); as shown later, it is also a statistically significant influence for the passenger. Overall, the majority of respondents from one operator (50.6%) chose their current bus package (choice C), with the remainder of the choices being divided almost equally between package A (25.9%) and package B (23.5%). In the case of the other operator, 46 percent chose their current bus package, with the remainder of choices again being divided fairly equally between package A (29.2%) and package B (24.8%). STATISTICAL ANALYSIS TO QUANTIFY SERVICE QUALITY SQI and Importance Weights The derivation of SQI requires statistical estimation of models that reveal the importance weights attached to each attribute by the sample of passengers in each segment. The perceptions of passengers relative to the levels of each attribute as experienced in a current trip, and the levels offered in each SP package, together with the choice of the preferred trip package provide the necessary information to identify the importance weights. When the weights are identified, we have to multiply each attribute level associated with the current trip by the relevant weight and sum these calculations across all attributes to produce the SQI for each sampled passenger. An average across all sampled passengers using a specific segment provides the segment SQI, which measures overall perceived satisfaction with existing service levels. Each segment will have an overall SQI as well as information on the contribution of each attribute to that SQI. The latter is very useful in helping the operator gain an understanding of what are the main positive and negative influences on the overall level of passenger satisfaction with current services. Table 5: Revealed Preference Data by Segment (Continuous Variables) Attribute (%)
S1
S2
S3
S4
Segment S5 S6
S7
S8
S9
All
Minimum Maximum Mean Standard Deviation N
0.2 30.0 5.5 5.4 216
0.5 30.0 5.0 4.9 186
Time to get to bus stop (minutes) 0.5 0.2 1.0 0.5 30.0 30.0 30.0 30.0 5.2 5.4 8.3 7.2 5.6 5.1 6.2 5.9 179 171 245 142
1.0 30.0 7.4 5.4 172
0.5 30.0 7.5 6.2 120
1.0 25.0 6.0 5.8 47
0.2 30.0 6.4 5.7 1478
Minimum Maximum Mean Standard Deviation N
-12.0 17.0 1.9 4.3 216
-0.18 10 0.76 4.3 186
On time unreliability of bus (minutes)3 -0.24 -20.0 -25.0 -23.0 19 20.0 19.0 20.0 1.2 3.51 1.1 1.2 4.7 5.34 4.9 4.9 179 171 245 142
-20.0 20.0 0.8 4.8 172
-16.0 20.0 0.2 4.3 120
-23.0 15.0 0.4 6.8 47
-25.0 20.0 1.4 4.9 1478
Minimum Maximum Mean
1.0 12.0 3.6
1.0 12.0 2.7
Number of buses in one hour interval 1.0 1.0 1.0 1.0 5.0 12.0 12.0 12.0 2.0 4.9 4.8 3.6
1.0 12.0 5.2
1.0 10.0 2.3
1.0 9.0 2.8
1.0 12.0 3.7
3
Number of minutes that the bus was late. Negative values refer to the bus running early.
Standard Deviation N
1.7 216
1.4 186
0.7 179
2.4 171
2.7 245
2.0 142
2.5 172
1.2 120
1.6 47
2.3 1478
Minimum Maximum Mean Standard Deviation N
5.0 60.0 17.3 9.1 216
5.0 45.0 17.9 9.0 186
Travel time on bus (minutes) 5.0 6.0 5.0 30.0 60.0 60.0 13.8 30.3 24.8 4.8 13.1 13.9 179 171 245
5.0 60.0 19.7 10.8 142
7.0 60.0 32.2 10.1 172
5.0 60.0 22.7 11.4 120
4.0 30.0 17.1 7.5 47
4.0 60.0 22.1 12.2 1478
Minimum Maximum Mean Standard Deviation N
0.10 5.85 1.97 0.84 216
0.07 6.34 1.95 0.89 186
Cost of current one way fare (dollars) 0.32 0.52 0.52 0.52 6.50 5.00 7.20 7.20 1.77 1.96 2.03 1.66 0.98 0.91 1.36 1.17 179 171 245 142
0.60 9.00 2.26 1.24 172
0.52 9.00 1.90 1.11 120
0.39 3.75 1.69 0.79 47
0.07 9.00 1.94 1.08 1478
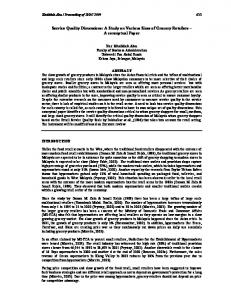
Benchmarking and Discrete Choice Modelling The multinomial logit (MNL) model identifies the importance weights (Louviere et al 2000). This simple method to obtain the importance weights has one limitation when the interest is in benchmarking SQI across segments. The desire to have separate models for each segment is linked to establishing unique importance weights for each attribute within each segment. We could naively pool the data across all segments and treat the importance weights for each attribute as the same (Prioni and Hensher 2000). In principle this is quite acceptable if there are no statistically significant differences in the levels of the importance weights across the segment samples of passengers. However, it must be demonstrated rather than assumed. For benchmarking we need to ensure that the SQI measures are comparable between segments. A discrete choice model is structured so that the information on the importance of each attribute is relative within a model. For example, if the importance weight for unreliability in segment4 1 is –0.4 and for bus fare it is -.04, then we can compare these two weights and conclude that the unreliability weight per unit of unreliability is 10 times more valuable than the bus fare weight per unit of fare. If, in segment 2, the unreliability weight from a separately-estimated model is –0.2, we cannot conclude that unreliability per unit is valued at twice the rate in segment 1 as segment 2, because each separately estimated model has a different scale structure for comparing the importance weights. Specifically, the MNL model derives importance weights with two components – scale and taste. Scale is derived from the underlying assumptions of the error structure. The MNL model assumes that this scale is the same across the alternatives being evaluated (i.e., current trip levels and the two SP packages) and can be set to 1.0. While this assumption can hold within a segment, we cannot assume that it holds across segments. If we assumed this, then we could pool the data for each segment and treat the scale as 1.0 for all alternatives associated with all segments. Because we have no way of knowing it is true before we test the assumption, we have to redefine the structure of the model to be estimated so it can reveal the extent of differences in scale (if they exist) when we pool the data. We must pool the data because we want to undertake benchmarking and must ensure that the importance weights (and hence segment SQIs) are directly comparable. To account for potential scale differences, each segment is treated as having three alternatives (current plus two SP packages), which are different because of scale differences. We then have 27 alternatives. The structure is shown in Figure 1, where each respondent provides information to one branch in the tree structure and each branch is a segment (S1,…,S9), revealing the scale differences empirically. Previous research (Hensher and Bradley 1993) shows how the scale parameter can be identified using this procedure.
4
Segments 1, 2 are general and hypothetical terms here; this discussion does not refer to specific results of this experiment.
S2
S1
...........
......
S4
S3
Curr
S5
..........
S6
S7
S9
S8
.........................
SP1 SP2
Figure 1: Nesting Structures Used in Model Estimation to Permit Comparisons of SQI Between Nine Segments SQI Model The final nested model system is summarised in Table 6. The dependent variable is binary, where the chosen package is given the value of 1.0 and the other two non-chosen packages are given the value of 0. The model then establishes the statistically most efficient weights to explain the choices made. The focus of the survey is on the attributes themselves, without reference to any particular label describing any package. Each package is a combination of attributes and associated levels and is referred to as an unlabelled alternative. Hence all the weights attached to a specific attribute (e.g., travel time) are the same across the three packages. These weights can vary between segments, but where they are not statistically significantly different, they are constrained to be the same in the final model (Table 6). Eight scale parameters have been identified relative to the scale for segment 4 which is set equal to 1.0. The overall explanatory power of this highly non-linear model is very high (a pseudo-R2 of 0.69). For a linear model this is close to 0.9. Some attributes are not statistically significant in all segments and hence their contribution to SQI is not significant. The presence of strong support for a specific statement (e.g., “this bus is very clean”) does not indicate that this is an important issue in the passenger’s overall satisfaction with the service package being offered. This choice approach, in which one evaluates the current trip levels and two alternative service packages, enables one to assess the role of each attribute in influencing the choice between service packages. Six variables are significant for all segments, namely one-way bus fare, seat all the way, stand part way, wide entry 2 steps, seat only at stop, and seat under cover. In addition, travel time is significant on all but S3, bus frequency on all but S9, access time to bus stop on all but S4 and S7, narrow 4 steps on two of the three segments where it was presented, and very clean bus on three of the four segments where it was presented. Unreliability varied, sometimes being very significant (S4, S5, S8) and in other cases not significant. Very friendly driver was never significant, and no map, no timetable was significant only once. Table 6: The Final Model Used to Identify the Importance Weights and Scale Differences between Segments for Scheduled Route Services (School Children on Passes have been excluded) Attribute Travel time (mins) One-way bus fare ($) Unreliability (mins) Access time to bus stop (mins) Bus frequency (/hr) Seat all way (1,0)
S1 -.0333 (-3.8) -.6519 (-4.5) -.0317 (-1.8) -.0248 (-2.0) .0923 (3.0) .6529 (3.8)
S2 -.0346 (-3.2) -.7136 (-4.4) -.0322 (-1.4) -.0725 (-3.9) .0840 (2.0) .6661 (3.0)
-.1850
-.4216
Stand part way (1,0) No Timetable, No 5
Segment Importance and Scale Weights (t-value in brackets)5 S3 S4 S5 S6 S7 S8 -.0249 -.0440 -.0396 -.0356 -.0280 -.0272 (-1.5) (-4.9) (-3.9) (-3.2) (-3.3) (-2.7) -.7508 -.5592 -.6394 -.5948 -.6256 -.5543 (-4.0) (-4.3) (-4.6) (-4.4) (-4.2) (-2.9) -.0626 -.0399 -.0649 -.0119 -.0116 -.1127 (-1.7) (-2.6) (-3.3) (0.5) (-.8) (-3.9) -.0859 -.0081 -.0449 -.0696 -.0128 -.0567 (-3.4) (-.8) (-3.4) (-3.4) (-1.1) (-3.6) .2729 .0490 .0858 .1187 .0869 .1440 (2.8) (2.0) (2.6) (2.2) (2.8) (2.9) .5159 .4380 .4622 .5310 .7734 .3560 (2.5) (3.1) (2.8) (2.1) (4.7) (1.9) .2367 .2367 .2367 .2367 .2367 (2.5) (2.5) (2.5) (2.5) (2.5) -.1372 -.2464 -.2913 -.2033
S9 -.0362 (-2.1) -.5543 (-2.9) -.1029 (-1.9) -.0768 (-2.7) .0523 (0.6) .9531 (2.0) .2367 (2.5) -.1210
Missing attribute weights mean that the attribute was too insignificant to report for the segment where it was highly non-significant.
map (1,0) Narrow 4 steps (1,0) Wide entry 2 steps (1,0) Seat only at stop (1,0) Seat under cover at the bus stop (1,0) Very clean bus (1,0) Very friendly driver (1,0) VTTS ($/hour) No. of observations6 Scale value
(-1.4) -.4455 (-2.7) -.5124 (-3.2) .6102 (4.2) .6102 (4.2)
3.06 580 .9835 (4.6)
(-2.3) -.1535 (-.8) -.4899 (-2.7) .6102 (4.2) .6102 (4.2) .3228 (2.9) .1704 (1.4) 2.92 511 .5019 (3.8)
(-1.1)
(-1.5)
.6102 (4.2) .6102 (4.2)
.1851 (2.5) .1851 (2.5)
.1704 (1.4) 1.99 472 .6326 (4.4)
.2089 (1.7) 4.72 454 1.0000 (fixed)
Log-likelihood Pseudo R2
.1851 (2.5) .1851 (2.5) .3228 (2.9) .2263 (1.9) 3.72 646 .7270 (4.7) -3848.9 0.69
.1851 (2.5) .1851 (2.5) .2262 (1.7)
3.59 336 .4212 (3.0)
(-1.9) -.5709 (-3.1) -.5748 (-3.3) .1851 (2.5) .1851 (2.5)
2.68 463 1.0650 (5.6)
(-1.2)
(-.5)
.1851 (2.5) .1851 (2.5) .3228 (2.9) .2263 (1.9) 2.94 304 1.0727 (4.4)
.1851 (2.5) .1851 (2.5)
3.92 122 .8370 (3.2)
Some attributes tend to be dominated by support on two levels, such as driver friendliness, bus cleanliness and getting a seat on the bus. For example, 95.6% of passenger responses described the driver as very friendly or friendly enough; and 94.8% of the passengers described the bus as either very clean or clean enough. Consequently the best specification of these attributes was achieved by setting the best level relative to the other levels. Hence “very clean” and “very friendly” are the only attributes in the model for bus cleanliness and driver friendliness. The interpretation of the importance weights is straightforward. A positive weight indicates that a very clean bus adds to utility the equivalent of its importance weight compared to a bus that is not perceived as very clean (i.e., is predominantly clean enough with a few passenger perceiving it as not clean enough). The scale parameters, varying from 1.056 to 0.483, are all statistically significant from zero and most are from 1.0, the normalised estimate for segment S4. Thus, we cannot pool the data for each segment and treat the scale as 1.0 for all alternatives associated with all segments. Thus, the SQI utility index has to be multiplied by this scale parameter to enable benchmarking. Where the SQI is positive, a scale value less than 1.0 reduces the SQI value; where the SQI is negative a scale parameter less than 1.0 increases the SQI value. Table 7 highlights the implications of ignoring the scaling on rank ordering of segments. There is substantial reordering except for S4. The implied values of travel time savings (VTTS) are informative. They vary from $2 to $4.72 per person hour. Bus users generally have lower VTTS than car and train users, with the values herein varying between 14 and 34% of the gross average wage rate of the sample. However, there is one important caveat to note – unlike previous studies we have separated out the in-vehicle time from the unreliability of travel time, which tends to otherwise inflate the mean VTTS for in-vehicle time. Table 7: SQI and its Contributing Components by Segment (all scaled) Variable Travel time One way bus fare Unreliability Bus frequency Access time to bus stop Seat all the way Stand part way No timetable no map Narrow 4 step entry Wide 2 step entry 6
S1
S2
S3
S4
Segments S5
S6
S7
S8
S9
-0.573 -1.273 -0.077 0.327
-0.315 -0.709 -0.030 0.113
-0.218 -0.859 -0.079 0.350
-1.343 -1.103 -0.159 0.236
-0.719 -0.953 -0.092 0.303
-0.300 -0.394 -0.010 0.182
-0.965 -1.412 -0.023 0.481
-0.671 -1.294 -0.150 0.360
-0.534 -0.773 -0.215 0.125
-0.135 0.617 0.000 -0.105 -0.074 -0.373
-0.176 0.327 0.000 -0.135 -0.011 -0.193
-0.286 0.317 0.000 0.000 0.000 0.000
-0.045 0.404 0.015 -0.034 0.000 0.000
-0.272 0.310 0.014 0.000 0.000 0.000
-0.212 0.222 0.001 -0.041 0.000 0.000
-0.100 0.776 0.010 -0.112 -0.059 -0.277
-0.469 0.363 0.013 -0.164 0.000 0.000
-0.382 0.798 0.000 -0.066 0.000 0.000
The minimum number of observations per respondent was 1 and the maximum was 3 (i.e., 3 or less SP experiments completed)
Seat under cover at the bus stop Very friendly driver Very clean bus SQI SQIunsc Rank Order Sc Rank Order unsc SQI Normalised to base 1
0.354 0.000 0.000 -1.313 -1.335 6 4
0.127 0.036 0.054 -0.914 -1.820 3 8
0.254 0.044 0.000 -0.476 -0.753 2 1
0.159 0.031 0.000 -1.839 -1.839 9 9
0.116 0.049 0.070 -1.174 -1.614 5 7
0.066 0.000 0.025 -0.463 -1.099 1 3
0.180 0.000 0.000 -1.501 -1.409 7 5
0.170 0.053 0.111 -1.678 -1.565 8 6
0.132 0.000 0.000 -0.915 -1.094 4 2
1.526
1.925
2.363
1.000
1.665
2.376
1.338
1.161
1.924
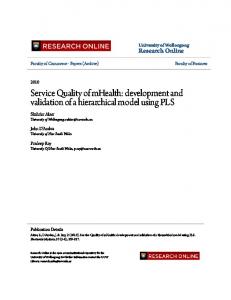
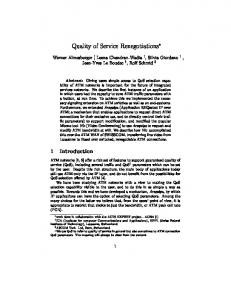
Benchmarking Service Quality The parameter estimates combined with the perceptions of service levels on each attribute associated with the current trip provide all the data necessary to derive the SQI measure for each segment. The products of each parameter and the associated attribute level across the sampled passengers are summarised in Table 7. We calculated the actual utility contribution of each attribute for each passenger, summed them in each segment and took the average. The overall SQIs are shown in Figure 2 and the contributions of each attribute are shown in Figure 3. The absolute magnitude of each line in Figure 3 represents the contribution of an attribute to the overall level of SQI. A large positive contribution (above the zero horizontal line) is clearly the preferred outcome, compared to a large negative contribution (below the zero axis). As might be expected, travel time and fare are the greatest sources of negative satisfaction. In comparison, service frequency and getting a seat are the greatest sources of positive satisfaction. Positive or negative satisfactions refer to the passenger’s current perception of service level conditioned on the relative importance to the passenger of this service level attribute. Thus the fare level is the greatest contributor to passenger dissatisfaction for all segments except S4 where travel time is a greater contributor (although fare level is still a major concern). It seems clear that reducing fares will be a major contributor to improving SQI, with travel times a close second. Operators might argue that they have limited room to move in adjusting fares and travel times, the former heavily influenced by the regulator and the latter influenced by external factors such as traffic congestion and the general quality of the road environment. Nevertheless it signals a number of issues that operators must address with the other agencies that influence their operating environment. Looking at the attributes over which the operator has more direct control, having a seat all the way is a source of substantial positive satisfaction, especially for S7, S9 and S1. Access time to bus stop combined with service frequency and service unreliability may be the key drivers of service delivery. All three attributes are substantially under the operator’s control and seem to be where the major focus for service improvements should be directed. The provision of infrastructure at the bus stop is a local government obligation in NSW. It appears that passengers in S1 are best served in respect to seat and shelter, with passengers in S6 the worst served. Bus cleanliness and driver friendliness have limited relevance to SQI across all segments. In future studies one may reconsider the need for such attributes. One might speculate that these attributes become insignificant in contrast to the fundamental attributes of time, fare, unreliability, comfort (i.e getting a seat) and service frequency. The access conditions of the bus (i.e., steps and width) have a significant negative influence for some segments (i.e., S1, S2, S7) with “wide entry with 2 steps” relative to “wide entry with no steps” having the greatest negative impact. There is clearly room for improvement here, with the potential to increase satisfaction being sufficient to impact the overall SQI rank order of the segments. This sort of diagnosis should be undertaken by each operator to reveal opportunities for service improvement. Table 8 shows the rankings of the attributes for each segment, arranged so that those contributing positively are listed first, and those contributing negatively are listed last. Those with the lowest rankings have the strongest positive effect on the SQI, while those with the highest rankings have the strongest negative effect on the SQI. As an example, consider segment S5: “having a seat all the way” and “bus frequency” are the two strongest positive contributors; “standing part way” is the smallest positive contributor, and “unreliability” the smallest negative contributor; “travel time” and “one-way bus fare” are the two largest negative contributors. “Wide2-step entry” is a greater source of negative satisfaction than “narrow 4-step entry.” This is clearly an issue for clarification in further studies.
Table 8: Ranking of the Thirteen Attributes in the SQI Attribute Positive Attributes Seat all the way Bus Frequency Seat under cover at the bus stop Very clean bus Very friendly driver Stand part way Negative Attributes Narrow 4-step entry Unreliability No timetable No map at bus stop Wide 2-step entry Access Time to bus stop Travel Time One-way bus fare
S1
S2
S3
S4
1 3 2 -
1 3 2 4 5 -
2 1 3 4 -
1 2 3 4 5
4 5 6 8 7 9 10
6 7 8 10 9 11 12
5 7 6 8
8 6 7 10 9
Segment S5
S6
S7
S8
S9
1 2 3 4 5 6
1 2 3 4 5
1 2 3 4
1 2 3 4 5 6
1 3 2 -
7 8 9 10
6 7 8 9 10
6 5 8 9 7 10 11
7 8 9 10 11
5 4 6 7 8
Determining SQI at the Depot Level and in the Future The SQI could be determined for a depot, rather than a segment, although this would lose the variability between segments, which Figure 2 and Figure 3 show to be quite large. This would be accomplished by estimating an average, weighted by the number of passengers in the segments. More correctly, the models could be re-estimated for each depot using pooled data for the depot instead of for the segments. Similarly, if the desire were to compare segments with each according to depot, this would also require re-estimating the models without the inclusion of any data from another operator (i.e., the segments of one depot in the first case, and those of the other in the second case in this experiment). If one operator decides to re-survey the same segments at some point in the future and wishes to know if there are changes in the SQI, it would be advisable first to re-estimate the weights for the SQI based on that operator’s segments alone, and then apply the new survey attribute levels with the new weights obtained in reestimation. It would also be possible to apply the new survey attribute levels to the existing weights, but the results are more clearly correct if re -estimated weights are used.
SQI by Segment Normalised to Base =1 2.5
2
1.5
1
0.5
0 S4
S8
S7
S1
S5
S9
Segment
Figure 2: SQI for Each Segment Normalised to 1.0
S2
S3
S6
SQI components 1
0.5
0
-0.5
-1
-1.5
-2 S4
S8
S7
S1
S5
S9
S2
S3
Segment Travel time
One way bus fare
Unreliability
Bus frequency
Access time
Seat all the way
No timetable no map
Narrow 4 step entry
Wide 2 step entry
Seat under cover
Very friendly driver
Very clean bus
Figure 3: Decomposition of SQI into its Components for each Segment
Stand part way
S6
CONCLUSIONS This study has progressed the development of SQI at a more detailed level within an organization than the previous pilot study. In addition we have developed and implemented a more rigorous way of identifying the importance weights to attach to statistically significant attributes that recognises the differences in scale between the utility expressions associated with each segment. This is crucial if one is to compare the performance of each segment (i.e., benchmark) meaningfully. The findings serve a number of purposes. From an operator perspective, they reveal what matters to actual customers and provide some signals as to which attributes need more effort in being marketed to potential patrons. Some of the identified influences on passenger satisfaction are not directly under the control of the bus operator and offer the challenge to influence others (e.g., local government) to contribute to making bus services more attractive. However, recognition of this within the framework of the broader set of influences on passenger satisfaction is very important. ACKNOWLEDGEMENTS: We acknowledge the support of the State Transit Authority of NSW and Busways in funding the research presented. The detailed comments of Rhonda Daniels and Stephen Rowe are much appreciated. REFERENCES Cunningham, L.F., Young, C. and Lee, M. (1997) Developing customer-based measures of overall transportation service quality in Colorado: Quantitative and qualitative approaches, Journal of Public Transportation, 1 (4), 1-22. Fielding, G.J., Babitsky, T.J. and Brenner, M.E. (1985) Performance evaluation for bus transit, in Hensher D.A. (Ed.) Competition and Ownership of Public Transit, A Special Issue of Transportation Research, 19 (1), 73-82. Hensher, D.A, and Prioni, P. (in press) A service quality index for area-wide contract performance assessment regime, Journal of Transport Economics and Policy Hensher, D.A. (1991) Hierarchical Stated Response Designs and Estimation in the Context of Bus Use Preferences, Logistics and Transportation Reviews, 26 (4), December, 299-323 Hensher, D.A. (1994) Stated preference analysis of travel choices: the state of the practice, Transportation, 21 (2), 107-33. Hensher, D.A. Louviere, J.J. and Swait, J. (1999) Combining Sources of Preference Data, Journal of Econometrics, 89, 197-221. Hensher, D.A. and Bradley, M. (1993) Using stated response data to enrich revealed preference discrete choice models, Marketing Letters, 4(2), 139-152. Louviere, J.J., Hensher, D.A. and Swait, J. (2000) Stated Choice Methods: Analysis and Applications in Marketing, Transportation and Environmental Valuation, Cambridge University Press, Cambridge. Prioni, P. and Hensher, D.A.(2000) Measuring service quality in scheduled bus services, Journal of Public Transport, 3 (2), 51-74. Swanson, J., Ampt, L. and Jones, P. (1997) Measuring Bus Passenger Preferences, Traffic Engineering and Control, June, 330-36. Stopher, P.R., (1998) A Review of Separate and Joint Strategies for the Use of Data on Revealed and Stated Choices, Transportation, Vol. 25, No. 2, pp. 187-205.