Determining Customer Service Levels - Development of a Methodology Overarching Report Andrew Speers, Stewart Burn, Darla Hatton MacDonald, Blair Nancarrow, Geoff Syme, Mike Young
© CSIRO 2002
CSIRO Urban Water
1
SETTING AND EVALUATING CUSTOMER SERVICE STANDARDS Overarching Report
A. Speers, S. Burn, D. Hatton MacDonald, B. Nancarrow, G. Syme, M. Young
BCE Doc. Number 01/199 © CSIRO July 2002
Setting and Evaluating Customer Service Standards – Overarching Report July 2002
2
Distribution List SCIRR (10) WSAA (1) UWP (4) Registry (1) File (2)
Disclaimer While all due care and attention has been taken to establish the accuracy of the material published, CSIRO and the authors disclaim liability for any loss which may arise from any person acting in reliance upon the contents of this document.
Setting and Evaluating Customer Service Standards – Overarching Report July 2002
CSIRO Urban Water
3
This report has been produced by CSIRO Urban Water. The CSIRO Urban Water is a multi-divisional initiative involving the Divisions of Manufacturing and Infrastructure Technology, Land and Water, Molecular Science and Mathematics and Information Sciences. The vision for the CSIRO Urban Water is ‘in the face of economic, social and climatic change, enable Australia’s urban water systems to improve services to the community and improve economic performance while achieving ecological sustainability”. Readers wishing to obtain more information about the CSIRO Urban Water could contact Andrew Speers on +612 9490 5437 or at
[email protected]
Setting and Evaluating Customer Service Standards – Overarching Report July 2002
4
ACKNOWLEDGEMENTS Funding was made available by the Water Services Association of Australia for the development of the methodology described in this report and its subsidiary Technical Reports and its support is acknowledged. Members of the Technical Advisory Group(s) established to support this project and which were drawn from water companies across the nation are thanked for their valuable input and guidance. Christine Kiss, Sharon Rochow and Ronnie Oborn are thanked for their valuable administrative assistance.
Setting and Evaluating Customer Service Standards – Overarching Report July 2002
CSIRO Urban Water
5
EXECUTIVE SUMMARY Reform of the Australian water industry over the past 20 years has been extensive. These reforms have changed the industry’s structures, its regulatory oversight and pricing arrangements. The reforms have delivered substantial efficiency gains in the form of lower real prices, higher dividends, higher real rates of return, higher standards and greater capital investment. While further efficiency may be available in the water industry, it is fair to say that future gains will be lower and that higher standards may result in increased prices for services. The need for regulation in the industry is self-evident, but it is imperative that it be as effective and efficient as possible and deliver real community benefits. One regulatory area of importance to the water industry is standard setting. In particular, the industry suggests that the upward trend in standards in the areas of customer service, public health and the environment is resulting in sharp increases in capital expenditure for the urban water industry. With capital costs accounting for sixty percent of the industry’s total costs and with underground pipes amounting to around seventy percent of all capital costs, setting standards for areas such as water continuity is particularly important. It is therefore valuable to make decisions on the level at which future standards will be set within a framework that evaluates both the benefits (from the customers’ perspective) and costs of the proposed higher standards; higher standards can then be adopted when it is clear that the benefits outweigh the costs. Accordingly, CSIRO Urban Water entered into a partnership with the Water Services Association of Australia (WSAA) to develop an appropriate methodology for such a framework. The project has three separate modules: •
The identification of customer preferences and a methodology for measuring these preferences;
•
The economic component which values customers’ preferences, measures social costs associated with water interruptions and develops the overall cost benefit framework; and
•
The identification and evaluation of lifecycle costs of meeting standards for water continuity.
The above framework will assist water utilities and regulators to understand better what is important to customers and will include total community costs (and not merely the costs to the water utility). The framework incorporates long-term assessments and not merely short-term impacts of such decisions. This Overarching Report shows how the component parts of the framework operate in concert to enable cost and benefits to be compared. This ‘integrated’ methodology has been developed using water system continuity as a test case. It is not the intent of this Overarching Report to provide to provide a detailed summary of the component methodologies: readers are directed to the associated technical reports in this regard. Rather, sufficient information is given to provide an insight into each component and then the application of the component methodology is demonstrated. The approach shows the interrelationships between the components and the approach a water company or regulator could take in developing standards within a cost-benefit framework. Through this work, three subordinate methodologies have been developed. These include: •
A methodology for determination of customer preferences
•
A methodology for determining customer willingness to pay to achieve their stated preferences or willingness to accept compensation if a reduction in a standard is proposed
•
A methodology and associated model for determining the cost of achieving these preferences, which can be manipulated to show the cost of difference standards under a range of policy settings Setting and Evaluating Customer Service Standards – Overarching Report July 2002
6
Utilising the above methodologies in an integrated fashion will allow cost benefit analysis of proposals to alter standards to be carried out, or quantify the cost and benefit of achieving company-determined performance goals. Included in the cost analysis are social costs, which stem from traffic disruptions and business loss due to water service interruptions. As this project was directed to developing a methodological framework and associated tools for cost benefit analysis it utilised as its ‘test case’ water service discontinuities. The approach would, however, potentially also be applicable to other water company services. It is important that it be understood that while this project delivered integrated methodologies through which cost benefit analysis could be carried out all aspect of the integrated methodology do not need to be implemented whenever a change in a standard is contemplated. Partially for this reason, the development of the methodology dealing with customer preferences included the development of a Subjective Social Indicator (SSI) which is a readily implemented approach that acts as a litmus test to determine whether customers perceive a discontinuity between the level of service provided and the investment made by Government (in this case through the water utility) in provision of that service (which would include under and over-servicing). If the SSI, which has been extensively tested for its reliability and validity, does not reveal such a discontinuity, no further action would rationally be taken. The customer preference methodology also includes a latitude of acceptance scale that allows customers to nominate service discontinuities they ‘could cope with’. This is important in that attitudes to water service interruptions are non-crystallised (i.e. firm opinions are not held). The latitude of acceptance approach can be used to determine the points at which standards might be set, assuming the cost-benefit analysis is positive. Equally fundamentally, the methodology allows identification of those aspects of services customers value (or do not wish to see as part of the service). Critical findings included: •
•
Respondents generally could cope with short interruptions, and the components of interruptions that were deemed to be important were: o
Duration of the interruption;
o
If they are notified of the interruptions;
o
Time of day the interruptions happened; and
o
The number of interruptions per year (both planned and unplanned, although there was a greater tolerance for planned interruptions than unplanned.)
Compensation was generally not expected for planned or unplanned interruptions, with customers more interested in having the problem fixed, than any form of rebate (which they felt they would pay for anyway through increased water bills)
The willingness to pay methodology was based upon the technique of Choice Modelling. While still a non-market approach, this technique is considered the state of the art in this area, and is a significant improvement on approaches such as contingent valuation that are subject to ‘context’ effects (i.e. distortion due to the way in which the questions are asked). One example of a Choice Modelling questionnaire is shown in Figure 4. By questioning a statistically valid number of customers and confronting different subsets of this number with subtly varied choices, it is possible to quantify customers willingness to pay for various attributes. The attributes selected for inclusion in the choice modelling exercise were based on the findings of the customer preference activity. By identifying attributes valued by customers and their willingness to pay for them, the benefits side of the equation is complete On the other side, of course, are costs. In this project, a model was developed to allow prediction of the costs to the utility of meeting various customer service standards. A state of the art model was developed which moves beyond the approach of existing planning models, which predict failures for cohorts of assets, to prediction of the performance of individual assets. While the model itself remains the proprietary product of CSIRO, failure curves for individual assets are available to the industry that Setting and Evaluating Customer Service Standards – Overarching Report July 2002
CSIRO Urban Water
7
can be calibrated for its particular circumstances and the experience of developing the model points the way for standardised data collection across the industry. Also developed was an understanding of the social costs associated with water service provision. These included the cost of traffic disruption due to pipe failures, repairs or replacement, and the loss to business of water service interruptions. These costs can be significant depending on the circumstances and should not be ignored. Interestingly, social costs are high at both very tight standards and very liberal ones, as social costs are incurred when pipes are frequently replaced to achieve the higher standard and frequently fail under looser regimes. (See Figure 8 for further information). The integrated methodology developed in this project represents a significant body of work, which is world leading. There is the potential to apply it throughout the Australian water industry and to promote it to the industry and its regulators overseas.
Setting and Evaluating Customer Service Standards – Overarching Report July 2002
8
TABLE OF CONTENTS ACKNOWLEDGEMENTS ..................................................................................................................................4 EXECUTIVE SUMMARY ...................................................................................................................................5 TABLE OF CONTENTS ......................................................................................................................................8 TABLE OF FIGURES ..........................................................................................................................................9 1.0
OVERVIEW OF THE ISSUES.............................................................................................................10
1.1 1.2 1.3 1.4 2
METHODOLOGICAL FRAMEWORK..................................................................................................13 2.1 2.2 2.3 2.4
3
THE PROBLEM OF AGING ASSETS AND THE DEVELOPMENT OF RISK-BASED APPROACHES ...................10 ROLE OF STANDARDS AND NEED TO DETERMINE CUSTOMER PREFERENCES ........................................11 LINK TO WILLINGNESS TO PAY OR BE COMPENSATED ..........................................................................12 INCORPORATION OF SOCIAL COSTS .......................................................................................................12 POSITION OF THE OVERARCHING REPORT .............................................................................................13 SERVICE SELECTION AND JUSTIFICATION..............................................................................................14 COMPOSITE ANALYSIS ..........................................................................................................................14 PROTECTING CUSTOMERS IN PROBLEMATIC AREAS .............................................................................14
DETERMINATION OF PREFERENCES...............................................................................................15
4 EVALUATING BENEFITS – WILLINGNESS TO PAY OR WILLINGNESS TO ACCEPT COMPENSATION ..............................................................................................................................................18 5
CALCULATING SOCIAL COSTS ..........................................................................................................21 5.1 5.2
6
THE PARMS MODEL...............................................................................................................................25 6.1 6.2 6.3
7
EXPLANATION OF THE PROCESS ............................................................................................................28 COSTS OF CHANGE TO DURATION STANDARD ......................................................................................28 COSTS OF CHANGE TO FREQUENCY STANDARD ....................................................................................30
THE BENEFIT/COST RESULT...............................................................................................................31 7.1
8
BUSINESS LOSS .....................................................................................................................................21 TRAFFIC DISRUPTION ............................................................................................................................23
APPLICABILITY OF THE METHODOLOGY ...............................................................................................32
CONCLUSION ...........................................................................................................................................33
REFERENCES ....................................................................................................................................................35 APPENDIX 1 - SSI QUESTIONS .....................................................................................................................36
Setting and Evaluating Customer Service Standards – Overarching Report July 2002
CSIRO Urban Water
9
TABLE OF FIGURES Figure 1 - Expenditure over time: Set Age Replacement vs. Strategically Managed ...........................11 Figure 2 - The Methodological Framework ...........................................................................................13 Figure 3 - Example of Latitude of Acceptance: Duration of Interruptions ...........................................17 Figure 4 - Example of Choice Modelling Set.........................................................................................20 Figure 5 - Categories of Impact on Business Customers .......................................................................21 Figure 6 - Worked Example: Business Loss due to Water Supply Interruptions..................................22 Figure 7 - Worked Example: Cost of Traffic Interruptions...................................................................23 Figure 8 - Example of Predicted Costs of Standards..............................................................................27 Figure 9 - Time of day of interruptions..................................................................................................28 Figure 10 - Case 1: Currently Reported Duration of Interruptions .......................................................29 Figure 11 - Case 2: Reduction in Allowable Duration to 4 hours .........................................................29 Figure 12 - Cost of Adopting 4-hour Standard.......................................................................................29 Figure 13 - Costs of Changed Frequency Standard................................................................................30 Figure 14 - Cost/Benefit Analysis - Duration Of Interruptions (6 hours to 4 hours) .............................31 Figure 15 - Cost/Benefit Analysis - Interruption Standard (1 p.a.) ........................................................31
Setting and Evaluating Customer Service Standards – Overarching Report July 2002
10
1.0 OVERVIEW OF THE ISSUES The following sections set out in detail the forces that are driving water companies to seek ways to manage their expenditure on pipeline assets. Put as simply as possible the following statements define the problem: •
Asset management costs tend to rise in response to more stringent regulation and as assets age
•
Risk based asset management strategies have been adopted to mitigate rising costs, but further development of these techniques is warranted
•
Standards need to reflect customer demands
•
The benefits customers gain from changes in standards should be greater than the costs of achieving them
Social costs of interruptions need to be considered within the equation The potential impact of changed standards on costs is self-evident. Where efficiency gains have already been driven from an industry – as the water industry claims – total outlays must increase if improved performance is required. A system operating 24 hours a day will occasionally suffer interruptions. Generally speaking, the likelihood of unexpected interruptions can be reduced if pipelines and related assets are replaced more frequently. Our modelling, however, shows that replacement of these component parts is often more expensive than repair. As replacement strategies begin to dominate over repair, costs increase along an exponential curve. Depending where one is on the curve, the impact of moving to a more stringent standard can be significant.
1.1
The Problem of Aging Assets and the Development of Risk-based Approaches
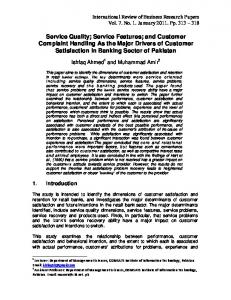
Water pipeline assets age at different rates, due to the different materials used, the conditions in which they are laid, the pressures they operate under and other factors. Nevertheless, there is a large cohort of assets now reaching ‘middle age’. This is due to the rapid expansion of water and sewerage services after World War II to the mid-1970s. Assets created in that period are now between 27 and 57 years old. Consequently, water authorities around the world have predicted a bulge in expenditure in coming years, as illustrated in Figure 1, below.
Setting and Evaluating Customer Service Standards – Overarching Report July 2002
CSIRO Urban Water
11
Figure 1 - Expenditure over time: Set Age Replacement vs. Strategically Managed 5 4.5 4 Expenditure
3.5
Expenditure based on set age replacement Strategically managed expenditure
3 2.5 2 1.5 1 0.5 0 2005
2010
2015
2020
2025
2030
2035
2040
2045
2050
As indicated, pipes age at different rates and the consequence of their failure is not equally significant in all locations. Thus, the industry has adopted risk management strategies reflecting the likelihood and consequence of failure, and incorporating new techniques of condition monitoring. These techniques allow some prioritisation of asset renewal and replacement, which flattens the predicted expenditure curve, as shown in the pink line in Figure 1. Understanding of the performance of pipes is, however, largely based on historical evidence. For some materials, such as PVC, there is a paucity of such evidence, and the capacity for operators to predict performance is limited. Further, the effects on individual assets of operating conditions (pressure, aggressiveness of soils etc) are not well developed, increasing the uncertainty and the likelihood of failure of critical assets. Reduction of this uncertainty would improve predictive ability of operators such that risk strategies become more robust. There is consequently a need for further development of risk-based models and techniques. These techniques should seek to provide estimates of costs based on the optimal mix of asset management strategies such as replacement, maintenance and policy options.
1.2
Role of Standards and Need to Determine Customer Preferences
Any asset management strategy must be directed to some type of goal. Higher standards will accelerate replacement of assets, and lower standards will defer them. In Australia regulators set goals for performance of assets as an aspect of preventing the abuse of monopoly power. Often mandatory standards are included in Operating Licences or similar instruments specifying performance. Thus, for example, Melbourne retail water companies are regulated on the number of interruptions. Other jurisdictions may regulate duration of interruptions or cumulative duration of interruptions. Asset management strategies are directed toward achieving these goals at the lowest possible cost through use of techniques such as clamping, replacement, pressure management and reduction in ‘shut-off block size’ (i.e. reduction in the number of properties between valves). The derivation of these standards is, however, often historically based. That is, upon the introduction of regulation the standards adopted were those particular water companies were attempting to achieve to meet their perception of what constituted quality service. These were based on the water authorities’ knowledge of the level and type of complaints it received from customers at the time. In
Setting and Evaluating Customer Service Standards – Overarching Report July 2002
12
any case, standards are inconsistent even within the same jurisdiction and may not accurately reflect current customer requirements. Thus, a robust methodology for determining customer preferences is important if the industry is to meet the expectations of those to whom it provides a service. That such a methodology has not been fully developed reflects the fact that analysis of customer preferences is difficult and appropriate tools have not, to date, been available.
1.3
Link to Willingness to Pay or Be Compensated
Identification of customer preferences does not quantify the value received from those preferences were they to be met. Consequently, it is important that they be quantified though identification of a customer’s willingness to pay for their achievement. That is, a choice of one or more options might be easily made if the context of the cost consequences of these choices is not also provided. A customer may readily nominate a high standard without understanding cost impacts. As a result, various techniques have been developed which attempt to elicit customers’ willingness to pay for higher standards or willingness to accept compensation if standards are lowered. To date, however, these techniques have been subject to significant and valid criticism. The challenge within this project was to overcome – to as great an extent as possible – the short-comings of these techniques to develop a robust method of determining customer’s willingness to pay for current or improved standards, or willingness to accept compensation for lower standards. The state of the art mechanism for assessing willingness to pay or accept is a technique known as choice modelling.
1.4
Incorporation of Social Costs
When an interruption to service occurs, and repairs need to be effected, a range of costs is incurred by third parties that are not usually included in calculations of the cost of the repair. That is, repair costs are usually taken to include only the cost of materials and labour. However the financial impact of the interruption on certain groups may be significant; loss of a restaurant’s business or traffic delays caused by excavation are examples. As long as these costs are not included, the cost of an interruption is understated and cost-benefit analyses carried out on a changed standard will be flawed. This project sought to identify and quantify these unaccounted for costs.
Setting and Evaluating Customer Service Standards – Overarching Report July 2002
CSIRO Urban Water
2
13
METHODOLOGICAL FRAMEWORK
The intent of this project is simple: to develop a methodology to identify customer preferences; their willingness to pay to achieve these preferences (or willingness to accept compensation where a reduced standard is contemplated) and the cost of achieving their preferences (on a whole of life cost basis, taking into account social costs). This methodology allows robust cost benefit analysis to be carried out, as illustrated in Figure 2.
Figure 2 - The Methodological Framework
Customer Preferences Willingness to pay or be compensated Whole Life Cost of Assets
2.1
What Customers want
Benefits Benefit/Cost ratio
What Customers will pay
What it costs to provide service
Costs
Position of the Overarching Report
The Project’s methodology can be broken down into three separate components: Identification of Preferences; Valuation of Preferences and Costing of service provision and third party impacts. This Overarching Report demonstrates the way these components are linked and can be used by water companies and regulators to set standards within a cost benefit framework. The detail of each component is contained in separate technical reports, as follows: •
The Development of a Methodology for Assessing Customer Preferences for Levels of Service – Continuity of Supply (ARCWIS, 2001)
•
Valuing Water Supply Interruption Preferences: The Development of a Methodology (Hatton MacDonald, D. and Young, M., et al. 2002)
•
The Cost of Customer Preference: The Development of a Pipeline Asset Risk Management System – PARMS (Burn, L.S. et al. 2002)
The Overarching Report is not an attempt to summarise the underlying technical reports. Rather, its purpose is to outline the basic methodological steps included in our approach and the application of those steps such that efficacy of the methodology is demonstrated. In providing such a description, it is important to keep in mind that the project was undertaken using sample sets of consumers in two major metro areas (Adelaide and Melbourne) with some additional work on the preferences of neighbourhood shop owners in Perth. Therefore, while this report shows the way in which the Setting and Evaluating Customer Service Standards – Overarching Report July 2002
14
methodology would be used, using actual results, the data sources are geographically disparate and the results not necessarily applicable to any one site. Tremendous care is necessary when transferring anything other than the methodology to any location, including cities where part of the work was undertaken. All integrated analysis is for a hypothetical location.
2.2
Service Selection and Justification
The methodological framework developed through this project is applicable to all services provided by the water industry. In developing our methodology, however, we selected water service continuity as our ‘test case’ on the recommendation of the Water Services Association of Australia. Water service continuity is often regulated by various agencies through Operating Licences and achievement of increased standards represents a ‘big ticket item’ for the industry. (Note: In early focus groups convened during this project customers expressed a preference for the term ‘interruptions’ to describe breaks in continuity of water service. This term is used in the rest of this report).
2.3
Composite Analysis
This report contains examples of cost-benefit analyses that might be carried out using the methodology described here. We stress, however, that while the cost benefit analyses use actual data derived from our analysis, not all data was gathered from the same location. Consequently, the results of the analysis cannot be said to represent conditions or standards that should be set at any particular site. For example, we assume a customer base of 500,000 connections, which is broadly analogous to Adelaide. However, the cost side of the analysis was based on analyses of data on asset costs supplied by another water utility. This ‘composite’ situation is, therefore, not fictitious, as all data is real, but the cost-benefit analysis is a composite of data from different locations, compiled for the purpose of demonstrating the efficacy of the methodology.
2.4
Protecting Customers in Problematic Areas
Readers should be cognisant of the difference between average system performance (the level of service most customers would receive) and regulatory standards (generally referred to as 'safety net standards’). Safety net standards are designed to protect a small percentage of consumers who experience service significantly poorer than the bulk of the population. Examples include a maximum number of interruptions that can affect an individual property each year, or the cumulative duration of interruptions allowed in this period.) In determining a methodology for the setting of a system performance standard, the same principles apply whether consideration is being given to varying average performance or to the safety net standards. Both cases involve a clear and robust consideration of customer preferences and the benefits and costs of any change.
Setting and Evaluating Customer Service Standards – Overarching Report July 2002
CSIRO Urban Water
3
15
DETERMINATION OF PREFERENCES
We have strongly emphasised the importance of working out what the customer wants from a water service as the basis for carrying out cost benefit analysis. Water companies, regulators and customers all have views as to what constitutes a quality service, but it is customers’ opinions that must carry the most weight. A methodology is required, therefore, that enables the industry and regulators to have confidence in the views expressed by customers and that enables customers to express their preferences across the full range of attributes (that is, not just, say, frequency or duration of interruptions, or but the need for rebates or notification of interruptions and so on). Most important in determining preferences is to work out what issues ‘are on the customers’ radar’. That is, what issues are of concern to them? Standards should only be changed when it is evident that there is customer dissatisfaction with the existing circumstances. In order to determine satisfaction with a service attribute simply, but in a robust manner, a Subjective Social Indicator (SSI) was developed, based on the work of Shinn and Gregg (1984) in the United States. Unlike other methods, the work of Shinn and Gregg focused on perceptions of the current service level and government responsibility to provide the service, in order to estimate the needs of government to provide more or less of that service. In this way, the focus is shifted from the traditional approach on consumption needs of the public to the production needs of government (or in this case water utility). Our focus group work associated with the determination of customer preferences showed that the provision of water services is seen as a public good. Note, at this level of analysis the customer is expressing the need for additional investment, without making the connection that this investment may lead to higher prices. The intent of the Subjective Social Indicator (SSI) is to determine whether there is a gap between Achieved levels of Service Provision (ASP) and the Goal of Service Provision (GSP). The ASP dimension was measured by asking the respondents to rate from 1 to 10 how satisfied they are with the ways the water utility handles water pressure, quality, restrictions and interruption issues as well as their preference for greater spending on those issues. The scores from both questions above were summed and then standardised by multiplying the total scores by five so that their scores could vary from 0 to 100. These scores become an index for the ASP dimension. Two separate questions were asked to measure the GSP. Again using a 10 point scale the respondents were required to rate the importance of the ways the four water service issues are handled in regard to their present lifestyle, and the responsibility of the water utility to provide a good level of service for handling those four water service issues. The scores were again summed and standardised as above, and the standardised scores were used to represent the GSP dimensional index. The final Need for Service Provision score (which represents the gap between the GSP and ASP) would thus vary from a low of –100 to a high of +100. A negative score indicates an over-provision of service, while a positive indicates a need for improvement in the service. The quality of the service for water interruptions was found to be ‘about right’ using this scale. The sample set analysed to develop and test the methodology was drawn equally from groups who had, and had not experienced water service interruptions, to ensure that people were not just responding to their personal experience, or not responding because such conditions were beyond their experience. In the end, there was no statistically significant difference in the responses from the two groups. Some comment is required here as to why customers were asked about interruptions alongside three other unrelated water service attributes. The answer lies in our need to test for a context or ‘embedding’ effect. An embedding effect can be said to exist when customers over-state their preferences due to the context in which the questions are asked. We were aware of the risk of such Setting and Evaluating Customer Service Standards – Overarching Report July 2002
16
effects existing, because they were evident in the results of questions related to valuation of the four water service attributes. These questions were included in the questionnaires specifically to see if embedding effects were evident. The SSI – which provides evidence of concern about an attribute relative to other attributes – needed to be free of such effects if the methodology was to be considered reliable and indeed, the methodology proved to be free of embedding effects indicating that the same result would be obtained whether interruptions were considered alongside other attributes or on their own. (A full description of the tests conducted for reliability and validity are included in Section 12 of ARCWIS, 2002. The four SSI questions are reproduced in isolation in Appendix 1 to this report). We therefore propose the SSI as a key methodological advance that will enable customer preferences to be identified. However, we would not recommend that it be used completely in isolation. In our surveys, the four SSI questions were included in a range of questions relevant to the particular attribute we were investigating (interruptions). This allowed us to identify preferences related to attributes of interruptions (duration, frequency, etc), but equally importantly, it encouraged customers to come to an understanding of issues relevant to water service provision prior to them encountering the SSI questions. This is important, particularly if there is not a high awareness of issues under consideration (as was the case in our surveys). Our results showed that customers considered standards for water service interruptions were about right. Were the integrated methodology actually being implemented, investigations would stop at this point and no subsequent attempt would be made to quantify willingness to pay for or cost alternative standards1. However, for the purposes of this exercise we assumed that customers are, in fact, dissatisfied with current service levels. We consequently examined through various survey questions and focus groups the attributes of interruptions customers were most concerned about. The questionnaire included both the SSI questions contained in Appendix 1, and various other questions concerned with the attributes of water service. (The entire questionnaire appears in Appendix 6 of ARCWIS 2001). The detail of the results is reported in the technical report. For the purposes of this report, however, the following can be stated: •
Attitudes were generally non-crystallised, meaning that strong attitudes were not held
•
Respondents generally could cope with short interruptions, and the components of interruptions that were deemed to be important were: o
Duration of the interruption;
o
If they are notified of the interruptions;
o
Time of day the interruptions happened; and
o •
The number of interruptions per year (both planned and unplanned, although there was a greater tolerance for planned interruptions than unplanned.)
Compensation was generally not expected for planned or unplanned interruptions, with customers more interested in having the problem fixed, than any form of rebate (which they felt they would pay for anyway through increased water bills)
For the purposes of explanation in this report, we will provide an example of the quantified benefits and costs of a change in service standard to reduce the duration of interruptions from 6 hours to 4 hours and the allowable frequency of unplanned interruptions from 2 p.a. to 1 p.a..
1
Note that this finding does not negate the importance of researching willingness to pay for changed standards or a changed mix of attributes. There were sufficiently strongly held views about aspects of service provision that warranted further investigation in order to develop and test the effectiveness of the method. The suggestion that investigations might have stopped at this point applies only to water companies who would clearly make the decision not to proceed on the basis that further investment into willingness to pay or accept compensation is not warranted given the relatively low level of concern by customers. Setting and Evaluating Customer Service Standards – Overarching Report July 2002
CSIRO Urban Water
17
While our choice of demonstration standards is essentially arbitrary it is worthwhile commenting on the means through which actual standard changes might be determined. Given the non-crystallised nature of the attitudes a process that measured the latitude of acceptance scale of the various components of the services was used. This also ensured that valid attitudes and not non-attitudes were measured. The latitude of acceptance approach allowed people to have a ‘grey area’ when indicating preferences. For example, when deciding their preferences for the number of unplanned interruptions in a year, people could state their absolute choices of acceptability and unacceptability. However, the method also provided for uncertainty in that people could offer numbers that they ‘could cope with’. Figure 3, below, illustrates the latitude of acceptance for duration of interruptions
Figure 3 - Example of Latitude of Acceptance: Duration of Interruptions
No. of Respondents
Totally Acceptable
In Between
Totally Unacceptable
220 200 180 160 140 120 100 80 60 40 20 0 1
2
3
4
5
6
7
8
9
10 11 12 24 36 48
Duration of Interruptions (in hrs)
From this result we can see, for example, that as the duration of interruptions increases, the level of dissatisfaction increases. At a duration of 7 hours or greater, the majority of customers are dissatisfied.2. One can also see, however, that at a duration of 5 hours the majority of respondents (56%) would not be dissatisfied. A decision to adopt such a standard might be sensible, assuming the perceived benefits of such a tightening outweighed the costs of achieving it.
2
Note that this example makes no distinction between duration of planned and unplanned interruptions. Survey 2, however, asked respondents to differentiate between duration of planned and unplanned interruptions if it made a difference. Setting and Evaluating Customer Service Standards – Overarching Report July 2002
18
4
EVALUATING BENEFITS – WILLINGNESS TO PAY OR WILLINGNESS TO ACCEPT COMPENSATION
Key attributes that matter to the customers are the duration and frequency of unplanned interruptions. If the SSI had revealed that the issue of interruptions had warranted further investment, one of the things we would need to investigate would be customers’ willingness to pay. This is the benefits side of the cost/benefit framework. There is a number of methodologies for determining consumers’ - for instance, contingent valuation – for determining willingness to pay for a level of service. Many of these have evident flaws and, in the absence of a market, these flaws cannot be fully overcome. However, the technique of Choice Modelling has been chosen as the preferred methodology for this study as it significantly reduces these deficiencies3. Essentially, this Component sought a methodology to provide information enabling regulators and WSAA members to explore the question of whether or not a different configuration of attributes would improve customer satisfaction. Choice modelling uses a survey approach where the respondent is asked to choose A, B or C where each option is a package of good attributes and/or customer service attributes. In choosing among A, B or C, the respondent is being asked to trade-off these attributes. A choice modelling questionnaire was subsequently developed through an iterative process of consultation with industry representatives, a focus group and extensive pre-testing of the instrument and was put to groups of customers in late 2001 The initial design suggested that over 614 usable responses would be required for validity. This meant that we should aim for 768 questionnaires with choice modelling questions stratified as follows: •
Half the respondents should be asked about standards they would expect if in the last 12 months they had experienced a water supply interruption “once before” and half what they would expect if a disruption had “never” happened;
•
Half the questionnaires offered a willingness to pay choice set and half a willingness to accept compensation choice set
•
A sub-sample of the willingness to pay choice set was given a payment scale that was half the scale developed with focus groups to test for the possibility of embedding4.
The approach taken in the choice modelling survey has been to use a Willingness to Pay (WTP) measure to estimate customer valuations of increased standards and a Willingness to Accept Compensation (WTAC) to derive customer valuations of decreases in standards. Effectively, this approach allows for the possibility of what economists refer to as a ‘kinked demand curve’. That is, if customers perceive that the status quo is a quasi-property right, they may seek greater compensation for reductions in standards than they will be willing to pay for a corresponding increase in standards. Figure 4, below, provides a sample of one of the choice modelling questionnaires. As can be seen, respondents are confronted with A, B and C choice sets, which differ in quite subtle ways. By asking customers to select one of these combinations customers are being asked to choose a range of attributes, not just make a single selection. If a sufficiently large number of respondents is questioned
3
A useful description of the choice modelling technique is provided in Bennett, J. and Blamey, R. (2001) The Choice Modelling Approach to Environmental Factors Edward Elgar
4
If a statistical difference is found to exist then embedding may be present. Setting and Evaluating Customer Service Standards – Overarching Report July 2002
CSIRO Urban Water
19
using a range of differing choice sets it is later possible to identify which of the attributes is of most value to customers and relate this to their willingness to pay (or accept compensation) The methodology developed to elicit information on customer willingness to pay/accept compensation is sophisticated and robust. As indicated above, one would only investigate WTP in the event that customers had revealed a desire for further investment in this area following application of the SSI For this report, we are determining willingness to pay for a reduction in duration of an interruption of 6 hours to 4 hours and for a reduction in frequency of interruptions from 2 p.a. to 1 p.a. The results of this analysis show the following: •
Those in the Adelaide sub-set (the only group included in the Choice Modelling questionnaires) were willing to pay $2.35 per annum to achieve the desired improvement in the standard for duration from 6 to 4 hours. Assuming a site of 500,000 properties translates this into a total annual WTP of $1,175,000 p.a. The Net Present Value of such a permanent increase in a water bill is $19,583,333.
•
Customers were willing to pay $2.20 p.a. for an improvement in the frequency standard from 2 p.a. to 1 p.a. This is a total WTP of $1,190,000 p.a. and a Net Present Value of $18,333,333.
In order to test the methodology we needed to choose numbers that people believed or was meaningful to them. There are only a limited number of jurisdictions that specifies allowable numbers of interruptions. One of these is Victoria. It sets the limit for allowable interruptions at 5 p.a. However, only a minute proportion of customers (1.5%) experienced even 4 interruptions (WSAAFacts 2001). In a system operating around the standard of no more than 5 interruptions, some 35% of customers potentially experience one or two interruptions. Thus, the Choice modelling questionnaire asked about respondents’ willingness to pay for a reduction from a standard of 2 interruptions p.a. to 1 p.a. To test for the existence of an embedding (context) effect, 64 respondents who were given willingness to pay questionnaires, had the payment scale associated with their choice sets adjusted down to $0, $30 and $60, as opposed to $0, $40 and $805 for the larger group in this subset (128 respondents)6. If the characteristics (income levels, age, etc) of the sample sets are similar it could be expected that different choices would be made as the payment scale changes. If the same choices are made, an embedding effect is present, as price is not influencing choices. While some oddities arose with the characteristics of the sample set who received the sub-survey, and the sample subset size was small, no embedding effect was observed.
5
It was found in Component 1 that any amount less than $30 was seen only as a ‘donation’ not a meaningful number 6
The total number of WTP Choice Sets distributed was 337 (including the ‘Experienced’ and Inexperienced” subsets). Each respondent faced 6 choice experiments allowing 2022 choices to be observed. Setting and Evaluating Customer Service Standards – Overarching Report July 2002
20
Figure 4 - Example of Choice Modelling Set
Imagine that the water pipes in your area have been breaking unexpectedly – possibly due to expansion of the clay soils after heavy rain. The water supply company is trying to fix the problem and tells you your water supply may be interrupted, without warning, over the next twelve months. Now, imagine it is a weekday, a water pipe breaks and your water has to be shut off immediately. The interruption occurs at 5:30am on a weekday. In the last 12 months, this has happened once before… In this scenario you can only choose one column of options. Please tick one box at the bottom of the table. Column A
Column B
Column C
Current Practice) Without warning your house might be without water from…
5:30 am to 8:30 am
5:30 am to 11:30 am
5:30 am to 2:30 pm
(i.e. 3 hours)
(i.e. 6 hours)
(i.e. 9 hours)
In the last year your water No more times in the No more times in the One more times in supply has been next 12 months next 12 months the next 12 months interrupted one. The water supply company tells you that your water supply might fail… You were advised about A card put in your A card put in your If you listened to a the interruption by… letterbox after the letterbox after the radio station that interruption interruption was notified The alternative water A two litre bottle of to every supply arrangements water offered were… household where someone is home
A two litre bottle of water to every household where someone is home
Water provided at a central location (water tanker in street)
As part of the package No change to your A $50 once-off rebate A $25 once-off your water supply bill… next water bill on your next water bill rebate on your next water bill
□ Column A
□ Column B
□ Column C
□ Don’t know
Setting and Evaluating Customer Service Standards – Overarching Report July 2002
CSIRO Urban Water
5
21
CALCULATING SOCIAL COSTS
The customer preferences survey identified the attributes of water services customers felt were important. The Choice Modelling surveys enabled determination of willingness to pay or willingness to accept compensation. However, quantification of the value of attributes only completes the determination of the benefits of a certain strategy. The third element of the methodology was, therefore, to identify community costs and to do this so that: •
Social costs can be identified and incorporated in cost calculations.
•
A good mix of renewal and replacement strategies can be identified in response to desired standards so that a low cost approach to meeting them can be determined
Detailed analysis was carried out of the social costs that might exist. Suffice to say here, however, that those likely to lead to significant cost impacts are loss of business (say, where strip shops are without water) and traffic disruptions, arising from the need to close lanes or entire roads to effect pipeline repairs or replacements. The methods used to value these social costs are set out below. Before proceeding, however, it should be noted that the term ‘social costs’ has been chosen as a catchall to include externalities and customer impacts, and is used in this way from this point forward.
5.1
Business Loss
The impacts on strip shopping businesses arising from water supply interruption vary according to the business. The severity of these effects was determined by a survey of differing business type proprietors in Perth and the results are incorporated in Figure 5. Operations such as newsagents, real estate agents and the like may suffer little or no loss of business, as they are not reliant on water supply for other than toilets or hand-basins. Other businesses, such as childcare centres and restaurants, are dependent upon a water supply and would be forced to close if water supply were interrupted for more than a very short period. To calculate business loss a simple rule based approach was adopted. In this approach categories of impact were identified and standard valuation procedures applied. Figure 5 provides a sample of the categories of impact adopted based on analysis of actual suburban retail shopping areas, excluding major shopping malls.
Figure 5 - Categories of Impact on Business Customers Impact
Effect on net business income in first 2 hours
Effect on net business income for next 2 hours
Examples
Negligible Impact


![Customer Service Customer Service Customer Service - ChangeThis [PDF]](https://m.moam.info/img/260x300/customer-service-customer-service-customer-service_647dc68d098a9e3a168b461f.jpg)