For further information, visit www.collegeboard.com. Additional copies of this report .... question arises: What is the best method to use to set cut scores? No one ... For instance, a college with a placement system that covers multiple content ...
Research Report No. 2005-9
Setting Cut Scores for College Placement
Deanna L. Morgan and Michalis P. Michaelides
www.collegeboard.com
College Board Research Report No. 2005-9
Setting Cut Scores for College Placement
Deanna L. Morgan and Michalis P. Michaelides
The College Board, New York, 2005
Acknowledgments The authors would like to thank Steve Sireci and Jennifer Kobrin for their valuable input on earlier drafts of this paper.
Deanna L. Morgan is an associate research scientist at the College Board. Michalis P. Michaelides is an associate psychometrician at the College Board. Researchers are encouraged to freely express their professional judgment. Therefore, points of view or opinions stated in College Board Reports do not necessarily represent official College Board position or policy. The College Board: Connecting Students to College Success The College Board is a not-for-profit membership association whose mission is to connect students to college success and opportunity. Founded in 1900, the association is composed of more than 5,000 schools, colleges, universities, and other educational organizations. Each year, the College Board serves seven million students and their parents, 23,000 high schools, and 3,500 colleges through major programs and services in college admissions, guidance, assessment, financial aid, enrollment, and teaching and learning. Among its best-known programs are the SAT®, the PSAT/NMSQT®, and the Advanced Placement Program® (AP®). The College Board is committed to the principles of excellence and equity, and that commitment is embodied in all of its programs, services, activities, and concerns. For further information, visit www.collegeboard.com. Additional copies of this report (item #050481692) may be obtained from College Board Publications, Box 886, New York, NY 10101-0886, 800 323-7155. The price is $15. Please include $4 for postage and handling. © 2005 The College Board. All rights reserved, College Board, Advanced Placement Program, AP, SAT, and the acorn logo are registered trademarks of the College Board. connect to college success is a trademark owned by the College Board. PSAT/NMSQT is a registered trademark of the College Board and National Merit Scholarship Corporation. All other products and services may be trademarks of their respective owners. Visit the College Board on the Web: www.collegeboard.com. Printed in the United States of America.
Contents
Conclusion. . . . . . . . . . . . . . . . . . . . . . . . . . . . . . . . . .11 References . . . . . . . . . . . . . . . . . . . . . . . . . . . . . . . . . .11
Introduction . . . . . . . . . . . . . . . . . . . . . . . . . . . . . . . . . 1 Common Steps in a Standard-Setting Study . . . . . . . 2 Identify the Purpose and Goals of the Cut-Score Study . . . . . . . . . . . . . . . . . . . . . . 2 Choosing a Cut-Score Method . . . . . . . . . . . . . . . . 3 Choosing a Standard-Setting Panel . . . . . . . . . . . . 3 Writing Performance-Level Descriptors. . . . . . . . . 4 Training Panelists on the Method . . . . . . . . . . . . . 5 Training the Panelists on the Content . . . . . . . . . . 5 Compiling Ratings from Panelists . . . . . . . . . . . . . 5 Conducting Panel Discussions . . . . . . . . . . . . . . . . 5 Considering the Consequences or Impact . . . . . . . 6 Evaluating the Process and Standards . . . . . . . . . . 7 Documenting the Process . . . . . . . . . . . . . . . . . . . . 7 College Administrators Make the Final Decision . . . . . . . . . . . . . . . . . . . . . . . 7 An Overview of Traditional Cut-Score Methods . . . . 7 Modified Angoff. . . . . . . . . . . . . . . . . . . . . . . . . . . . 8 Body of Work . . . . . . . . . . . . . . . . . . . . . . . . . . . . . . 8 Bookmark. . . . . . . . . . . . . . . . . . . . . . . . . . . . . . . . . 8 Borderline Group. . . . . . . . . . . . . . . . . . . . . . . . . . . 9 Contrasting Groups . . . . . . . . . . . . . . . . . . . . . . . . . 9 Overview of an Empirical Cut-Score Method Using External Criteria. . . . . . . . . . . . . . . . . . . . . . 9 Logistic Regression Prediction . . . . . . . . . . . . . . .10 Monitoring How Well Cut Scores Function . . . . . . .11
Tables
1. Example of Proportion of Success . . . . . . . . . . . 10 2. Example of Intercept and Slope Values Using Logistic Regression . . . . . . . . . . . . . . . . . . 10
Figures
1. Diagram of a typical use of cut scores for college placement . . . . . . . . . . . . . . . . . . . . . . . . . . 3 2. Graphs of predicted probability of success at each score point . . . . . . . . . . . . . . . . . 10
Introduction The college admissions process can be daunting for both prospective students and college administrators. However, the process does not end when the acceptance/rejection letters are mailed. For many college administrators addressing the preparation for entering students can be just as challenging. Despite having all passed the hurdle of being accepted, the students entering colleges each year can be very diverse both in terms of their cultural heritage and life experiences and in terms of their level of preparedness for college-level work. In 2001, a study by the United States Department of Education found that approximately half of first-year college students were in remedial classes (United States Department of Education, 2001). Course placement decisions for students entering college can have a significant impact on a student’s eventual academic preparation and the time a student will spend in college before completing a degree. Students who are able to begin their studies in more advanced-level courses, due to testing out of entry-level courses or otherwise demonstrating proficiency in the course content, are able to take advantage of more advanced courses in that subject area or to enroll in courses in other subject areas of interest. This opportunity not only allows students to reach more advanced subject matter as undergraduates but may also result in their ability to complete degree requirements early, possibly resulting in tuition savings. In contrast, students who are unable to show proficiency on college placement exams in a particular subject area may be required to complete remedial course work until sufficient proficiency is gained for access to the entrylevel subject area course. Depending on the extent of the deficiency, the remediated student may be unable to reach more advanced course work during his or her time in college and/or may be enrolled in the college for an extended period of time before completing a degree. This has the significant consequence of delaying degree completion and subsequent entry into the workforce, and of increasing tuition costs. Due to the high stakes that may be attached to placement decisions, it is imperative that the placement process be as solid and defensible as possible. An integral part of the placement process is the identification and use of cut scores, the point(s) on the score scale that classify students into adjacent categories for placement decisions. This paper is geared toward helping college administrators make valid decisions regarding setting cut scores, focusing particularly on selecting a method, but also discussing issues such as defining performance levels and validating the process. Before going forward, it is important to distinguish between two types of standards: content standards and
performance standards. Content standards refer to the curriculum that students must know and be able to do. What skills and knowledge should students be able to demonstrate? In terms of college placement this may be thought of as what skills or knowledge are considered a requirement or a prerequisite for entry into a specific course. Performance standards quantify the content standards by defining how much of the content standards students must know and be able to do to achieve a particular level of competency. For example, how much of the content standards must a student know and be able to do to be considered just sufficiently knowledgeable for an entry-level course? For an advanced or subsequent course? Standard setting is the process of determining the placement of a cut score. Once the need to establish a performance standard, or set cut scores, has been established, the following question arises: What is the best method to use to set cut scores? No one standard-setting method is agreed upon as the best. Because it is possible that different standardsetting methods may result in different recommended cut scores, it is essential that careful thought go into the decision of which standard-setting method to use. Part of this thought process should include consideration of the arguments defending the validity of the standardsetting method for the purpose for which the resulting cut scores will be used. Additional thought should be given to the type of evidence or documentation that should be collected and maintained during the process of setting cut scores. Assessments may be composed of a variety of item types; however, for our purposes, we will classify all item types into two broad categories: those scored dichotomously (i.e., multiple-choice, true-false, and other items with clear right or wrong responses), and those scored polytomously (i.e., essays, performance tasks, open-ended items or some short-response items where it is possible to receive partial credit for a correct but incomplete response). A variety of standard-setting methods have been developed. However, many of the methods work best with a particular item type, and thus matching the test format to an appropriate method should help determine which standard-setting method will be used or, at the very least, which methods will not be used. For example, the Modified Angoff method (Angoff, 1971) has a long history of use in setting cut scores for tests with primarily multiple-choice or dichotomous items. Hambleton and Plake (1995) provided extensions to the Modified Angoff method for its application to performance-based tasks. The Body of Work method (Kahl, Crockett, DePascale, and Rindfleisch, 1994, 1995; Kingston, Kahl, Sweeney, and Bay, 2001) is a more recent method for setting cut scores but is designed for assessments with more open-ended tasks and fewer dichotomous items.
1
Placement decisions may consider tests that cover multiple content categories (i.e., using a combination of scores from separate reading comprehension, essay, and sentence skills tests for placement into English courses). Would it be acceptable for students to be considered just sufficiently knowledgeable when they have excelled in a particular content area without showing mastery on the other content area(s)? In such instances it may be advantageous and, in fact, necessary for the complete test or the total student performance to be considered as a whole rather than as one item or content area at a time. Due to the differences in how scores are assigned and the multiple situations in which one may need to set cut scores, different methods for setting cut scores may be more appropriate than others. It is important to remember that the choice of method for setting cut scores has both psychometric and policy implications. Additional factors for consideration in the choice of methods for setting cut scores may include the need to be consistent with the methods used previously for the same or similar placement decisions at the college. For instance, a college with a placement system that covers multiple content areas may have many different cut scores, which are all part of the larger placement process. The college may find it desirable to be consistent across placement decisions and use the same method for setting cut scores across all content areas. When new cut scores are set or when it becomes necessary to revisit existing cut scores due to changes to the course sequence or student population, there may be a preference to continue with the method of setting cut scores used previously in the placement process. In other cases, circumstances logically lead to the use of different methods of setting cut scores for different placement decisions. In many circumstances the amount of prior use, research, and the precedent for defense in court when challenged may be the most influential factors in choosing a method for setting cut scores.
Common Steps in a Standard-Setting Study While each standard-setting method has its own set of unique steps or features, in general 12 steps exist in the typical process for setting cut scores. The 12 general steps are listed below and then more fully discussed in the proceeding text: 1. Identify the purpose and goals of the cut-score study. 2. Choose an appropriate method for setting cut scores. 3. Choose a panel of subject-matter experts and stakeholders to participate.
2
4. Write performance-level descriptors (PLD). 5. Train the panelists on the selected cut-score method. 6. Train the panelists on the content standards and assessment(s) to which the cut score will be applied. 7. Compile item ratings or holistic judgments from the panelists that can be used to calculate cut score(s). 8. Conduct panel discussions regarding the judgments and resulting cut score(s). 9. Present consequences or impact data to the panel (optional). 10. Conduct a panelist evaluation of the process and their level of confidence in the resulting cut score(s). 11. Compile technical documentation to support the validity of the process for setting cut score(s). Make recommendations to college administrators. 12. College administrators make the final decision. Documenting the process for validity purposes starts with the very first step. Not only is it important to keep a record of the content standards, PLDs, rosters of committee members, and data recording sheets, it is necessary to document all decisions as well. These decisions include determining the number of cut scores, selecting a method, choosing the panel, writing the PLDs, training the panelists, determining the feedback given, and calculating the cut scores. These steps should be documented first in a plan of action, and then again in a final technical report. It should be noted that an integral part of the validity for any cut-score process is ensuring that the testing instrument is appropriate for the student population and the intended purpose of course placement.
Identify the Purpose and Goals of the Cut-Score Study All cut-score studies begin by identifying how many cut scores will be set and how the resulting cut scores will be used. Figure 1 displays an example of a hypothetical score scale with two cut scores to demonstrate a possible use of cut scores for college course placement. The college administrators should identify personnel to lead the cut-score study. The selected personnel should be clear on the placement rule (which test[s] and how many tests are to be used in the placement decision) and the stakes attached to the test before selecting a method to set cut scores. Also, the selected personnel need to learn any historical information about previous cut-score studies or political concerns about the cut scores. It is strongly recommended that the person responsible for leading the cut-score studies have prior experience and training in setting cut scores. A very important distinction to make is the
�������������� ����������������
0
28
���������������� ����������������������
�������������� �����������
29
�������������� �����������
76 ������������������������� ��������������
77
100
������������������������� ��������������
Figure 1. Diagram of a typical use of cut scores for college placement.
difference in leading the cut-score study and actually setting the cut scores. The leader or facilitator of the cut-score study does not set cut scores. The leader is responsible for ensuring that proper processes are in place and followed during the cut-score study, training the panelists on the method to be used, documenting the process and any decisions made, and advising the policy body on the psychometric issues involved in the cut-score study and decisions (Geisinger, 1991; Mehrens, 1986). The leader has no vote on the placement of the cut scores and may not say or do anything during the cut-score study that would influence the judgments of the panelists.
Choosing a Cut-Score Method The number of cut-score methods increases each year. To completely document and review each method ever used would be an enormous task and outside the scope of this paper. As previously covered in this document, many considerations go into the decision of which cut-score method is the best for a specific placement decision and population. A common classification of cut-score methods distinguishes methods as either test centered or examinee centered. Test-centered methods are those in which the panelists focus solely on the test content and/or item-level information, while examinee-centered methods require that panelists examine the student’s performance more holistically (see, for example, Jaeger, 1989; and Hansche, 1998). However, in this paper the distinction is made between traditional cut-score methods and empirical methods that use external criteria for validation of the cut scores. Traditional cut-score studies use panels of subjectmatter experts to completely review assessment materials on an item level and determine the amount of content knowledge of which a student must show mastery in order to be considered just sufficiently knowledgeable for placement into a specified course. During the traditional cut-score study, the focus is almost completely on the identification of the point where a student has shown sufficient content mastery. Empirical data on the performance of students on each item or on the test as a whole may be used to validate cut-score decisions, but the data typically play a relatively small part in the ultimate
recommendation of the panel for the placement of the cut score(s). This approach ensures that a certain level of content knowledge has been reached by the student rather than aiming at a particular passing rate. Empirical cut-score studies, sometimes referred to as validity studies, use data collected on actual student performance in courses as external criteria to determine the placement of the cut score(s). At the end of the specified course, students in the courses of interest are administered the assessment(s) to be used for placement decisions. The students’ performances both in class, as indicated by their final grades, and on the assessment(s) are used in conjunction to determine where the cut score(s) should be placed to indicate that a student has reached a level of mastery of the subject matter comparable to the students who actually enrolled in and completed the course. This approach is typically less time-consuming and often requires fewer resources than the traditional cut-score study. However, the definition of success in the class and any resultant cut scores based on this definition are subject to the grading practices of the college faculty, which may vary greatly both within and among colleges. It is good practice to set initial cut scores through a traditional cut-score study and then collect data to validate and/or revise existing cut scores on a regular basis. More specific details of different methods for setting cut scores are discussed in later sections of this document.
Choosing a Standard-Setting Panel When choosing a standard-setting panel, the number of panelists is very important. For a traditional cutscore study, it is ideal to have between 20 and 30 panelists who are representative of the population to which the standards will be applied. Empirical cutscore studies require fewer panelists but should still take representation of the population into account. Often for an empirical cut-score study, 5–10 panelists are sufficient. However, the number of panelists and representation should reflect the breadth of the area for which the cut score(s) will be applied. For instance, a small college with only 2–3 professors who teach in a particular subject area may be well represented by the inclusion of most, if not all, of the professors and 2–3 members of the college administration when the cut score(s) are intended only to apply to students at that college. However, in the case of cut scores to be applied to larger colleges or to state- or university-wide systems encompassing multiple campuses and locations, a much larger panel will be needed to achieve representation; at a minimum the panel should have a faculty representative from each or a majority of the campuses or locations. Panelist representation should be considered in terms of gender, race/ethnicity, geographic location (if the 3
cut score[s] are to be applied beyond a single college, e.g., to a statewide university system), knowledge of and time spent in relation to the subject area and target population, and area of specialization. For college placement, geographic location is typically relevant only in situations where the cut score(s) will be applied beyond a single institution. When cut scores are intended for use by multiple institutions, panelist selection should include both the location within the geographic area as a whole (e.g., North, South, East, West, Central), and the degree to which rural and urban areas are represented, or other geographic factors relevant to the college population. Content area experts (primarily educators who are familiar with the target student population) should comprise the majority of the panel and represent those with many years of service as well as those new to the field, in addition to representatives from both twoyear and four-year colleges, if the cut score(s) are to be applied beyond a single institution. Area of specialization reflects the need to have representatives who are familiar with and can represent students with disabilities, gifted and talented students, and/or nonnative speakers of English. Having representatives present who can speak to these areas of specialization increases the likelihood that the cut score(s) will be relevant for all populations and increases the validity of the cut score(s) for use with these groups. This could play an important role in the defensibility of the cut score(s) in the event that a legal challenge is made.
Writing Performance-Level Descriptors An initial step to setting cut scores is the creation of PLDs or working definitions of each of the performance levels. The PLDs define the rigor associated with the performance levels. That is, they describe the meaning behind words like “basic,” “proficient,” and “advanced” or clearly delineate the difference in expectations for students in a remedial course, an entry-level course, or an advanced course in the subject area. Panelists bring with them their personal experiences and their own points of view. These differences are the value that representative panels bring to the process of setting cut scores. These same differences can also be sources of variation in the results of the process. For instance, we know from the K–12 arena that the definition of “proficient” differs from one state to another (Beck, 2003), and the word can be interpreted differently by different individuals, even within one state. The same holds true for institutes of higher education. What is expected of students in an entry-level mathematics course at one college may be quite different from the expectations of students in an entry-level mathematics course at another college or at times even among 4
instructors at the same college. It is for this reason that such importance is given to the selection of the panelists for the cut-score study. Many panelists have reported that when they are thinking of what it means to classify a student into categories of proficient and advanced or into categories delineated by course level, they will often picture a student from their class whom they feel would be classified into that performance category. This can be extremely useful in helping the panelists fully conceptualize the task of setting cut scores. However, it would not be realistic to expect that all panelists come into the cut-score session with the same student in mind for meeting the requirements to be placed into a particular course. Therefore, it is necessary to calibrate the panelists through discussions of the content standards and the degree to which the standards must be mastered for a student to be classified into each performance level. The creation or refinement of PLDs facilitates the calibration of panelists by providing each panelist with the same working definition for each performance level. The PLDs may be created during the process of setting cut scores using the content standards, course prerequisites/requirements, and panelists’ discussion to create the final PLDs. The creation of PLDs can be a very time-consuming enterprise and can add up to a full day to the process of setting cut scores. To reduce requirements for panelist time, an alternative is to convene a panel of experts expressly for the purpose of creating the PLDs prior to the cut-score session. Then, during the process of setting cut scores, panelists are given the prepared PLDs and provided an opportunity to discuss, edit, and refine them. The process of setting cut scores should not proceed until the PLDs are to the point that the panel feels comfortable that they reflect what students at each performance level should know and be able to do. It is essential for all cut-score methods that the individual members of the panel have the same understanding of the performance levels, and that they are specifically focusing on the definitions at the borderline level or the “just sufficiently knowledgeable” student. That is, they know what it means to be just barely proficient enough for the entry-level course or just barely advanced enough for a non-entry-level or subsequent course. Regardless of the process used to produce the final working definition, the PLDs should: • Describe what students at each level should reasonably know and be able to do. • Relate directly to the content standards, course prerequisites, and course requirements. • Distinguish clearly from one level (remedial course) to the next (entry-level course). • Be written in positive terms.
• Be written in clear and concise language without using nonmeasurable qualifiers such as often, seldom, thorough, frequently, limited, etc. • Focus on achievement. For additional information on writing PLDs and to see examples of PLDs that have been used in standard-setting studies, see Hambleton (2001) or Hansche (1998).
Training Panelists on the Method Training panelists is an important component to any cut-score process. Training should include instruction on the method and an overview of the process for setting cut scores, as well as a review of the purpose of the cut-score study and of the content standards and/or prerequisites/requirements of the course on which cut scores are being set. It is important for panelists to fully understand the process in which they are participating and the consequences that may result from any cut-score recommendation produced by the panel. Well-trained panelists should be confident in both the process they used during the cut-score session and their cut-score recommendations. A key component of training includes an opportunity for the panelists to practice using the method, to ask questions, and to provide feedback on their understanding of the purpose of the session and the method being used prior to working on the operational cut-score placements. This practice step is essential to establish the validity of the process and therefore, the resultant cut score.
Training the Panelists on the Content Taking the test prior to providing cut-score recommendations provides the panelists with the opportunity to become familiar with the test content and structure. During the actual process of setting cut scores, panelists are provided with answer keys and typically a mapping of each item to the content standard or course objectives it is intended to measure. With the standards and answer keys in hand, an assessment can appear much easier than when panelists are faced with only the items and must provide the correct answers themselves. In addition, after taking the test, panelists must be given an opportunity to discuss the items, understanding the scoring rubrics, and map the items to the content standards or course objectives in a way that is meaningful to them. An introduction to item difficulty and the features of an item that would make it more or less difficult is also part of this training.
Compiling Ratings from Panelists A common feature of all cut-score sessions, regardless of method, is the need to collect data from each panelist regarding their recommendations for the placement of the cut score. The judgments provided by the panelists may appear in different formats, such as a probability for each item (for Modified Angoff), or one number per cut score (for Bookmark), but all judgments ultimately lead to a performance standard defined by a certain score on the test. Panelist judgments are typically collected three times during the standard-setting process, with panelist discussions occurring between each of the three rounds of judgments (Hambleton, 2001). Following each data collection, the results are analyzed to find the current cut-score recommendations, in addition to the minimum and maximum recommendation for each round of judgments. The cut-score recommendation after each round of judgments may be calculated in a variety of ways depending upon the method used. The cut score is typically determined through some measure of central tendency of the panelist judgments. Because extreme scores may unduly influence a mean (average), the median may be used instead. An additional way to control the influence of extreme scores is to routinely eliminate the highest and lowest recommendation before calculating a mean. The decision about how to handle extreme scores should be made prior to the cut-score study and not in reaction to the panelist judgments. Other methods of analyzing panelists’ data may include finding the midpoint of a logistic regression curve, as in the Body of Work method; fitting a line through the data; or using item-response theory to calculate the optimal cut-score placement.
Conducting Panel Discussions Panelist discussion may occur in small or large groups. Certain methods recommend the type of discussion as part of the standardized process. Large-group discussion is valuable in that it allows all panelists to hear all discussion, bringing all viewpoints into play and ensuring that all panelists are hearing the same information. However, large-group discussion may sometimes result in more reticent panelists being hesitant to share their opinions. Large-group discussion is also subject to being controlled by overly aggressive or opinionated panelists, which may add to the hesitancy of other panelists to speak up (for a review of influences of social interactions in group decisions, see Fitzpatrick, 1989). The leader of the cut-score study should make every effort to create an atmosphere that is friendly and respectful of differing opinions. Small-group discussion can encourage all panelists to express their opinions in a smaller forum and can help
5
limit the influence of controlling panel members to the small group in which they are working. A drawback to the use of small discussion groups is that the small groups are not privy to the discussion of other panelist groups and will be making recommendations based on information that may differ. For this reason, it is important that at some point, typically after round two, the small groups come back together as a large group and share the discussions that took place in their groups. When working in a small-group setting, it is useful for the leader of the cut-score study to provide feedback to the individual groups, rather than to the room as a whole, until it is time for the large-group discussion. Then, small-group cut scores as well as large-group cut scores can be shared. Coming back into the large group before the last round of recommendations permits the small groups to compare their judgments and reasoning to that of the other small groups. Prior to the first round of cut-score recommendations, panelist discussion is typically limited to the discussion of content standards/course objectives and the PLDs. Every attempt is made prior to round one to discourage the discussion of where the cut scores should be placed. This enables panelists to provide initial recommendations that are as independent as possible. Discussion following round one should focus on the round-one cut-score recommendation and panelists’ explanations and reasoning for their judgments. It is important that panelists feel free to offer their opinions and that any explanations are accepted as an integral part of the process. Panelists’ discussions allow a variety of opinions and thoughts to be voiced and help the group focus on the content standards/course objectives and students across the college or target area, rather than focusing specifically on the needs of the students in their specific school or area. This is especially important for cut scores that will be used at multiple institutions. It is important that panelists realize the cut scores will generalize to all students and not just those with whom they have personal knowledge. All cut-score judgments should be made independently but with consideration of the preceding discussion. Following round two, panelists have the opportunity for further discussion based on the round-two cut-score recommendations and any additional information that may be provided. After this second discussion, which usually involves the large group, panelists will make cut-score recommendations a third time, which is typically the last opportunity for adjustments to their cut-score recommendations. Multiple rounds of judgment are an important part of the cut-score process. The first round should be made as independently as possible by each panelist. This first judgment typically grounds the judgments for that panelist in such a way that while the panelist may alter his or her judgment by moving it to a higher or lower position, it is unusual that judgments in subsequent rounds are 6
substantially different from the initial rating. However, it is very common for panelists to adjust their initial judgments in subsequent rounds at least minimally due to the introduction of discussion and different perspectives that they may not have considered in the initial round of judgments. Multiple rounds of judgments typically result in more valid cut-score recommendations (Busch and Jaeger, 1990; Jaeger, 1982, 1989; Linn, 1978; Shepard, 1980).
Considering the Consequences or Impact It is typical to provide panelists with impact data or some indication of the consequences that would result from the current cut-score recommendation. This may occur at different points in the process, but typically occurs following round two. Opinions vary as to what type of impact or consequence data should be provided to panelists, if any. This is a policy decision and should be made with input from and the agreement of the authoritative body. Impact data usually consists of overall information on the percentage of students who would be expected to perform within each performance level given the current cut-score recommendations. The consideration of consequences or impact data is controversial because it may influence the cut-score decision by introducing information with potentially sensitive political ramifications that could unintentionally alter panelists’ judgments. For this reason, this step may be omitted. Sometimes it is desirable to provide more detailed information and give not only the percentage in each performance level or course level for the total population, but also the percentages in each performance level for specific subgroups of interest; e.g., by ethnicity, gender, disability status, etc. Thus, panelists would be told not only what percentage of entering students would be placed in the entry-level course, for example, but also what percentage of African American students, Hispanic students, economically disadvantaged students, English as a Second Language students, and students with disabilities. Along with the policy decision of whether to show impact data and how much to show, the authoritative body may indicate a desire for the level of consideration they want panelists to give to the impact data. That is, the leader of the cut-score study may be instructed to encourage panelists to give the impact numbers minimal weight or to give them strong consideration in their next round of judgments. Typically the impact data are considered to be just another piece of information, which just strengthens the belief of the panelists that they have made wise recommendations to that point. The content standards/ course objectives and what students should know and be able to do should have the most influential effect on the resultant cut-score recommendations.
Evaluating the Process and Standards The evaluation of the cut-score process and resultant performance standards should be designed into the cut-score study. Evaluations should occur frequently at different stages of the process and ask panelists to give an indication of their level of understanding and confidence in the process, as well as to provide feedback on the type of information they found useful in their decision making. Evaluations serve two purposes: (1) to provide feedback on the clarity of the training and the level of the panelists’ understanding and (2) to determine the panelists’ level of satisfaction with the process and final cut score, which is an important piece of evidence for establishing the validity of performance standards (Hambleton, 2001). Initial feedback should be given following the training session and reviewed prior to the next stage in the process so that any misunderstanding or confusion can be addressed prior to the panelists making any operational cut-score recommendations. The frequency with which the evaluations occur can vary. At a minimum, evaluations should occur following training and at the end of the cut-score session. It is recommended that evaluations also occur after the first round of cut-score recommendations, and sometimes it may be desirable to evaluate panelists’ understanding following each round of cut-score recommendations, especially in high-stakes situations. Then, a final evaluation should be given at the end of the process to document panelists’ comfort level with the outcome (Hambleton, Jaeger, Plake, and Mills, 2000).
Documenting the Process Throughout the cut-score process, consideration should be given to the type of documentation that should be maintained. In the event that the cut-score recommendations are ever challenged, the cut-score study documentation is the evidence of what occurred and of what the panelists recommended. Documentation includes the plan for the cut-score study; any scripts used; the materials given to panelists; any slide show presentation given; panelists’ ratings; panelists’ evaluations of the process and the resultant cut scores; the impact data that was presented to the panelists; and data used to create any other materials used in the cut-score session, such as score distributions and any item-difficulty estimates that may have been used for item ordering. The documentation provides evidence to support the validity of the cut scores. Kane (1994) provides two guidelines for examining the validity of performance standards: 1) that the cut score corresponds to the specified performance standard and 2) that the
specified performance standard is reasonable given the purpose of the decision. It is also standard procedure to create a technical report following the cut-score session that describes the procedures and summarizes panelists’ ratings and evaluations, as well as a summary of panelists’ comments provided on the evaluation forms. The technical report should summarize the impact data, provide the standard errors of judgment (SEJs) for each cut score and the standard error of measurement (SEMs) for the test. It is good practice to provide the final cut-score recommendations along with values representing +/-2 SEJs and +/-2 SEMs. Along with the resultant cuts, it is helpful to provide estimates of the percentages of students in each performance category based on the cut scores +/-2 SEJs and +/-2 SEMs for the total population and possibly for any subgroups of interest.
College Administrators Make the Final Decision The involvement of so many people (e.g., panelists, facilitator, authoritative body) in the cut-score study may result in confusion as to who actually set the cut score(s). The responsibility for the final cut score(s) that are implemented belongs to the college administrators or other policy-making body with the authority to implement the placement rules at the institution. The facilitator guides the panelists and authoritative body through the process of setting cut scores and ensures that proper documentation is kept and acceptable procedures are followed. The panelists provide subjectmatter expertise and knowledge of the target population and use this information to make recommendations for the placement of the cut score(s). However, it is the authoritative body who has the final say as to whether the cut-score recommendations are adopted directly from the panelist recommendations or whether a modified version of the recommendations is adopted.
An Overview of Traditional Cut-Score Methods This section summarizes a selection of traditional cut-score methods. The plethora of cut-score methods in existence prevents comprehensive coverage in this document. Five common methods are summarized in this paper: Modified Angoff, Body of Work, Bookmark, Borderline Group, and Contrasting Groups. For a more complete description of these as well as other standard7
setting methods, refer to Cizek (2001), Cizek, Bunch, and Koons (2004), and Hansche (1998).
Modified Angoff In Modified Angoff (Angoff, 1971; Livingston and Zieky, 1982), panelists are asked to picture a hypothetical borderline examinee (e.g., an examinee on the borderline between two adjacent performance levels) and indicate the probability (between 0.00 and 1.00) that he or she will correctly answer each test item. Another way to consider this task is to picture 100 borderline students and determine how many of them would answer the item correctly. These probabilities are summed for each panelist to determine each individual panelist’s cut score. Then, the individual cut scores are averaged across all panelists to obtain the recommended cut score. The panelist must make one judgment for each item and one judgment for each cut score. Thus, if a test has 100 items and performance is divided into three levels (e.g., Remedial Course, Entry-Level Course, and Advanced Course), the panelist must make 200 judgments, one for each item and for each cut score. This method works well for tests with dichotomously scored items, and has been used in assessments that are primarily multiple-choice but also include some openended items. There are several methods for dealing with polytomous items. The most common method is the Mean Estimation method, which has been used in the National Assessment of Educational Progress Improvement Act (Public Law 100-297, 1988). It asks panelists to determine the mean score that 100 borderline students would receive on this item. So, for a 4-point item, a panelist might decide that an average score for a borderline proficient student would be 2.5, while a borderline advanced student might receive a 3.25. Another method is to ask panelists to determine the percentage of borderline students who would receive 1 point, 2 points, 3 points, and then 4 points. Like all methods, Modified Angoff includes multiple rounds of panelist ratings accompanied by panelist discussion between rounds. This method has been well researched and has a long precedence. Another advantage is that it does not require student data (other than impact data) be present, which makes it less vulnerable to time constrictions. A criticism is that it may be difficult for judges to accurately assign probabilities across the range from 0.00 to 1.00. This may result in only a few probability values being used, and depending on discrepancies between panelists, a lack of internal consistency. Another potential drawback is that panelists may lose sight of the students’ overall performance on the assessment due to the focus on individual items.
8
Body of Work In the Body of Work method (Kahl, Crockett, DePascale, and Rindf leisch, 1994, 1995; Kingston, Kahl, Sweeney, and Bay, 2001), panelists examine complete sets of student work, including responses to both dichotomously and polytomously scored items. Panelists review each student booklet and sort it into a performance category based upon its match to the PLDs. A small sample of student booklets across the range of possible scores is used as a range-finding activity to narrow down the approximate locations for where the cut scores should be placed. Discussion follows the range-finding round and panelists have the opportunity to revisit their range-finding decisions. It is important that panelists agree on the range under consideration for the placement of the cut score before the next phase—pinpointing—begins. Using the defined range, sample student booklets are chosen to represent every score point between the lowest possible score in the range and the highest possible score in the range. Although several approaches may be used to select the next round of papers, most users are using the approach that encompasses the whole range of panelist judgments and produces an equal number of papers to judge at each score point. Approximately four samples are chosen for each score point in the middle of the range, with the number of samples chosen decreasing at the end of the range to two samples per score point. Panelists are then asked to work on one cut score at a time and sort booklets into one of the two performance categories surrounding the cut score. The test scores where a student is equally likely to belong to either group as determined by logistic regression are used to identify the final cut-score placements. An advantage of the Body of Work method is the relatively simple task of assigning student booklets to performance groups and the fact that panelists are working with real student responses. A criticism is the amount of preparation time and the need for large quantities of student work available from which to pull the pinpointing round examples at every score point under consideration. However, this is a solid method for tests that are primarily performance based.
Bookmark In the Bookmark method (Lewis, Mitzel, and Green, 1996; Mitzel, Lewis, Patz, and Green, 2001), test items are ordered from easiest to most difficult based on ItemResponse Theory (IRT) b-values, difficulty parameters, or some other index of item location. Panelists are asked to consider items in the order of difficulty and identify the place in the ordered item booklet where the borderline student at each performance category would have a specific response probability (RP), traditionally
two-thirds (RP67), of getting the item correct. Panelists are instructed to place a bookmark into the ordered item booklet at the identified spot to mark their recommended placement for the cut score. After three rounds of bookmark placement with discussion between each round, final-round panelists’ bookmark placements are compiled and the median is selected for the cut-score recommendation. This cut-score recommendation is then located on the IRT ability metric to find the place where students have a two-thirds (or other probability being used) chance of answering the identified item correctly and this becomes the final cut-score recommendation. Thus the RP adjustment is used both in the instructions given to panelists and in scaling the items. Recent modifications to the Bookmark method include using small discussion groups between the rounds to diminish the influence of one strong panelist and asking panelists to work as a group to determine what each item measures and what makes it difficult prior to setting the first bookmark. An advantage of the Bookmark method is the ability to set multiple cut scores simultaneously. The method is also very efficient in terms of time needed and seems to be easily understood by panelists. This method works well with both dichotomously and polytomously scored items. A criticism is the use of the RP67 value, which is arbitrary and can be confusing to panelists and authoritative bodies who think the panelists’ bookmark placements (i.e., number of items preceding the bookmark) are directly translated as the recommended cut score (i.e., as a number-correct cut score). The Bookmark method is one of the most widely used cut-score methods in recent years.
Borderline Group The Borderline Group method (Livingston and Zieky, 1982; Zieky and Livingston, 1977) relies on the identification of a group of examinees as “borderline.” Judges categorize examinees with whom they are familiar as adequate, inadequate, or borderline. This categorization is based on their evaluations of the examinees’ proficiencies and their understanding of borderline performance on the skills being assessed, but without any consideration of the examinees’ actual performance on the test. When the borderline examinees are selected, the median of their scores on the assessment is defined as the cut score. It is a very simple method to use and explain, although it may be difficult to identify students who are truly “borderline” (Jaeger, 1989; Livingston and Zieky, 1982). The judges make decisions about their own students regarding the students’ proficiency in the domain being assessed. Group membership decisions should be made based on performance information and free of irrelevant information that may consciously or unconsciously influence the judges’ opinions, such as attendance or
personality. This unbiased categorization may be difficult to accomplish and is one of the criticisms of this method.
Contrasting Groups In the Contrasting Groups method (Bingham, 1937; Livingston and Zeiky, 1982; Nedelsky, 1954), instructors who are familiar with the students taking the test study the PLDs and then categorize each of their students into one of the performance levels. Tests administered to the groups are scored, and score distributions are produced. The score distributions for each group (e.g., those students classified as Entry-Level Course and those classified as Advanced-Level Course) are plotted and the cut score is identified as the point at which the two distribution curves intersect (Cizek, 2001). An alternative is to select as a passing score the score that results in the fewest false positive and false negative classifications (Sireci, Robin, and Patelis, 1999). Webb and Miller (1995) used a variation of the Contrasting Groups method where panelists reviewed papers written in response to constructed response items and sorted the existing papers, rather than students, into categories. An advantage of this method is the ability to accommodate both dichotomously scored and polytomously scored items. An additional advantage is the ability to collect the data prior to the administration of the exam. Contrasting Groups is considered a good method to use when revisiting cut-score decisions to provide confirmatory evidence that the decisions are still valid (or evidence of the need to run a new cut-score study). A disadvantage to this method is that it can be subject to how well panelists know students being classified and any personal feelings they have toward those students.
Overview of an Empirical Cut-Score Method Using External Criteria The use of validity studies to set cut scores for placement decisions is common. Advantages of the use of empirical cut-score methods are the need for fewer panelists; less expense due to a much lower requirement for meeting space and reduced panelist travel costs, if applicable; and the ability to set multiple cut scores in a relatively short period of time. Disadvantages of empirical cut-score methods include the total reliance on data with little consideration or guarantee as to what different cut scores would mean
9
in terms of student mastery of specific content and the reliance on classroom grades, which are inherently subjective and may differ radically from one classroom to the next in terms of the level of content mastery necessary to achieve the same grade (Camara, Kimmel, Scheuneman, and Sawtell, 2003).
Table 2 Example of Intercept and Slope Values Using Logistic Regression
Logistic Regression Prediction
Slope
Logistic regression is a statistical method that uses binary information; e.g., the probability of success and probability of failure; to predict success based on a piece of information, e.g., a test score. In Table 1, the students who obtained a grade in a completed course are classified into score intervals by their scores on a test with a scale ranging from 20 to 119. The fraction of students in an interval who obtained a grade of A, B, or C over the total number of students in that interval who received a grade of A to F constitutes the proportion of successful students—or the observed probability of success with an A, B, or C—in that course. The proportion of students in each interval who got an A or a B is also given in Table 1. As expected, the proportion of successful completion tends to increase for students in higher score intervals. However, the increase is not always consistent across the score range. There are occasional anomalies caused by small sample sizes (N) in some score intervals.
Outcome Variable in the Model Pr (A, B, or C)
Intercept
-3.5763
0.0347
0.0378
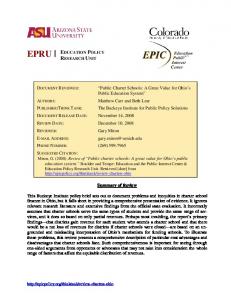
Finally, two logistic regression models are fitted to the data to predict success in the combined courses using the test scores; in one case success is defined as obtaining a grade of A, B, or C and in another it is defined as obtaining a grade of A or B. For each of the two models the intercept and slope coefficients of the equation
p log e i 1 − pi
= (Intercept ) + (Slope )(test scorei )
are presented in Table 2, where pi is the probability of success as given by the model. Each model provides expected probabilities of success that are plotted on a graph. There are two curves as can be seen in Figure 2. The solid line represents the expected probability of obtaining an A, B, or C in the course given a test score, and the dotted line represents the expected probability of obtaining an A or B for each � �� �
Table 1 Example of Proportion of Success
10
Pr (A or B)
-2.2731
�����������
��������������� � �� �
Score Interval
N
% A, B, or C
% A or B
20–24
3
0.00
0.00
25–29
2
0.00
0.00
30–34
2
0.00
0.00
35–39
6
0.33
0.00
40–44
11
0.45
0.18
45–49
14
0.29
0.07
50–54
19
0.42
0.05
55–59
15
0.27
0.13
60–64
28
0.50
0.21
65–69
23
0.61
0.43
70–74
43
0.56
0.28
75–79
77
0.66
0.45
80–84
58
0.57
0.33
85–89
78
0.68
0.42
90–94
61
0.66
0.46
95–99
59
0.80
0.51
100–104
38
0.71
0.50
105–109
23
0.83
0.61
����������
110–114
25
0.84
0.76
115–119
32
0.88
0.66
Figure 2. Graphs of predicted probability of success at each score point.
� �� �
����������������������
� �� �
� �� �
� �� �
� �� �
� �� �
� �� �
� �� �
� �� � ��
��
��
��
��
��
��
��
���
���
���
score. The logistic regression models estimated by the data indicate that there is a considerable increase in the predicted probability of success in these courses as the test score increases. Students with higher test scores have a much higher probability of succeeding in the courses than students with lower scores. College administrators can use the probabilities of success at each score point to evaluate the expected effect in terms of student success/failure to identify the optimal placement for the cut score. Separate analyses would need to be conducted for each course under consideration as a placement option.
Monitoring How Well Cut Scores Function While this paper attempts to address issues in setting initial cut scores for placement decisions, it would be negligent to not also remind users of cut-score information of the need to review and possibly reset cut scores on a regular basis. Cut scores should be reset at any time that the curriculum, assessment, or course sequence undergoes significant change. Additionally, it is wise to monitor how well the cut scores are functioning on a regular basis. If it appears that the number of students being placed into a specific course has drastically risen or dropped, without a good explanation (e.g., knowing that a remedial course has fewer students due to an increased focus on the basics in K–12), then it would be wise to redo the cut-score study and determine if the current cut scores are still appropriate. This would also be necessary if the number of students who were succeeding/failing in a specific course was to change dramatically, indicating that students were being placed in courses either too facile or too difficult for their abilities. It is recommended that cut-score decisions be revisited at least every five to seven years, unless there are performance issues that suggest that the cut scores should be revisited sooner. Empirical methods for setting cut scores work well for monitoring how well existing cut scores function.
Conclusion Making placement decisions can be challenging. It is especially important to remember that for many students, this may be a critical factor in smoothing their entry into college academia. In the current litigious society in which we live, it is well advised that colleges and universities consider the rigor and legal defensibility of the rules and methods used to guide the placement process. From a validity perspective the central focus should be on the development of reasonable performance standards and
the identification of corresponding cut scores to enable accurate categorization of student performance (Kane, 1994). This paper provides an introductory summary of the issues to be considered, but does not provide a comprehensive review of all issues. Additional details of some of the methods listed in this paper and details of alternative methods can be found in Cizek (2001), Hansche (1998), and Wallace (2000), among others.
References Angoff, W.H. (1971). Scales, norms, and equivalent scores. In R.L. Thorndike (Ed.) Educational Measurement (2nd ed., pp. 508–600). Washington, DC: American Council on Education. Beck, M.D. (2003, April). What are panelists really thinking when they set performance standards? Paper presented at the annual meeting of the National Council on Measurement in Education. Chicago, IL. Bingham, W.V.D. (1937). Aptitudes and aptitude testing. New York: Harper and Brothers Publishers. Busch, J.C., & Jaeger, R.M. (1990). Influence of type of judge, normative information, and discussion on standards recommended for the National Teacher Examinations. Journal of Educational Measurement, 27, 145. Camara, W.J., Kimmel, E., Scheuneman, J., & Sawtell, E. (2003). Whose grades are inflated? (College Board Research Report No. 2003-04). New York: College Board. Cizek, G.J. (2001). Setting performance standards: Concepts, methods, and perspectives. Mahwah, NJ: Lawrence Erlbaum Associates. Cizek, G.J., Bunch, M.B., & Koons, H. (2004). Setting performance standards: contemporary methods. Educational Measurement: Issues and Practice, 23(4), 31–50. Geisinger, K.F. (1991). Using standard-setting data to establish cut off scores. Educational Measurement: Issues and Practice, 10(2), 17–22. Fitzpatrick, A.R. (1989). Social influences in standard setting: The effects of social interaction on group judgments. Review of Educational Research, 59(3), 315–28. Hambleton, R.K., (2001). Setting performance standards on educational assessments and criteria for evaluating the process. In G.J. Cizek (Ed.), Setting performance standards: Concepts, methods, and perspectives. Mahwah, NJ: Lawrence Erlbaum Associates. Hambleton, R.K., Jaeger, R.M., Plake, B.S., & Mills, C.N. (2000). Handbook for setting standards on performance assessments. Washington, DC.: Council of Chief State School Officers. Hambleton, R.K., & Plake, B.S. (1995). Using an extended Angoff procedure to set standards on complex performance assessments. Applied Measurement in Education, 8(1), 41–55. Hansche, L.N. (1998). Handbook for the development of performance standards: Meeting the requirements of Title I. Bethesda, MD: U.S. Department of Education, Council of Chief State School Officers (CCSSO). Retrieved May 18, 2005, from http://www.ccsso.org/publications/details. cfm?PublicationID=131.
11
Jaeger, R.M. (1982). An iterative structured judgment process for establishing standards on competency tests: Theory and application. Educational Evaluation and Policy Analysis, 4, 461–76. Jaeger, R.M. (1989). Certification of student competence. In R.L. Linn (Ed.), Educational Measurement, (3rd ed., pp. 485–514). New York: American Council on Education and Macmillan. Kahl, S.R., Crockett, T.J., DePascale, C.A., & Rindfleisch, S.L. (1994, June). Using actual student work to determine cut scores for proficiency levels: New methods for new tests. Paper presented at the National Conference on Large-Scale Assessment, Albuquerque, NM. Kahl, S.R., Crockett, T.J., DePascale, C.A., & Rindfleisch, S.L. (1995, June). Setting standards for performance levels using the student-based constructed-response method. Paper presented at the annual meeting of the American Educational Research Association, San Francisco, CA. Kane, M. (1994). Validating the performance standards associated with passing scores. Review of Educational Research, 64(3), 425–61. Kingston, N.M., Kahl, S.R., Sweeney, K.P., & Bay, L. (2001). Setting performance standards using the body of work method. In G.J. Cizek (Ed.), Setting performance standards: Concepts, methods, and perspectives. Mahwah, NJ: Lawrence Erlbaum Associates. Lewis, D.M., Mitzel, H.C., & Green, D.R. (1996, June). Standard setting: A bookmark approach. In D.R. Green (Chair), IRT-based standard-setting procedures utilizing behavioral anchoring. Symposium conducted at the Council of Chief State School Officers National Conference on Large-Scale Assessment, Phoenix, AZ. Linn, R.L. (1978). Demands, cautions and suggestions for setting standards. Journal of Educational Measurement, 15, 301–8. Livingston, S.A. & Zieky, M.J. (1982). Passing scores: A manual for setting standards of performance on educational and occupational tests. Princeton, NJ: Educational Testing Service.
12
Mehrens, W.A. (1986). Measurement specialists: Motive to achieve or motive to avoid failure? Educational Measurement: Issues and Practice, 5(4), 11–14. Mitzel, H.C., Lewis, D.M., Patz, R.J., & Green, D.R. (2001). The bookmark procedure: Psychological perspectives. In G.J. Cizek (Ed.), Setting performance standards: Concepts, methods, and perspectives. Mahwah, NJ: Lawrence Erlbaum Associates. Nedelsky, L. (1954). Absolute grading for objective tests. Educational and Psychological Measurement, 14, 3–19. Public Law 100–297. (1988). National assessment of educational progress improvement act (Article No. USC 1221). Washington, DC. Shepard, L. (1980). Standard setting issues and methods. Applied Psychological Measurement, 4, 447–67. Sireci, S.G., Robin, F., & Patelis, T. (1999). Using cluster analysis to facilitate standard setting. Applied Measurement in Education, 12(3), 301–25. United States Department of Education. (2001). Condition of education 2001. Washington, DC: U.S. Government Printing Office. Wallace, M.R. (2000, April). Matching standard-setting methods to tests: One size does not fit all. Poster presented at the annual meeting of the National Council on Measurement in Education, New Orleans, LA. Webb, M.W. & Miller, E.R. (1995). A comparison of the paper selection method and the contrasting groups method for setting standards on constructed-response items. Paper presented at the annual meeting of the National Council on Measurement in Education, San Francisco, CA. Zieky, M.J., & Livingston, S.A. (1977). Manual for setting standards on the basic skills assessment tests. Princeton, NJ: Educational Testing Service.
www.collegeboard.com
050481692