Keywords: community and systems change; health planning; tobacco settlement; con- cept mapping; multidi- mensional scaling. The 1998 master settlement.
ARTICLE
January 1 5
HEALTH PROMOTION PRACTICE /MONTH YEAR
Policy and Politics
Setting Objectives for Community and Systems Change: An Application of Concept Mapping for Planning a Statewide Health Improvement Initiative William M. K. Trochim, PhD Bobby Milstein, MPH Betty J. Wood, PhD, MPH Susan Jackson, BA Virginia Pressler, MD, MBA, FACS The Hawaii Department of Health (HDOH) used concept mapping techniques to engage local stakeholders and national subject area experts in defining the community and system factors that affect individuals’ behaviors related to tobacco, nutrition, and physical activity. Over eight working days, project participants brainstormed 496 statements (edited to a final set of 90), which were then sorted and rated for their importance and feasibility. A sequence of multivariate statistical analyses, including multidimensional scaling and hierarchical cluster analysis, generated maps and figures that were then interpreted by project stakeholders. The results were immediately incorporated into an official plan, approved by the governor and state legislature, recommending how Hawaii’s tobacco settlement resources could be used to create sustainable changes in population health. The results also provide empirical support for the premise that both community and systems factors ought to be considered when planning comprehensive health improvement initiatives. Health Promotion Practice January 2004 Vol. 5, No. 1, 8-19 DOI: 10.1177/1524839903258020 ©2004 Society for Public Health Education 8
Keywords: community and systems change; health planning; tobacco settlement; concept mapping; multidimensional scaling
T
he 1998 master settlement agreement between the U.S. Attorneys General and the tobacco industry created a historic opportunity for protecting the public’s health. A total of 46 states received a share of the $206 billion settlement to use at their discretion. Some states invested these resources in tobacco prevention and control, others paid for the medical care expenses of individuals with tobacco-related illnesses, still others directed money outside of the health sector entirely, and many chose to fund a variety of activities (Centers for Disease Control and Prevention, 2001; National Conference of State Legislatures, 2001). A unique mix of perspectives shaped the allocation decisions in each state. The rapid influx of money came with high expectations for what could be accomplished, creating pressure for government leaders to devise sound strategies for putting the allocated funds to good use. Indeed, many governors and legislators required
detailed, outcome-oriented plans before agreeing to release the money. Relatively little is known about the processes that citizens, elected representatives, and agency officials used to negotiate priorities for their windfall funding. There also has not been a review of the specific outcomes that constituents in each state sought to achieve through these investments. This article describes how officials of the Hawaii Department of Health (HDOH), even while working under intense time pressure, were able to meaningfully involve multiple stakeholders in setting outcome objectives for their portion of the tobacco settlement fund.
> BACKGROUND The Tobacco Settlement in Hawaii Hawaii’s share of the master settlement agreement is approximately $1.3 billion to be paid over 25 years. The first installment of $14.8 million (approximately 2% of the HDOH annual operating budget) was paid on December 14, 1999. Only 5 months earlier, the Hawaii Tobacco Settlement Special Fund (Act 304), was signed into law on August 4, 1999, making Hawaii the first state in the nation to declare how they would allocate tobacco settlement
Policy and Politics funds. Thus, Hawaii was one of only a few states to dedicate a majority of the settlement revenue for public health priorities (National Conference of State Legislatures, 2001). Hawaii’s legislation mandated that 60% of the funds be used for tobacco prevention and control as well as health promotion and chronic disease prevention. The intent of the law was to invest a significant proportion of the funds in primary prevention initiatives that would eventually reduce the need for direct service programs, create a lasting impact on community conditions for health and wellness, and leverage the power of partnerships. By maintaining a consistent focus on promoting health and preventing chronic disease, leaders in Hawaii aimed to leave a legacy of healthier people as well as communities that support healthier living. A total of four priorities were identified and funded:
• Establish an emergency and bud-
get reserve fund (i.e., “rainy day fund”) as a supplemental source of funding to guard against economic instability, provide for disaster recovery, and improve the state’s bond rating (40% of the settlement); • establish a trust fund to ensure that resources are available in perpetuity for tobacco-related prevention and control activities (25%); • Provide funds to guarantee that every child in Hawaii has health insurance (up to 10%); and • support community-based health promotion initiatives aimed at reducing risk behaviors that are responsible for the greatest burden of chronic disease in the state (i.e., tobacco use, poor nutrition, and physical inactivity) (25%).
Oversight responsibility went to the HDOH for planning and managing both the tobacco trust fund and
the community-based health promotion activities; however, a strategic plan had to be delivered to the governor and the state legislature within 3 months outlining recommended program priorities and expenditures. The law mandated that the HDOH draft a strategic plan for review by the governor and state legislature within 5 months.
> METHODS Planning the Healthy Hawaii Initiative (HHI) Strategic planning has become an essential component of the management of large organizational endeavors both in the public and private sectors (Allison & Kaye, 1997; The Authors William M. K. Trochim, PhD, is a professor of Policy Analysis and Management at Cornell University in Ithaca, New York. Bobby Milstein, MPH, is an evaluation coordinator for the Division of Adult and Community Health at the Centers for Disease Control and Prevention in Atlanta, Georgia. Betty J. Wood, PhD, MPH, is the Preventive Health and Health Services block grant epidemiologist at the Hawaii Department of Health in Honolulu. Susan Jackson, BA, is the project manager for the Healthy Hawaii Initiative and the Tobacco Settlement Fund at the Hawaii Department of Health in Honolulu. Virginia Pressler, MD, MBA, FACS, is vice president of Women’s Health Services at Kapiolani Medical Center and Hawaii Pacific Health in Honolulu. She was deputy director of the Hawaii State Department of Health at the time of this work.
Koteen, 1997; Lorange, 1994). The HDOH began its strategic planning with commitments to engage multiple stakeholders and incorporate the latest prevention science. Its first step was to develop a “plan for the plan,” which assembled background information and set forth the broad goals, scope, assumptions, approaches, and responsibilities of staff. Next, HDOH planners consulted with scientists from the Centers for Disease Control and Prevention to learn about state-of-the-art techniques in health promotion and chronic disease prevention. In addition, HDOH and Centers for Disease Control and Prevention staff members worked together to develop a system for engaging stakeholders and ensuring accountability through ongoing evaluation and program improvement. Throughout the planning process, the focus was on developing a clear and convincing plan that could create meaningful health improvements and be practical to implement and evaluate. The program, now known as the HHI, is what emerged from that process. A Focus on Changing Community Conditions and Systems During the past decade, health departments have been encouraged to forge new partnerships and increase their focus on environmental and policy change as a means of improving population health (Institute of Medicine, 1996; U.S. Department of Health and Human Services, 2000a, 2000b). From the outset, the HHI strategy emphasized the importance of changing community conditions and systems (i.e., those programs, policies, practices, infrastructures, norms, and other factors that shape health-related behavior and affect health status). Building on expanded definitions of health promotion (O’Donnell, 1989), advance-
Trochim et al. / COMMUNITY AND SYSTEMS CHANGE
9
ments in ecological theory (Breslow, 1996; Green, Richard, & Potvin, 1996), as well as findings from prior evaluations of community interventions, the HHI planners understood that reductions in risk behavior as well as corresponding improvements in health status would be neither widespread nor sustainable without changing the context within which those behaviors occur (i.e., the predisposing, enabling, and reinforcing factors in the social, physical, and organizational environment) (Green & Kreuter, 1999). To be truly effective, interventions supported by the settlement fund would have to alter the community conditions and systems that shape behaviors related to tobacco use, diet, and physical activity.
According to this reasoning, positive changes in community conditions and systems are an important mechanism for achieving lasting health effects. As such, they provide an early indication of whether interventions are likely to be successful. To emphasize the full spectrum of expected effects and enhance the potential for evaluation, the HHI planners decided that their strategy should specify three levels of outcome objectives phased over time as follows:
• improvements
in population health status (most distant), • widespread changes in risk and protective behaviors (intermediate), and • changing community conditions and systems (most immediate).
The Healthy People 2010 objectives (U.S. Department of Health and Human Services, 2000b) along with surveillance data from Hawaii were available as guides for setting objectives regarding health status improvements as well as risk and protective behavior change. But it was difficult to find information that defined expected changes in community conditions and systems, especially considering Hawaii’s social diversity. Moreover, the short time frame enforced by Act 304 rendered infeasible traditional techniques for eliciting community input. The planners faced two unappealing options: either set objectives for community and systems change without the benefit of stakeholder consultation or omit from the writ-
> EDITORS’ COMMENTARY
State budgets are one of the most important factors in assuring that communities have the resources they need for health promotion. The budget process is complicated and often highly contentious. Several factors have influenced the ways these decisions are made at the state level, including open meeting policies, improved systems of communication, advocacy and lobbying efforts, media access and reporting, the consumer health revolution, and the Internet. Still, it has been hard to include input from everyone who has a stake in the process. Although community health practitioners agree that a need exists to systematically consider opinions of key stakeholders when planning budgets for health improvement initiatives, little has been written about successful strategies to accomplish that goal. This article describes an effort to use concept mapping to identify priorities and common objectives for state-level improvement in conditions and systems related to tobacco use, nutrition, and physical activity. The results had a clear impact on the development of Hawaii’s resource allocation plan, which ultimately was approved by the legislature and signed into law by the governor. Health promotion research and practice continues to move forward in innovative ways to provide evidence-based support for engaging stakeholders in policy approaches whose most immediate effect may well be seen as shifts in conditions and systems in the communities where people live. Ellen Jones, MS, CHES, is the associate director of the Mississippi Health Policy Research Center at Mississippi State University, Ridgeland, Mississippi. Lori Dorfman, DrPH, is director of the Berkeley Media Studies Group, a project of the Public Health Institute in Berkeley, California.
10
HEALTH PROMOTION PRACTICE / January 2004
Policy and Politics ten plan this critical element of their program philosophy. The concept mapping techniques described as follows offered a sound and practical solution to this dilemma. Defining the Domain of Community and Systems Factors The following concept mapping project was designed to develop an initial understanding of the community and systems factors that affect individuals’ behaviors related to tobacco, nutrition, and physical activity. The goal was to better define the boundaries and elements in this complex domain by synthesizing input from local stakeholders as well as national subject area experts. The project began with a review of existing knowledge about the topic. Public health practitioners, researchers, and theorists have long understood that to change the behavior of a large number of people—and ensure that those changes are sustainable—it is necessary to change the context in which they behave (Fawcett et al., 2000). This is because the environment within a community strongly influences what people do and how they feel (Green & Kreuter, 1999). Unfortunately, there is relatively little consensus among scholars or health professionals about precisely which contextual factors are most important for changing particular behaviors. This project was designed to gather participants’ ideas about factors that would support widespread, sustained change in tobacco use, nutrition, and physical activity. Concept Mapping Concept mapping (Trochim, 1989a; Trochim & Linton, 1986) is a
mixed-methods (Greene & Caracelli, 1997) planning and evaluation approach that integrates familiar qualitative group processes (brainstorming and pile sorting) with multivariate statistical analyses to help a group describe its ideas on any topic of interest and represent these ideas visually through a map. The process typically requires the participants to brainstorm a large set of statements relevant to the topic of interest, individually sort these statements into piles of similar ones, rate each statement on one or more dimensions, and interpret the maps that result from the data analyses. The analyses typically include multidimensional scaling (MDS) of the sort data, hierarchical cluster analysis of the MDS coordinates, and computation of average ratings for each statement and cluster of statements. The maps that result show the individual statements in twodimensional (x, y) space with more similar statements located nearer each other and grouped into clusters. Participants are actively involved in interpreting the results to ensure that the maps are understandable and labeled in a meaningful way. Concept mapping has been used effectively to address substantive issues across a wide range of fields (McLinden & Trochim, 1998; Shern, Trochim, & LaComb, 1995; Trochim 1989b; Trochim, Cook, & Setze, 1994; Witkin & Trochim, 1997). Participants Two groups were invited to participate in this project. First, within Hawaii, were health professionals and leaders from community agencies and coalitions (n = 34). In addition to various grassroots leaders, this group included members of the Tobacco Health and Wellness Advi-
sory Group, a panel created by Act 304 to assist in developing statewide community health programs. Second, colleagues outside of Hawaii with special expertise in community and systems change (n = 46) were invited to participate. These participants were identified by representatives from the Centers for Disease Control and Prevention and the American Evaluation Association and included leading scholars and practitioners in comprehensive community change. Both groups were selected to include people whose interests encompassed the subject areas of tobacco, nutrition, and physical activity. Procedure The developer of this concept mapping methodology (Trochim, 1989a) facilitated the process, which took place during 8 working days (November 23 through December 3, 1999). The Concept System computer software1 (Concept Systems, 2000) was used to perform all analyses and produce all of the maps and statistical results. Most of the data were collected over the World Wide Web using the Concept System Global software to allow for participation across the Hawaiian Islands and beyond. Stakeholder input was accomplished in two phases. The first involved generating a list of community and systems factors related to tobacco use, nutrition, and physical activity. Phase 2 consisted of organizing and prioritizing those factors followed by interpretation of the results. The initial definition of community and systems factors provided to participants was deliberately broad. It stated that these are “characteristics of a community’s social, physical, and organizational environment
Trochim et al. / COMMUNITY AND SYSTEMS CHANGE
11
that might influence health behavior and health status either directly or indirectly.” Phase 1: Generating Community and Systems Factors Participants responded to the following focus statement: “Generate statements that describe specific community or systems factors that affect individuals’ behaviors related to tobacco, nutrition, and physical activity.” Both Web-based and live brainstorming sessions were used to gather responses. Participants visited the project Web site and brainstormed (Osborn, 1948) their initial ideas between November 23 and December 1. This yielded 448 statements in 53 user sessions. Second, five HDOH managers participated in a live brainstorming session at the HDOH offices on December 1, 1999, resulting in 48 additional statements. Analysts pooled statements from both methods, yielding 496 statements, many of which were conceptually similar or redundant. A total of three HDOH staff members, with guidance from the concept mapping facilitator, consolidated the list into the final set of 90 unique statements. This involved doing a rapid sort of the statements into more than 100 piles based on similarity, merger of similar piles, consolidation of nearly identical statements, and integration of detailed statements into broader ones. For instance, three of the original brainstormed statements were as follows: “Providing more pedestrian-friendly environments to encourage walking short distances for increased physical activity,” “Percentage of primary and secondary roads with median wide enough to accommodate pedestrians and bicylists,” and “Percentage of pedes12
trian underpasses featuring adequate lighting.” These and other similar statements were consolidated into the final “pedestrianfriendly environments” descriptor” (34).2 Phase 2: Organizing Community and Systems Factors Each participant used the Concept System Global program via the World Wide Web to
• record demographic characteristics, • sort brainstormed statements, and
• rate brainstormed statements. Demographics. Each participant answered the following two demographic questions: one on primary areas of interest (i.e., physical activity, nutrition, tobacco, Hawaiian Health, or other) and one on organizational location (i.e., the HDOH, Hawaii not Department of Health, or not in Hawaii). Sorting. Each participant conducted an unstructured sorting (Coxon, 1999; Rosenberg & Kim, 1975; Weller & Romney, 1988) of the statements by grouping them into piles. The only restrictions in sorting the 90 statements were that participants could not (a) have 90 piles with one item in each, (b) have one pile consisting of all 90 items, or (c) have any piles that grouped conceptually dissimilar items (e.g., a “miscellaneous” pile). Ratings. Participants rated each of the 90 statements on two dimensions—importance (compared with other factors) and feasibility (during the next 2 to 5 years)—on a 5-point scale with 5 indicating extremely important or extremely feasible. A total of 25 participants logged onto the Web site during the 2-day
HEALTH PROMOTION PRACTICE / January 2004
organizing phase (December 1-3). Of these, 11 completed the sorting task, 19 completed the importance rating, and 14 completed the feasibility rating. These numbers are not unusual in this methodology, which is often used as an alternative to traditional focus group interview procedures that frequently involve even fewer participants. Trochim (1993), in summarizing meta-analyses of 38 projects, reports an average of approximately 14 sorters and raters in each project with a standard deviation of approximately 6. Concept Mapping Analysis The concept mapping analysis uses the sort information to construct an N × N binary, symmetric matrix of similarities, Xij. For any two items i and j, a 1 was placed in Xij if the two items were placed in the same pile by the participant; otherwise, a 0 was entered (Weller & Romney, 1988). The total N × N similarity matrix, Tij was obtained by summing across the individual Xij matrices. Thus, any cell in this matrix could take integer values between 0 and 11 (i.e., the number of people who sorted the statements); the value indicates the number of people who placed the i,j pair in the same pile. The total similarity matrix Tij was analyzed using nonmetric MDS analysis (Davison, 1983) with a twodimensional solution as recommended by Kruskal and Wish (1978). The two-dimensional solution yields a configuration in which statements piled together most often are located more closely in twodimensional space than are those piled together less frequently. The usual statistic reported in the MDS analyses to indicate the goodness of fit of the configuration is called the stress value. A lower stress value
Policy and Politics indicates a better fit. In a study of the reliability of concept mapping, Trochim (1993) reported that the average stress value across 33 projects was .285 with a range from .155 to .352. The stress value in this analysis was .257, which is better (i.e., lower) than average. The x,y configuration was the input for the hierarchical cluster analysis using Wards algorithm (Everitt, 1980) as the basis for defining a cluster. Using the MDS configuration as input to the cluster analysis in effect forces the cluster analysis to partition the MDS configuration into nonoverlapping clusters in two-dimensional space. No simple mathematical criterion is available by which a final number of clusters can be selected. The analysts examined an initial cluster solution that was the maximum thought desirable for interpretation in this context (i.e., 20 clusters). Then, the analysis team (comprising concept mapping experts and community health professionals in Hawaii) examined successively lower cluster solutions, making a judgment at each stage about whether the merger seemed substantively reasonable. Judgments about the suitability of each solution were discussed among the analysts and resulted in acceptance of the seven-cluster solution, as this preserved the most detail while yielding interpretable clusters.
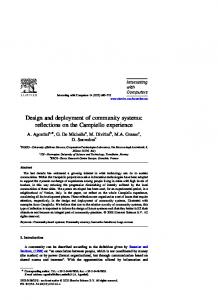
> RESULTS Map Results In concept mapping, several different maps are typically generated based on the same underlying structure, the arrangement of the statements by the MDS. The foundation for all maps is the labeled pointcluster map (see Figure 1), which shows all of the community and sys-
Environment Infrastructure 24
89
Policies and Laws 18 25, 39 31 49 55 37 67
82 22, 43
Access
87
44 34
15
47 38
81 76 57
45
11 21 32
2
58 65
29
60 86
9, 12
63 46
4
33 5
50
Children & School
17
61
77 52
64
79
36 16
88
10
62
3
70 42
71
41 35
78 8
53 90 27
51
23
Coalitions/Collaborations
20 13
59 48
26
80 84
14
75
7 85
Community Infrastructure
54 40 72 30 6 74 56 68 73 83 19
28 69 66 1
Information/ Communication
FIGURE 1 Point-Cluster Map Showing the Multidimensional Scaling Arrangement of the 90 Statements With the Seven-Cluster Solution and Labels Superimposed
tem factors (points) in relation to each other as arranged by the MDS. Points are located closer to each other if more people sorted them together into a group. In general, points that are closer together are more similar in meaning. The analysis groups these points into clusters as shown. In this project, the sevencluster solution best fits the data. The analysis also mathematically selects the best-fitting label for each cluster from all of the pile labels generated by all of the sorters. These were examined in relation to the statements in each cluster, and if the analysts determined that the suggested label did not appropriately cover the content, the next best fitting was examined until an appropriate cluster label was identified. The three clusters across the top of the map (i.e., policies and laws, environment infrastructure, and access) refer to systems factors that are often associated with government. The three clusters on the bottom (i.e., coalitions and/or collabo-
rations, community infrastructure, and information and/or communication) all refer in some way to local community conditions. The central location of the children and school cluster suggests that the educational system might be an especially useful link between the systems clusters on the top and the community ones below. In other words, the educational system might have special strategic importance in addressing tobacco use, nutrition, and physical activity. Ratings Table 1 shows the statements in each cluster that had the highest average importance or feasibility. Maps can also display rating results. For instance, the importance rating map (see Figure 2) shows the average relative importance of each cluster for the entire group of participants. The number of layers indicates the average importance rating. The aver-
Trochim et al. / COMMUNITY AND SYSTEMS CHANGE
13
TABLE 1 Top Two Statements in Each Cluster in Importance or Feasibility Showing Statement ID Number, Statement Text, Average Importance Rating, and Average Feasibility Rating Organized Alphabetically by Cluster and Within Cluster in Descending Order by Average Importance ID
Statement
Access 2 Easy, affordable access to healthy food, safe places for physical activity, and strict antismoking policies 12 Availability of healthy food choices at a wide variety of retail, institutional, and educational locations 11 Expanded hours for recreation centers and pools 58 Availability of school sites for after-school and community health activities (low cost or no cost) Children and school 46 Amount and quality of physical education and physical fitness training in schools 10 Literacy 17 Joint school-community activities and/or programs to promote health 79 Encourage innovative use of space for physical activity Coalitions and/or collaborations 8 A caring, nurturing parent or surrogate parent in early childhood 88 Health care provider adherence to counseling for tobacco cessation, physical activity, and nutrition 71 Professional and organizational coalitions and partnerships 3 Involvement of faith communities in health promotion Community infrastructure 84 Focus on lifelong physical activity 75 Engaging target populations in promoting health 85 Community recognition of good health role models Environment infrastructure 63 Equal opportunities for participation in physical activity programs regardless of age, gender, or disability 34 Pedestrian-friendly environments 47 Well maintained equipment in recreational facilities Information and/or communication 54 Media-supported health promotion campaigns 68 Information that is culturally sensitive and appropriate 28 A report card on legislators actions on health issues 19 Collateral material on healthy lifestyles (e.g., print materials, posters, visuals, public displays) Policies and laws 31 School policy promoting physical activity, healthy diet, and tobacco control 39 Policies that promote healthy transportation alternatives (cycling, walking, public transportation, and so forth) 43 Public and worksite policy that supports tobacco control 45 Restricted access to tobacco products for youth
age represented by the layers is actually a double averaging across all of the participants and all of the factors in each cluster. Consequently, even slight differences in 14
averages between clusters are likely to be significant. The map clearly shows that the environment infrastructure, policies and laws, and community infrastructure clusters
HEALTH PROMOTION PRACTICE / January 2004
Importance
Feasibility
4.47
3.14
4.16 4.11
3.71 4.07
3.89
4.14
4.37 4.21 4.00 3.74
3.57 2.86 3.86 3.86
4.53
3.14
4.11 3.95 3.53
3.50 3.86 3.86
4.58 4.39 3.95
4.50 3.93 4.29
4.47 4.37 3.95
3.64 3.79 3.71
4.58 4.32 3.68
4.14 4.07 4.21
3.00
4.29
4.53
3.93
4.37 4.32 4.26
3.79 4.29 4.36
were judged by participants to be most important. The map of perceived feasibility (see Figure 3) shows that policies and laws, community infrastructure,
Policy and Politics
Environment Infrastructure Policies and Laws
Access
Children & School
Coalitions/Collaborations
Layer Value 1 3.68 to 3.77 2 3.77 to 3.85 3 3.85 to 3.94 4 3.94 to 4.02 5 4.02 to 4.11
Information/Communication Community Infrastructure
Item Analysis
FIGURE 2 Importance Rating Map Showing the Average Cluster Rating for the Importance Variable
Environment Infrastructure Policies and Laws
Access
Children & School
Coalitions/Collaborations
Layer Value 1 3.29 to 3.40 2 3.40 to 3.51 3 3.51 to 3.61 4 3.61 to 3.72 5 3.72 to 3.83
across two maps. For instance, the relationship between average importance and average feasibility across all participants is shown in Figure 4. Although environment infrastructure was rated most important, it was the second lowest in feasibility, whereas information and/or communication was lowest in importance and highest in feasibility. In general, the areas that would be most fruitful to pursue are those judged both important and feasible. According to Figure 4, the policies and laws and community infrastructure clusters best meet that requirement.
Information/Communication Community Infrastructure
FIGURE 3 Feasibility Rating Map Showing the Average Cluster Rating for the Feasibility Variable
and information and/or communication were rated as most feasible for achieving change during the next 2 to 5 years.
Pattern Matching Pattern matching is used when comparing patterns of variables
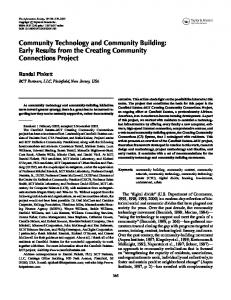
To examine the relationship between importance and feasibility, we plotted the two variables against one another. This analysis revealed that Statement 84 (i.e., focus on lifelong physical activity), for example, was rated highest in both importance and feasibility. The bivariate plot of feasibility and importance for all 90 statements is shown in Figure 5. The statement identification numbers in the figure can be linked to the 90 specific statements that were brainstormed by participants. The final cluster map with the major interpreted features overlaid upon the clusters is presented in Figure 6. The figure provides evidence that the initial conceptual distinction between community and systems factors has some empirical corroboration (i.e., the clusters on the top describe systems factors whereas those across the bottom depict community factors). The map can also be interpreted from left to right in terms of regions or clusters of clusters. The two clusters on the left define the structure region that includes the system factors policies and law and the community factors coalitions and /or collaborations. In the center
Trochim et al. / COMMUNITY AND SYSTEMS CHANGE
15
is the infrastructure region that includes both environmental infrastructure and community infrastructure and the cluster children and school that bridges between these. Finally, on the right of the map is the transmission region that includes the system factors access and the community factors information and/ or communication.
Importance
4.11
16
3.83
Environment Infrastructure
Information/Communication
Policies and Laws
Community Infrastructure
Community Infrastructure
Policies and Laws
Children & School
Children & School
> DISCUSSION
Access
Access Coalitions/Collaborations
Environment Infrastructure Coalitions/Collaborations
Information/Communication 3.68
3.29 r = .07
FIGURE 4 Ladder Graph Pattern Match of Importance and Feasibility
4.5 4.0
85
41 20
28,90
84
45
1 19
Feasibility
The mapping process had several immediate positive consequences. First, it provided the HDOH with a systematic process that was perceived by multiple stakeholders to have a high degree of credibility. Second, the concept mapping process and its results reached influential stakeholders throughout Hawaii, including leaders from community agencies and coalitions across the state, enabling broader stakeholder engagement than might otherwise have been possible and generating results that were fed back to those stakeholders in a timely manner. Third, the results were translated directly into specific objectives that were incorporated into the HHI plan and subsequently implemented. For example, consider how just the five statements rated highest in both importance and feasibility were enacted. To address focus on lifelong physical activity (84) the HHI adopted a policy to promote activities of daily living (as opposed to enhancing skills of athletes). For media-supported health promotion campaigns (54), the HHI developed the “Start. Living. Healthy.” campaign to raise awareness and knowledge of healthy behaviors through radio, television, print, and Internet media. For school policy promoting PA, diet, and tobacco control (31), the HHI provided funding to 24 schools statewide to initiate healthy school workgroups to address school
Feasibility
43
11 83 54 66 58 68 82 17,30 80 26 75 31 144 18,71 22 3 87 34,39 33 53 79 9,73 8612 47 56 25 32,78 59 23 63 89 67 64 46 49 74 62 55 88 5065 38 44 245 13 57 16
6 40
3.5
42 81
69 7
61
36
3.0
76
60 37
52
72
2
21 51
29 27 77
8
15 10
48
2.5 35
2.0
70
2.5
3.5
4.5
Importance FIGURE 5 Bivariate Plot of Feasibility Versus Importance for the 90 System and Community Factors
health policies. To address engaging target populations in promoting health (75), the HHI provided funding to 26 communities to conduct
HEALTH PROMOTION PRACTICE / January 2004
community needs assessments and plan community-based health promotion activities. To address standardized and consistent messages
Policy and Politics
System Factors
Infrastructure
Transmission
Structure Environment Infrastructure Policies and Laws
Access
Children & School
Coalitions/Collaborations Information/Communication Community Infrastructure
Community Factors FIGURE 6 Final Concept Map Showing Clusters and Relationships to Theoretical Constructs
and/or information about risks and recommended behaviors (80), the HHI contracted with the University of Hawaii School of Medicine to provide continuing education for health professionals to increase the number of health workers who make appropriate recommendations and referrals. Overall, the mapping process enabled the HDOH to move rapidly and develop a statewide health improvement plan in a timely fashion. Using the concept mapping approach, the HDOH succeeded in obtaining outside input in a matter of weeks from broad-based, voluntary, and anonymous stakeholders. The method was cost-effective and capitalized on the benefits of Web technology. Hawaii imposes significant barriers on stakeholder gatherings because of its geography, as air travel is the only practical means of transportation between the islands. Using the Web made it pos-
sible to involve people from throughout the state without necessitating face-to-face meetings. The concept mapping process provided a solid, credible foundation to support the HDOH proposal. It helped fulfill the legal mandate contained in Act 304 as well as the ethical standards to involve stakeholders in shaping decisions that would affect them. The mapping results validated the HDOH’s recommended intervention strategy and provided the opportunity to translate public health theory into a grounded action plan. The results also suggest several conclusions that extend beyond the immediate context of this study. First, the theoretical distinction between community and systems factors was clearly recovered in the maps, with all community-related clusters arrayed across the bottom of the map and system-related clusters grouped across the top. Second, the
results illustrate how a hierarchical, visual display of stakeholder perceptions can have general utility for health planning. Depending on the specificity needed, when considering issues, planners can easily move between the different levels of generality from the broad community-system view, to the three-category structure-infrastructure-access scheme, to the seven categories depicted by the clusters, or to the 90 specific brainstormed statements. In one hierarchical graphic device, the map provides a high-level organizing structure and considerable operational detail that together can be used to guide action planning as well as evaluation design and measurement. Although concept mapping has many benefits, as previously noted, the tight deadline and other factors made it difficult to use the method in an optimal way. For instance, participation rates among those in Hawaii as well as national public health professionals were lower than expected. This is likely due, at least in part, to the study’s timing because the process took place during the Thanksgiving holiday. The brief duration of the study most likely also affected participation. Extending the process for several more weeks and setting up a more extensive system to prompt and remind participants would improve participation. Consolidating the large number of brainstormed statements into a manageable subset was also challenging, especially given the short deadline. Staff members had only a single evening to reduce 496 brainstormed statements to the final set of 90. Furthermore, the process used here did not examine how particular community or systems factors might relate differently to the three specific health behaviors (i.e., tobacco use, nutrition, and physical activity).
Trochim et al. / COMMUNITY AND SYSTEMS CHANGE
17
This limitation is a consequence of the deliberate decision to elicit statements that pertain to all three behaviors in one project. Although it would have been possible to conduct three parallel concept mapping studies, this would have increased the time and cost; it would also have reinforced categorical distinctions that might overly constrain the aims of a comprehensive community health initiative. Although there was not sufficient time to address this issue in this project, one alternative approach for future consideration would be to classify each statement with respect to which of the behaviors it addresses either through direct coding or through an additional rating. The advantage of this (over three separate maps) would be to show the relative emphases in each of the three areas while still preserving the integrated perspective across them. In spite of these limitations, the concept mapping technique provided an effective way of (a) engaging geographically dispersed stakeholders, including local constituents and subject area experts across the country; (b) generating valid findings that are understandable for nonscientists and have clear implications for policy and practice; and (c) delivering useful results in a brief period of time at relatively low cost. Finally, it is worth noting that the map results provide a contextual framework that can be useful for subsequent evaluation of the HDOH plan. At regular intervals, perhaps annually, the HDOH might review each of the clusters and assess the degree to which relevant actions have been taken and behavioral outcomes affected. This can be done either qualitatively as part of an overall program review or quantitatively through a surveillance system designed to capture changes in com18
munity conditions and systems. Results from such evaluations can be linked either qualitatively or statistically to the original planning ratings of importance and feasibility. In this way, the map structure can act as a unifying device that helps integrate initial planning with ongoing assessment and close the loop on the traditional planning-evaluation cycle. The concept mapping technique proved to be a cost-effective and successful way of identifying statewide objectives for changes in community conditions and systems relating to tobacco use, nutrition, and physical activity. This process enabled the HDOH to develop its HHI in a timely way, and their experience shows how a hierarchical, visual display of stakeholder perceptions can be useful for health planning. NOTES
1. The Concept System and Concept System Global software are licensed through Concept Systems Incorporated, Ithaca, New York (http://www.conceptsystems.com). 2. Throughout this article, identification numbers associated with the final brainstormed statements are shown in parentheses to enable one to locate the statements in tables and on maps.
REFERENCES Allison, M., & Kaye, J. (1997). Strategic planning for nonprofit organizations: A practical guide and workbook. New York: John Wiley. Breslow, L. (1996). Social ecological strategies for promoting healthy lifestyles. American Journal of Health Promotion, 10, 253257. Centers for Disease Control and Prevention. (2001). Investment in tobacco control: State highlights 2001. Atlanta: U.S. Department of Health and Human Services, Centers for Disease Control and Prevention, National Center for Chronic Disease Prevention and Health Promotion, Office on Smoking and Health. Concept Systems. (2000). The Concept System. Ithaca, NY: Concept Systems Incor-
HEALTH PROMOTION PRACTICE / January 2004
porated. Available conceptsystems.com
from
http://www.
Coxon, A. P. M. (1999). Sorting data: Collection and analysis (Sage University Papers on Quantitative Applications in the Social Sciences, 07-127). Thousand Oaks, CA: Sage. Davison, M. L. (1983). Multidimensional scaling. New York: John Wiley. Everitt, B. (1980). Cluster analysis (2nd ed.). New York: Halsted. Fawcett, S. B., Francisco, V. T., Hyra, D., Paine-Andrews, A., Schultz, J. A., & Russos, S., et al. (2000). Building healthy communities. In A. Tarlov & R. St. Peter (Eds.), The society and population health reader: A state and community perspective (pp. 7593). New York: New Press. Green, L. W., & Kreuter, M. W. (1999). Health promotion planning: An educational and ecological approach (3rd ed.). Mountain View, CA: Mayfield. Green, L. W., Richard, L., & Potvin, L. (1996). Ecological foundations of health promotion. American Journal of Health Promotion, 10, 270-281. Greene, J. C., & Caracelli, V. J. (1997). Advances in mixed-method evaluation: The challenges and benefits of integrating diverse paradigms. New Directions for Evaluation, 74. Institute of Medicine. (1996). Healthy communities: New partnerships for the future of public health (M. A. Stoto, C. Abel, & A. Dievler, Eds.). Washington, DC: National Academy Press. Koteen, J. (1997). Strategic management in public and nonprofit organizations: Thinking and acting strategically on public concerns. New York: Praeger. Kruskal, J. B., & Wish, M. (1978). Multidimensional scaling. Beverly Hills, CA: Sage. Lorange, P. (1994). Strategic planning process. Brookfield, VT: Dartmouth Publishing Company. McLinden, D. J., & Trochim, W. M. K. (1998). Getting to parallel: Assessing the return on expectations of training. Performance Improvement, 37(8), 21-26. National Conference of State Legislatures. (2001). State allocation of tobacco settlement funds FY 2000 and FY 2001. Washington, DC: Health Policy Tracking Service National Council of State Legislatures. O’Donnell, M. P. (1989). Definition of health promotion: Part III: Expanding the
Policy and Politics definition. American Journal of Health Promotion, 3(3), 5. Osborn, A. F. (1948). Your creative power. New York: Scribner. Rosenberg, S., & Kim, M. P. (1975). The method of sorting as a data gathering procedure in multivariate research. Multivariate Behavioral Research, 10, 489-502. Shern, D. L., Trochim, W., & LaComb, C. A. (1995). The use of concept mapping for assessing fidelity of model transfer: An example from psychiatric rehabilitation. Evaluation and Program Planning, 18, 2. Trochim, W. (1989a). An introduction to concept mapping for planning and evaluation. Evaluation and Program Planning, 12, 1-16. Trochim, W. (1989b). Concept mapping: Soft science or hard art? Evaluation and Program Planning, 12, 87-110.
Trochim, W. (1993, November). Reliability of concept mapping. Paper presented at the annual conference of the American Evaluation Association, Dallas. Trochim, W., Cook, J., & Setze, R. (1994). Using concept mapping to develop a conceptual framework of staff’s views of a supported employment program for persons with severe mental illness. Consulting and Clinical Psychology, 62, 766-775. Trochim, W., & Linton, R. (1986). Conceptualization for evaluation and planning. Evaluation and Program Planning, 9, 289308. U.S. Department of Health and Human Services. (2000a). Reducing tobacco use: A report of the surgeon general. Atlanta: U.S. Department of Health and Human Services, Centers for Disease Control and Prevention, National Center for Chronic Disease Preven-
tion and Health Promotion, Office on Smoking and Health. U.S. Department of Health and Human Services. (2000b). Healthy People 2010 (2nd ed., Vols. 1-2). Washington, DC: Government Printing Office. Weller, S. C., & Romney, A. K. (1988). Systematic data collection. Newbury Park, CA: Sage. Witkin, B., & Trochim, W. (1997). Toward a synthesis of listening constructs: A concept map analysis of the construct of listening. International Journal of Listening, 11, 6987.
Trochim et al. / COMMUNITY AND SYSTEMS CHANGE
19