5290 • The Journal of Neuroscience, June 1, 2005 • 25(22):5290 –5297
Behavioral/Systems/Cognitive
Shared Brain Areas But Not Functional Connections Controlling Movement Timing and Order Gae¨tan Garraux,1,2 Christopher McKinney,1 Tao Wu,1 Kenji Kansaku,1 Guido Nolte,1 and Mark Hallett1 1 2
Human Motor Control Section, National Institute of Neurological Disorders and Stroke, National Institutes of Health, Bethesda, Maryland 20892-1428, and Cyclotron Research Center and Department of Neurology, University of Lie`ge, 4000 Lie`ge, Belgium
Virtually every aspect of the enormous repertoire of human behaviors is embedded in a sequential context, but brain mechanisms underlying the adjustment of two fundamental dimensions defining a motor sequence (order of a series of movements and intervals separating them) as a function of a given goal are poorly understood. Using functional magnetic resonance imaging, we demonstrate that, at the neuronal level, these tasks can only be distinguished by differences in functional interactions between associative areas of common activation, which included bilateral subcortico-parieto-frontal regions, and two subcortical structures. Activity in these shared associative areas was preferentially coupled with that in right putamen during manipulation of timing and with that in right posterior cerebellum during manipulation of serial order. This finding is important because it provides evidence for an efficient organization of the brain during cognitive control of motor sequences and supports a recently proposed principle according to which the role of brain regions involved in different behavioral tasks without differential alterations in their measured activity depends on changes in their interactions with other connected areas as a function of the tasks. Key words: motor control; fMRI; connectivity; cerebellum; putamen; cognition
Introduction Humans exhibit an enormous repertoire of motor behaviors that enables us to interact with many different objects under a variety of different environments. Virtually every aspect of behavior is embedded in a sequential context, and, therefore, sequencing of actions represents a major task for the brain. Central to this task is the adjustment of two fundamental dimensions defining a sequence (order of movements and intervals separating them) as a function of internal or external goals. Results from psychophysical experiments in humans and simulation studies suggest that neural systems controlling cognitive aspects of temporal and ordinal dimensions are closely related (Keele, 1987; Dominey, 1998). Although this hypothesis is attractive because it would account for the fact that both dimensions can be combined flexibly, the pieces of evidence that could provide support for it are only indirect and mainly arise from studies that separately investigated neural substrate underlying timeand serial order-related cognitive operations (Petrides, 1991; Marshuetz et al., 2000; Rao et al., 2001; Brody et al., 2003). To directly address this hypothesis, brain activity was recorded using blood oxygen level-dependant (BOLD) functional Received Jan. 25, 2005; revised April 1, 2005; accepted April 16, 2005. G.G. is a research associate at the Fonds National de la Recherche Scientifique Belge. G.G. was also supported by grants from the Fondation Horlait-Dapsens, the Belgian American Educational Foundation, NATO, National Institute of Neurological Disorders and Stroke, and the Fondation Le´on Fre´de´ricq (University of Lie`ge). We thank Nguyet Dang for technical assistance and Devera Schoenberg for skillful manuscript editing. Correspondence should be addressed to Dr. Mark Hallett, Human Motor Control Section, National Institute of Neurological Disorders and Stroke, National Institutes of Health, Building 10, Room 5N226, 10 Center Drive, MSC 1428, Bethesda, MD 20892-1428. E-mail:
[email protected]. DOI:10.1523/JNEUROSCI.0340-05.2005 Copyright © 2005 Society for Neuroscience 0270-6474/05/255290-08$15.00/0
magnetic resonance imaging (fMRI) while healthy individuals were instructed to manipulate, during performance, either interval timing or order of a series of five movements in accord to an externally defined goal. Imaging data were compared according to a three-stage procedure. In the first and second stages, we investigated which brain areas are commonly and differentially involved across tasks. If, as we predict, some associative brain regions show a similar increase in their activity during both conditions, it is still possible that their role differs as a function of the task. Indeed, a brain region may be involved in different behaviors without differential alterations in its measured activity (McIntosh et al., 2003). In that case, current theories in neurobiology emphasize that its functional role may depend on its neuronal context given by the set of other areas with which it interacts (McIntosh et al., 2001). Hence, we have investigated in the third stage which brain regions, if any, among those that are commonly activated as identified in the first stage, show different interactions with areas identified in the second stage as a function of the tasks. The present study differs from previous ones in which brain regions controlling movement timing and order were directly compared in the same subjects (Schubotz and von Cramon, 2001; Sakai et al., 2002; Bengtsson et al., 2004) by two crucial methodological aspects. First, from a behavioral point of view, movement timing and order in these studies were always imposed on the participants by the experimenter. Hence, the neural substrate underlying cognitive processes involved in the internally guided decision about timing or order of movements could not be assessed. Second, with respect to data analysis, these studies were mainly designed to test for differences in regional brain activity between tasks and did not test for either an overlap of activation
Garraux et al. • Functional Connectivity in Movement Timing and Order
Figure 1. General framework common to all four experimental sessions. fMRI sessions differed by the type of sequences presented to the subjects during the sequence block and task requirements during the movement block (see Materials and Methods).
maps across conditions or condition-specific differences in functional interactions between activated brain regions.
Materials and Methods Subjects. Informed verbal and written consents for this research protocol, which was approved by the National Institute of Neurological Disorders and Stroke Institutional Review Board, were obtained from all subjects. Eleven healthy subjects (five females, six males) aged between 21 and 40 years, were recruited from the National Institutes of Health database of volunteers. All participants were right-handed according to the Edinburgh Inventory (Oldfield, 1970). None of them had any history of neurological disorder, head trauma with loss of consciousness, epilepsy, brain surgery, systemic illness, or excessive drug or alcohol consumption. Task procedures. Subjects laid supine in the scanner and looked at a mirror fixed on the head coil, allowing them to comfortably see an opaque screen located at their feet on which visual stimuli were rear projected. A white fixation point was permanently displayed on the center of the screen on a black background throughout the experiment. The right hand rested on an ergonomic right-hand five-button response unit (MRI Devices, Waukesha, WI). There was a one-to-one mapping between a digit and a key. A vacuum bag was used to reduce head movements during image acquisition. The fMRI experiment was organized into four separate sessions that differed by the experimental condition: manipulation of timing [TIMING], manipulation of order [ORDER], self-initiated [SI], and visually triggered [VT] conditions. The order of fMRI sessions was pseudorandomized across subjects, and participants were informed about which task to perform before beginning each fMRI session. All four fMRI sessions were 8 min long and had many features in common. The behavioral paradigm, which was derived from that used in a previous study by our group (Garraux et al., 2005), included eight cycles of three blocks (Fig. 1). The onset of each block was indicated to the subjects by displaying a short visual instruction on the screen for 400 ms: “sequence,” “movement,” and “fixation cross,” respectively. After “sequence,” the five items of a sequence were presented to the subject by sequentially displaying digits 1–5 for 300 ms in a certain order and at a frequency of one digit per second. Subjects were encouraged to mimic the corresponding series of finger movement during this encoding phase knowing that digits 1, 2, 3, 4, and 5 referred to a button press with the thumb, index, middle, ring, and little fingers of the right hand, respectively. The presentation of the numerical sequence was followed by a delay (⬃6 s), during which subjects had to prepare the movement task to perform next. Twelve seconds after onset of the first block, “movement” was displayed, cueing subjects to perform one of the four movement tasks according to the instructions given before the fMRI session onset. All four tasks involved performance of a total of 10 button presses using brisk finger movements (each button pressed twice) at an average frequency of ⬃0.5 Hz. Each button press was preceded (in [ORDER] and [VT]) or followed (in [TIMING] and [SI]) by the display of a white cross on the center of the screen for 300 ms. In [ORDER] and [VT], the cross was used as an external cue that indicated the timing of movements to the subjects. In [TIMING] and [SI], the interval duration between two consecutive finger movements was determined by the subjects, and the cross was then used as a visual feedback after each button press. In all four tasks, the cross was thus displayed 10 times at variable intervals during the movement block. No feedback was given to the subjects about their accuracy. Finally, 24 s after the movement block onset, “fixation cross” was displayed on the screen, indicating the baseline block onset. This
J. Neurosci., June 1, 2005 • 25(22):5290 –5297 • 5291
baseline block consisted in the presentation of a white cross displayed 10 times for 300 ms at unpredictable intervals with an average frequency of ⬃0.5 Hz. The emphasis was placed on watching the fixation point at the center of the screen and paying attention to the cross. Thus, visual stimuli characteristics were similar to those used in the movement block, but no movement was required. This general framework was common to all four fMRI sessions. Differences between sessions were restricted to a few crucial aspects: the type of sequence presented during the sequence block and the task requirements during the movement block. In [TIMING] and [ORDER] conditions, different numerical sequences, unknown from the subjects, were presented across cycles. In [SI] and [VT] conditions, only two sequences were used (4-1-3-2-5 or its reverse 5-2-3-1-4), which subjects learned before the experiment. To maintain a constant level of attention throughout the session, the two prelearned sequences were presented in a pseudorandom order across cycles. The fMRI sessions also differed in the instructions given to the subjects for the movement block. In [TIMING], subjects were asked to perform the sequence twice in a row in the same order as in the numerical sequence. The goal was to generate variable intervals between individual finger movements in the range of 1.3– 3.3 s during the entire block. Subjects were trained before the fMRI experiment to perform the 10 movements at an average frequency of ⬃0.5 Hz with a variability (defined as the SD/mean) of ⬃30%. In [ORDER], subjects were asked to press response buttons once in reverse order and once in the same order as in the numerical sequence so that serial order of movements had to be manipulated during the entire block. In this condition, timing of individual finger movements was always cued by a cross displayed on the screen for 300 ms at unpredictable intervals (between 1.3 and 3.3 s) at an average frequency of ⬃0.5 Hz (see above). [SI] and [VT] were similar to [TIMING] and [ORDER], respectively, with the exception that subjects were asked to reproduce either one of two prelearned sequences twice in a row in the same order as in the numerical sequence. Before scanning, all subjects received both written and oral instructions about the tasks. Strong emphasis was placed on accuracy. All participants were trained before the fMRI experiment outside and then inside the magnet to a minimal performance level of 90% in all four conditions. After the last fMRI session, 10 of 11 subjects were administered a debriefing about the four movement conditions. They were also asked to rate the level of difficulty of each movement condition on an analog scale ranging from 0 to 10. Visual stimuli were generated and subject responses were recorded by a personal computer using COGENT Cognitive interface software (COGENT 2000; Wellcome Department of Imaging Neuroscience, London, UK) implemented in Matlab 5.3 (MathWorks, Sherborn, MA). Behavioral data were subsequently analyzed using Matlab. Accuracy and total movement time (MT) defined as the time to perform the 10 button presses from the movement block onset were computed as indices of motor performance in all conditions. Moreover, the interval duration (ID) between two successive key presses was measured during [TIMING] and [SI], whereas response time (RT) defined as the time between the stimulus display and the button press was recorded during [ORDER] and [VT]. ID longer than 3500 ms or RT longer than 1300 ms were considered as omitted key presses. If subjects pressed the wrong key, the computer program registered an error. Both omitted and wrong key presses were excluded from the ID and RT data analysis. Behavioral data were compared across paired conditions ([TIMING] and [ORDER], [SI] and [VT]) using the Wilcoxon’s matched-pairs test. Significance level was set at p ⬍ 0.05. fMRI data acquisition. Imaging was performed on a whole-body 3.0 T GE Signa system (GE Medical Systems, Milwaukee, WI) equipped with gradients capable of 40 mT/m amplitude and 150 T 䡠 m ⫺1 䡠 s ⫺1 slew rate. Magnetic field inhomogeneity was reduced by using both linear and second-order shims. The time series began with dummy gradients and RF pulses corresponding to the first four images to allow brain tissue to reach steady-state magnetization. Twenty-two axial slices were acquired in an interleaved order from inferior to superior using a single-shot two-dimensional gradient-echo echo-planar imaging (EPI) sequence (slice thickness, 5 mm; slice gap, 1 mm; repetition time, 2.5 s; echo time,
5292 • J. Neurosci., June 1, 2005 • 25(22):5290 –5297
25 ms; flip angle, 90°; bandwidth, 62.5 kHz; matrix size, 64 ⫻ 64, yielding an in-plane resolution of 3.75 ⫻ 3.75 mm). Image processing. Off-line data processing and analysis were performed using the Statistical Parametric Mapping Software (SPM2; Wellcome Department of Imaging Neuroscience, London, UK; freely available at http://www.fil.ion.ucl.ac.uk/spm) implemented within Matlab 6. Image volumes were initially checked for gross artifacts and corrected for slice timing skew using temporal sinc interpolation. All images were then manually reoriented to grossly conform to the orientation of the interhemispheric fissure and intercommissural plane of the canonical EPI template image proposed as default in SPM2. The center point was approximately placed on the anterior commissure. Images within each time series were realigned to the first acquisition using rigid-body transformations and the most accurate function for realignment in SPM2. All EPI images were subsequently processed to examine results at the population level. The first EPI image of each time series was spatially normalized to the standard EPI template proposed as default in SPM2. This SPM template is in MNI space (Montreal Neurological Institute, http://www.bic. mni.mcgill.ca) and approximates the standard stereotaxic space of Talairach and Tournoux (1988). Linear and nonlinear deformation parameters estimated during this step were then subsequently applied to all other EPI volumes of the corresponding time series. Spatially normalized images were resliced to a final voxel size of 2 ⫻ 2 ⫻ 2 mm and smoothed using a 6 mm full-width at half-maximum Gaussian kernel. Image analysis. Realigned, spatially normalized, and smoothed T2*weighted time series were analyzed voxelwise using SPM2 in the framework of the General Linear Model (Friston et al., 1995). A first-level, session-specific analysis was initially performed to accommodate for within-subject, between-scan variability. In first-level analyses, fMRI time series were modeled using a canonical hemodynamic response function (HRF), the onset and duration of which were time locked to the eight movement blocks. For one subject (number 9505), the analysis of one fMRI session was limited to the first 6 min of acquisition because the behavioral data were corrupted during the last 2 min. All data were high-passed filtered with a cutoff frequency of 1⁄150 Hz to remove low-frequency signal drifts; a correction for temporal autocorrelation was applied. Contrast images were created to identify voxels showing a task-related increase in activity during the movement block. In the context of a random-effect model, in which a single measurement is obtained from each subject, individual contrast images from level-one analyses were entered in second-level analyses. This procedure appropriately accounts for possible subject-by-condition interactions and tests whether or not the population from which our set of subjects is drawn possesses the hypothesized effect (Penny and Holmes, 2003). As indicated in Introduction, imaging data analysis was performed according to a three-stage procedure. In the first stage, a second-level conjunction analysis (Nichols et al., 2005) was used to test for brain areas showing an increase in activity during both manipulation of timing ([TIMING] condition) and manipulation of order ([ORDER] condition). The statistical design thus included condition-specific individual contrast images from first-level analyses in the 11 subjects (22 images in total). Next, differences in brain activity between [TIMING] and [ORDER] were assessed (second stage). As fully described here in Materials and Methods, behavioral tasks during [TIMING] and [ORDER] were carefully designed to minimize any differences in brain activity unrelated to the experimental manipulation of interest: subjects did not have to manipulate timing during [ORDER] and vice versa. However, these experimental conditions also differed by mode of movement initiation, which would inevitably introduce a major confound in comparing the corresponding imaging data using a subtraction model (Jenkins et al., 2000). Therefore, differences in brain activity between [TIMING] and [ORDER] were assessed using a factorial design that included two other experimental conditions that mainly differed by mode of movement initiation: [SI] and [VT] conditions (Fig. 1). Contrary to [TIMING] and [ORDER] conditions, the cognitive demand in [SI] and [VT] conditions was low. Using a 2 ⫻ 2 factorial model [two factors, cognitive demand and mode of movement initiation, with two levels each (Fig. 2)], we could test for brain regions that were differentially activated during
Garraux et al. • Functional Connectivity in Movement Timing and Order
Figure 2. The experimental tasks were designed to allow analysis with a two-by-two factorial model, with cognitive load (i.e., manipulation) and mode of movement initiation as the two factors. Each factor has two possible levels. Using this model, it was possible to test for differential activity between manipulation of timing ([TIMING]) and manipulation of order ([ORDER]) over and above any difference in the mode of movement initiation between conditions.
[TIMING] and [ORDER] over and above any effect of difference in the mode of movement initiation between these conditions. For this purpose, individual contrast images from all 11 subjects and all four sessions were entered in the same statistical model (44 contrast images). Contrasts [TIMING ⫺ ORDER] ⫺ [SI ⫺ VT] and [ORDER ⫺ TIMING] ⫺ [VT ⫺ SI] were used to identify brain areas that are more strongly activated during manipulation of timing than order and order than timing, respectively. To minimize bias related to spurious effects attributable to multiple subtractions involved in these two contrasts, they were masked inclusively by [TIMING ⫺ ORDER] and [ORDER ⫺ TIMING] at p ⬍ 0.0001, respectively, and results were only reported for brain regions showing a main effect during [TIMING] or [ORDER]. In the third and final stage, task-dependent changes in functional connectivity between brain regions were assessed using a psychophysiological interaction (PPI) model (Friston et al., 1997). Results were then submitted to a conjunction analysis (Nichols et al., 2005) looking for brain areas, if any, that not only showed a common activation in both conditions (as tested in the first stage) but also had activity that was differentially coupled with that in brain areas identified in the second stage in a task-dependent manner. PPI analyses aim to explain regionally specific responses in terms of the interaction between the psychological variable and the activity in a specific index area. The analysis is constructed to test for the differences in the regression slope of activity in all areas, on the activity in the index area, under the two tasks. These regression slopes are a metric of coupling between the two areas. Therefore, the PPI identifies areas in which the degree of coupling with the index region is modulated significantly by the nature of the task (i.e., [ORDER] vs [TIMING]). The presence of a significant task-specific change in coupling between the index region and other brain areas can be interpreted in two distinct ways: either as a change in the influence of the index area on other brain regions or as a change in the responsiveness of the index area to inputs from other brain regions. Based on the results of the contrasts [TIMING ⫺ ORDER] ⫺ [SI ⫺ VT] and [ORDER ⫺ TIMING] ⫺ [VT ⫺ SI], two separate PPI analyses were conducted: one using right putamen and one using right posterior paramedian cerebellar cortex as index areas, respectively. Following the procedure proposed by Stephan et al. (2003), the mean corrected and high-passed-filtered time series in the two index areas were obtained on a subject-by-subject basis by extracting the first principal component from all voxel time series in a 5 mm radius sphere centered at the coordinates of the subject specific activations. The psychophysiological interaction term (referred to as “PPI regressor”) was computed as the element-by-element product of the deconvolved extracted time series and a vector coding for the main effect of task (i.e., 1 for [TIMING] and ⫺1 for [ORDER]) (Gitelman et al., 2003). The PPI regressor was mean corrected to remove subject-specific effects and convolved by the canon-
Garraux et al. • Functional Connectivity in Movement Timing and Order
J. Neurosci., June 1, 2005 • 25(22):5290 –5297 • 5293
Table 1. Mean group behavioral data Total MT ⫾ SD (s) Accuracy (%) RT ⫾ SD (milliseconds) Coefficient of variability ⫾ SD (%)
关TIMING兴
关ORDER兴
关SI兴
关VT兴
21.6 ⫾ 1.4 97.6
22.2 ⫾ 0.6 90.1 483 ⫾ 129
22.2 ⫾ 1.7 97.1
22 ⫾ 0.1 97.7 445 ⫾ 111
36 ⫾ 4
37 ⫾ 6
Anatomical labeling of activation peaks was performed with the aid of the atlas of Duvernoy (1999) and by reference to cerebellar atlases when appropriate (Schmahmann et al., 1999). This approach has obvious limitations, and the designation of the anatomic structures is tentative rather than definitive (Brett et al., 2002).
Results
Figure 3. Areas of common activation during both on-line manipulation of timing and serial order. Results are displayed on a standard rendered brain image at p ⬍ 0.05 corrected at the voxel level for multiple comparisons.
ical HRF to account for possible hemodynamic lag. For each subject, the PPI regressor, the task regressor, and the extracted time series were entered in a first-level model of functional connectivity in which the PPI regressor was orthogonalized with regard to the main effect of task and the regional time series. Altogether, the PPI analysis was specific for context-dependent striatal or cerebellar influences that occurred over and above any task effects and task-independent striatal or cerebellar influences. Brain areas receiving context-dependent striatal or cerebellar influences that were stronger during [TIMING] than [ORDER] were determined by testing for positive slopes of the PPI regressor, i.e., by applying a t-contrast that was 1 for the PPI regressor and 0 elsewhere. Conversely, brain areas receiving context-dependent striatal or cerebellar influences that were stronger during [ORDER] than [TIMING] were determined by testing for negative slopes of the PPI regressor, i.e., by applying a t-contrast that was ⫺1 for the PPI regressor and 0 elsewhere. Subject-specific contrast images from level-one PPI analyses were entered into a second-level random-effect model that also included individual contrast images from [TIMING] and [ORDER]. Thus, the model included 44 contrast images from 11 subjects. A second-level conjunction analysis (Nichols et al., 2005) was performed to test for brain areas with activity that increased during both tasks and that was preferentially coupled with activity in right putamen when [TIMING] was compared with [ORDER] and right posterior paramedian cerebellum when [ORDER] was compared with [TIMING]. Statistical inferences were made on second-level analyses only. Results were characterized in terms of the probability that the variation in magnitude value in intensity of a given voxel could occur by chance under the null hypothesis. Significance level in the SPMs{t} was set at p ⬍ 0.05, voxel-level corrected for multiple comparisons in all analyses (Genovese et al., 2002). A cluster size threshold of five voxels was always applied as an additional procedure for removing false-positive foci from the SPMs{t} (Forman et al., 1995), except in the conjunction analyses in which no inferences can be made on the spatial extent of activations.
Behavioral data Table 1 summarizes the behavioral data. No significant difference in total MT was observed between [TIMING] and [ORDER] ( p ⫽ 0.18). There was a trend for more incorrect ( p ⫽ 0.06) and omitted ( p ⫽ 0.09) key presses during [ORDER]. Although this resulted in a trend for less accuracy during [ORDER], it was not significant ( p ⫽ 0.08). Thus, [TIMING] and [ORDER] were matched in terms of motor performance as indexed by accuracy, number of individual finger movements performed, and total time to perform the entire series of action. When comparing [SI] and [VT] conditions, we found no significant difference in accuracy ( p ⫽ 0.85), MT ( p ⫽ 1), incorrect ( p ⫽ 1), and omitted ( p ⫽ 0.28) responses either. There was a trend for a difference in the subjective level of task difficulty between [TIMING] and [ORDER] as rated by the subjects after the last scanning session, but this did not reach statistical significance ( p ⫽ 0.09). In [TIMING], careful analysis of ID generated by the subjects showed some linear dependence between two successive IDs. The correlation coefficient between an ID and the previous one was, on average, ⫺0.27 ⫾ 0.12. This indicates that, to generate variable IDs, subjects took into account the previous ID to make a decision about the next one. IDs were further analyzed using the Visual Recurrence Analysis software freely available at http:// home.netcom.com/⬃eugenek/download.html. Visual analysis of individual recurrence plots showed that there was no evidence for a repetitive pattern in the intervals generated by the subjects beyond the linear dependence described above, suggesting that it is unlikely that subjects used a rhythmic pattern (i.e., melody) for generating the intervals. Imaging data Common areas of activation during [TIMING] and [ORDER] Brain areas showing a significant increase in activity during both [TIMING] and [ORDER] are presented in Figure 3. At the cortical level, the areas of common activation included the left primary sensorimotor cortex and parietal operculum, bilateral lateral and medial premotor and inferior parietal areas predominant on the left, including the supplementary (SMA) and presupplementary (pre-SMA) motor areas, anterior cingulate areas, and precuneus. Bilateral activation was also observed in both conditions in dorsolateral prefrontal cortex, intraparietal sulcus, supramarginal gyrus, and insular cortex. At the subcortical level, a common increase in activity was observed in bilateral thalami and lenticular nuclei, as well as in right cerebellar lobules IV/V and VI, left cerebellar lobule VI, and posterior vermis. Differential activity between [TIMING] and [ORDER] Brain regions with differential activity between [TIMING] and [ORDER] that occurred beyond that attributable to a difference in the mode of movement initiation between these conditions are presented in Figure 4, a and b, respectively. The only region that was more strongly activated during [TIMING] than during [ORDER] independently from a main effect of the mode of movement initiation (contrast [TIMING ⫺ ORDER] ⫺ [SI ⫺ VT]) was the right putamen (Z score ⫽ 4.05; p ⫽ 0.039, voxel-
Garraux et al. • Functional Connectivity in Movement Timing and Order
5294 • J. Neurosci., June 1, 2005 • 25(22):5290 –5297
Figure 4. Areas of the brain showing differential activity when [TIMING] and [ORDER] were compared using the two-by-two factorial design (Fig. 2). Activity in right putamen was stronger during [TIMING] than [ORDER] (a), whereas activity in right posterior cerebellar lobule VIIA was stronger during [ORDER] than [TIMING] (b). Results are displayed at p ⬍ 0.001, uncorrected, masked by the SPM{t} of the appropriate contrast between [TIMING] and [ORDER] ([TIMING ⫺ ORDER] or [ORDER ⫺ TIMING]), at p ⬍ 0.0001, uncorrected. The pseudocolor scales correspond to T values from the random effect analyses. Parameter estimates (90% confidence interval) showing mean ⫾ SE activation during each experimental condition clearly demonstrates that the differential activity in these subcortical areas was not dependent on differences in the mode of movement initiation between conditions. R, Right.
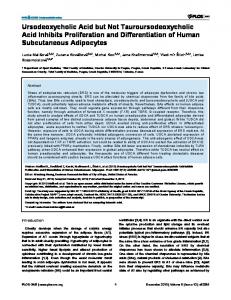
level corrected). In the contrast [ORDER ⫺ TIMING] ⫺ [VT ⫺ SI], activity in region located in the medial aspect of right posterior cerebellum was stronger in [ORDER] than in [TIMING], regardless of the mode of movement initiation (Z score ⫽ 4.22; p ⫽ 0.034, voxel-level corrected). More precisely, this region projects on the depth of the horizontal fissure and may correspond to lobules VIIA Crus IIm and VIIA Crus II l1 according to Schmahmann and colleagues (Schmahmann et al., 1999; Makris et al., 2003). A trend toward significance was observed in the upper part of the left precentral sulcus (left dorsal premotor cortex) and in the left inferior occipito-temporal junction area, but these results will not be discussed because they did not reach the specified statistical threshold. Functional connectivity analyses A PPI from a representative subject is shown in Figure 5. The activity in the right middle frontal gyrus (MFG) was preferentially coupled with activity in right putamen during [TIMING] than during [ORDER] and with right posterior cerebellum during [ORDER] than during [TIMING]. Some other areas that were commonly activated during both tasks (Fig. 3) showed the same pattern. This was formally assessed in our population using a second-level conjunction analysis (Table 2). At the cortical level, this associative network included pre-SMA, bilateral lateral premotor and dorsolateral prefrontal cortices, intraparietal sulcus, supramarginal gyrus, anterior cingulate area, and insular cortex. At the subcortical level, the analysis showed a significant result in left thalamus, right dentate nucleus, and right lateral cerebellar lobule VI.
Figure 5. Results of the PPI analyses from a representative subject (number 1586). Black circles, Measurements during manipulation of timing; red triangles, measurements during manipulation of order. btiming and border are the condition-specific regression slopes. Mean corrected activity (in arbitrary units) in the right MFG, which was activated during both conditions (Fig. 3), is displayed as a function of mean corrected activity in right putamen (A) and right posterior cerebellum (B). A, Activity in right MFG (voxel coordinates of subject 1586: x, y, z ⫽ 46, 42, 20) was more tightly coupled with activity in right putamen than right posterior cerebellum when manipulation of timing was compared with manipulation of order. The difference between the regression slopes constitutes the PPI ( p ⬍ 0.001; T ⫽ 4.05). B, Mean corrected activity in right MFG (voxel coordinates of subject 1586, x, y, z ⫽ 46, 44, 18) is displayed as a function of mean corrected activity in right posterior cerebellum. This PPI was significant at p ⬍ 0.001 (T ⫽ 3.67).
Discussion Indirect evidence suggests that neural systems controlling two fundamental dimensions defining a motor sequence (order of movements and intervals separating them) with respect to a given goal are closely related. This was directly addressed in the present functional imaging study. The first result provides strong evidence supporting the existence of brain areas of common activation across tasks, including bilateral subcortico-parieto-frontal associative regions. The large overlap in the functional maps for these different behavioral tasks contrasted with the second finding that only two subcortical subregions show a task-specific increase in activity: right putamen and right posterior cerebellar lobule VIIA. The third set of analyses demonstrates that activity in the shared associative regions is preferentially coupled with that in the putaminal site during manipulation of timing and the cerebellar site during manipulation of serial order. This last finding is important because it provides evidence for an efficient organization of the brain during cognitive control of motor sequences and supports a recently proposed principle according to which the role of brain regions involved in different behavioral tasks without differential alterations in their measured activity depends on changes in their interactions with other connected areas as a function of the tasks.
Garraux et al. • Functional Connectivity in Movement Timing and Order
J. Neurosci., June 1, 2005 • 25(22):5290 –5297 • 5295
and order of movements. The nature of the tasks used here might explain the apparent discrepancy with the classical view x y z that links the control of timing and serial Left cortical areas order of muscle groups (i.e., low-level asSuperior frontal sulcus, PMd ⫺30 ⫺4 60 3.37 pects of movements) participating in a Precentral sulcus, PMd ⫺30 ⫺4 48 4.28 motor action with cerebellar (Hallett et al., Precentral gyrus, PMv ⫺58 10 10 3.74 1975; Ivry et al., 1988) and striatal (MarsInferior frontal gyrus (pars opercularis) ⫺46 8 8 3.91 Middle frontal gyrus, DLPFC ⫺34 44 12 3.78 den and Obeso, 1994; Aldridge and BerInsular cortex ⫺38 16 0 3.87 ridge, 1998) activity, respectively. Inferior parietal lobe (anterior part) ⫺58 ⫺24 44 3.90 Following current theories in neurobiSupramarginal gyrus ⫺46 ⫺34 38 3.93 ology (McIntosh et al., 2001), we tested Intraparietal sulcus ⫺40 ⫺48 40 4.41 next whether or not areas showing a simiRight cortical areas lar increase in activity during both condiSuperior frontal sulcus, PMd 18 6 56 3.40 tions differentially interacted with putaMiddle frontal gyrus, DLPFC 42 48 14 3.41 Insular cortex 40 14 0 3.54 men or cerebellum as a function of the Inferior parietal lobe (anterior part) 50 ⫺24 36 3.41 tasks. Among all commonly activated arSupramarginal gyrus 50 ⫺34 40 3.96 eas (Fig. 3), the results mainly demonIntraparietal sulcus 38 ⫺54 44 3.37 strated that activity in those known to play Midline cortical areas a role in cognition was more strongly couPre-SMA 2 8 60 3.58 pled with activity in right putamen during Anterior cingulate sulcus (L) ⫺10 10 46 3.79 Anterior cingulate sulcus (R) 8 12 44 3.40 manipulation of timing and with activity Anterior cingulate gyrus (R) 8 20 46 3.28 in right posterior cerebellum during maSubcortical areas nipulation of serial order (Fig. 5a,b, Table Left thalamus ⫺16 ⫺12 6 3.40 2). We cannot exclude the possibility that Right cerebellum: dentate nucleus 18 ⫺54 ⫺32 3.43 task-dependent interactions occurred beRight cerebellum: lobule VI 32 ⫺66 ⫺42 3.20 tween other areas that showed an increase PMd, Dorsal lateral premotor cortex; PMv, ventral lateral premotor cortex; DLPFC, dorsal lateral prefrontal cortex; L, left; R, right. in activity during both conditions, but this a Coordinates (in millimeters) of peaks in MNI space are given for information. Anatomic localization was performed with the aid of the atlas by Duvernoy was not tested here. Anatomical studies in (1999) (see Materials and Methods). nonhuman primates demonstrated that putamen and neocerebellum are both exIn both manipulation of timing and serial order of a given tensively connected, through the thalamus, with associative areas series of movements during performance, increased BOLD activof the brain crucial for cognition, such as the middle frontal gyrus ity was detected in common subcortico-cortical circuits (Fig. 3), and parietal cortex (Middleton and Strick, 2000). Therefore, the encompassing areas known to play a role in motor sequence coneffect we have shown in terms of functional connectivity might be trol, such as contralateral S1M1, SMA, basal ganglia, and ipsilatan indirect one, using intermediate areas as relay stations. eral cerebellar lobules VI/V (Jenkins et al., 2000; Garraux et al., The preferential interaction between these two subcortical 2005), as well as associative regions that are critical for cognitive subregions and associative rather than motor areas as a function functions, such as bilateral parieto-frontal cortices, pre-SMA, of the tasks provides additional evidence supporting their role in and cerebellar lobule VI (Desmond et al., 1997; Collette and Van high-level control of movement timing and order. A role of puder Linden, 2002; Wager and Smith, 2003), consistent with the tamen for cognitive control of timing was previously suggested fact that both conditions engaged concomitant motor and cogbased on animal (Matell et al., 2003) and human experiments in nitive processes. The large extent of commonly activated associanormal individuals (Hinton, 2003) and Parkinson’s disease pative brain regions indicates that an important proportion of availtients (Malapani et al., 2002). A right lateralization for this funcable cognitive resources needs to be engaged to reach a high level tion agrees with converging focal lesion (Harrington et al., 1998), of performance in these tasks. electrophysiological (Koch et al., 2003), and functional (Hinton, We investigated next whether or not any brain region showed 2003) imaging studies in humans. Previously, the posterior cerea task-specific increase in activity. Differences were restricted to bellum has been linked to high-order functions in humans (Destwo subcortical structures. Activity in right putamen correlated mond et al., 1997; Schmahmann and Sherman, 1998). Both psymore strongly with manipulation of timing, whereas a region chophysical experiments in patient groups as well as functional located in the right posterior paramedian cerebellar lobule VIIA imaging studies have provided some evidence to support a role (Schmahmann et al., 1999; Makris et al., 2003) showed stronger for cerebello-cortical circuits in tasks in which high-level control activity during manipulation of order. Because tasks were perof serial order is critical (Pascual-Leone et al., 1993; Dagher et al., fectly matched in terms of stimulus and response characteristics, 1999). The reasons for a role of right but not left cerebellum this differential activity cannot be ascribed to differences in either remain hypothetical, but this is consistent with results from some basic perceptual or motor processes. Likewise, any potential bias lesion (Gottwald et al., 2004), electrophysiological (Torriero et regarding subjects’ performance and the subjective level of task al., 2004), and functional imaging (Desmond et al., 1997) experdifficulty can be excluded (Table 1). Moreover, our factorial deiments in humans, which have shown an involvement of right sign allowed minimizing any confounding effects of pure insercerebellum in cognitively demanding tasks. tion (Friston et al., 1996), as well as differences in the mode of The associative areas that show task-dependent differences in movement initiation between conditions (Fig. 4a,b). This differfunctional connectivity with right putamen and right posterior ential activity is thus more likely linked to high-level cognitive cerebellum have been involved in several cognitive processes that processes involved in the internally guided decision about timing are engaged by our tasks, including those participating in workTable 2. Results of the functional connectivity analyses Coordinatesa
Z score
5296 • J. Neurosci., June 1, 2005 • 25(22):5290 –5297
ing memory and executive control (Collette and Van der Linden, 2002; Wager and Smith, 2003; Heyder et al., 2004), representation of time and serial order in memory (Petrides, 1991; Marshuetz et al., 2000; Rao et al., 2001; Brody et al., 2003), as well as attention to timing and spatial stimuli (Coull and Nobre, 1998). We speculate that the two subcortical structures both assist information processing in these associative areas in different ways dictated by the nature of the internally guided decision about which movement to perform next in the sequence and when in accord to the goal. It is likely that the decision about which movement to perform next during manipulation of serial order relied on a predictive model based on the contextual information about which movement was performed last as well as target serial order stored in memory (Dominey, 1998). Current theories suggest that the cerebellum might be a good candidate to provide such an internal model (Wolpert and Kawato, 1998). Conversely, no prediction was required during manipulation of timing. Our behavioral data rather suggest that the subjects’ decision about when to perform the next movement relied on the comparison between the stored representation of the last interval and elapsed time since the last movement was performed. This process is reminiscent of that involved in the influential scalar timing model, which posits that representation of elapsed time entails a counterclockwise mechanism (Meck and Benson, 2002). In this model, basal ganglia have been hypothesized to have a role in providing accurate information about elapsed time. Results obtained in our and some previous functional imaging studies (McIntosh et al., 2003) provide some evidence supporting the relevance of the neuronal context (see Introduction) in determining the role of a brain region that shows a similar increase of activity in different behaviors. In their electrophysiological studies in monkeys, Bressler and Kelso (2001) demonstrated that, at the systems level, a brain region might show similar activity patterns across tasks yet be part of different coordinated networks, thereby subserving different behavioral outcomes. These authors proposed that switching functional interactions to different coordinated networks would provide a flexibility that allows a rapid transition from a cognitive process to another one. In the present study, one can speculate that anatomical connections between associative cortical areas and both right putamen and right cerebellum through basal ganglia- and cerebello-cortical loops, respectively (Middleton and Strick, 2000), may enable transitions to timing- and order-related operations by coupling their activity with that in right putamen or cerebellum. Although not directly investigated in the present study, this mechanism would account for the fact that both dimensions can be combined flexibly during action sequencing. In conclusion, the finding that, at the neuronal level, difference between cognitive control of movement timing and order was mainly mediated by differences in functional interaction between activated brain regions rather than differences in regional activity indicates that the ability to change motor strategies during action sequencing relies on an efficient organization of brain. Importantly, the results of this experiment support the principle according to which a region can participate in different behaviors through variations in its interactions with other areas.
References Aldridge JW, Berridge KC (1998) Coding of serial order by neostriatal neurons: a “natural action” approach to movement sequence. J Neurosci 18:2777–2787. Bengtsson SL, Ehrsson HH, Forssberg H, Ullen F (2004) Dissociating brain regions controlling the temporal and ordinal structure of learned movement sequences. Eur J Neurosci 19:2591–2602.
Garraux et al. • Functional Connectivity in Movement Timing and Order Bressler SL, Kelso JA (2001) Cortical coordination dynamics and cognition. Trends Cogn Sci 5:26 –36. Brett M, Johnsrude IS, Owen AM (2002) The problem of functional localization in the human brain. Nat Rev Neurosci 3:243–249. Brody CD, Hernandez A, Zainos A, Romo R (2003) Timing and neural encoding of somatosensory parametric working memory in macaque prefrontal cortex. Cereb Cortex 13:1196 –1207. Collette F, Van der Linden M (2002) Brain imaging of the central executive component of working memory. Neurosci Biobehav Rev 26:105–125. Coull JT, Nobre AC (1998) Where and when to pay attention: the neural systems for directing attention to spatial locations and to time intervals as revealed by both PET and fMRI. J Neurosci 18:7426 –7435. Dagher A, Owen AM, Boecker H, Brooks DJ (1999) Mapping the network for planning: a correlational PET activation study with the Tower of London task. Brain 122:1973–1987. Desmond JE, Gabrieli JD, Wagner AD, Ginier BL, Glover GH (1997) Lobular patterns of cerebellar activation in verbal working-memory and finger-tapping tasks as revealed by functional MRI. J Neurosci 17:9675–9685. Dominey PF (1998) A shared system for learning serial and temporal structure of sensori-motor sequences? Evidence from simulation and human experiments. Brain Res Cogn Brain Res 6:163–172. Duvernoy HM (1999) The human brain. Surface, blood supply, and three dimensional sectional anatomy. Ed 2. New York: Springer. Forman SD, Cohen JD, Fitzgerald M, Eddy WF, Mintun MA, Noll DC (1995) Improved assessment of significant activation in functional magnetic resonance imaging (fMRI): use of a cluster-size threshold. Magn Reson Med 33:636 – 647. Friston KJ, Holmes AP, Worsley KJ, Poline JB, Frith CD, Frackowiak RSJ (1995) Statistical parametric maps in functional imaging: a general linear approach. Hum Brain Mapp 2:189 –210. Friston KJ, Price CJ, Fletcher P, Moore C, Frackowiak RSJ, Dolan RJ (1996) The trouble with cognitive subtraction. NeuroImage 4:97–104. Friston KJ, Buechel C, Fink GR, Morris J, Rolls E, Dolan RJ (1997) Psychophysiological and modulatory interactions in neuroimaging. NeuroImage 6:218 –229. Garraux G, Hallett M, Talagala SL (2005) CASL fMRI of subcortico-cortical perfusion changes during memory-guided finger sequences. NeuroImage 25:122–132. Genovese CR, Lazar NA, Nichols T (2002) Thresholding of statistical maps in functional neuroimaging using the false discovery rate. NeuroImage 15:870 – 878. Gitelman DR, Penny WD, Ashburner J, Friston KJ (2003) Modeling regional and psychophysiologic interactions in fMRI: the importance of hemodynamic deconvolution. NeuroImage 19:200 –207. Gottwald B, Wilde B, Mihajlovic Z, Mehdorn HM (2004) Evidence for distinct cognitive deficits after focal cerebellar lesions. J Neurol Neurosurg Psychiatry 75:1524 –1531. Hallett M, Shahani BT, Young RR (1975) EMG analysis of patients with cerebellar deficits. J Neurol Neurosurg Psychiatry 38:1163–1169. Harrington DL, Haaland KY, Knight RT (1998) Cortical networks underlying mechanisms of time perception. J Neurosci 18:1085–1095. Heyder K, Suchan B, Daum I (2004) Cortico-subcortical contributions to executive control. Acta Psychol (Amst) 115:271–289. Hinton SC (2003) Neuroimaging approaches of the study of interval timing. In: Functional and neural mechanisms of interval timing (Meck WH, ed), pp 419 – 438. Boca Raton, FL: CRC. Ivry RB, Keele SW, Diener HC (1988) Dissociation of the lateral and medial cerebellum in movement timing and movement execution. Exp Brain Res 73:167–180. Jenkins IH, Jahanshahi M, Jueptner M, Passingham RE, Brooks DJ (2000) Self-initiated versus externally triggered movements. II. The effects of movement predictability on regional cerebral blood flow. Brain 123:1216 –1228. Keele SW (1987) Sequencing and timing in skilled perception and action: an overview. In: Language perception and production (Allport A, MacKay DG, Prinz W, Scheerer E, eds), pp 463– 487. New York: Academic. Koch G, Oliveri M, Torriero S, Caltagirone C (2003) Underestimation of time perception after repetitive transcranial magnetic stimulation. Neurology 60:1844 –1846. Makris N, Hodge SM, Haselgrove C, Kennedy DN, Dale A, Fischl B, Rosen BR, Harris G, Caviness Jr VS, Schmahmann JD (2003) Human cerebel-
Garraux et al. • Functional Connectivity in Movement Timing and Order lum: surface-assisted cortical parcellation and volumetry with magnetic resonance imaging. J Cogn Neurosci 15:584 –599. Malapani C, Deweer B, Gibbon J (2002) Separating storage from retrieval dysfunction of temporal memory in Parkinson’s disease. J Cogn Neurosci 14:311–322. Marsden CD, Obeso JA (1994) The functions of the basal ganglia and the paradox of stereotaxic surgery in Parkinson’s disease. Brain 117:877– 897. Marshuetz C, Smith EE, Jonides J, DeGutis J, Chenevert TL (2000) Order information in working memory: fMRI evidence for parietal and prefrontal mechanisms. J Cogn Neurosci 12 [Suppl 2]:130 –144. Matell MS, Meck WH, Nicolelis MA (2003) Interval timing and the encoding of signal duration by ensembles of cortical and striatal neurons. Behav Neurosci 117:760 –773. McIntosh AR, Fitzpatrick SM, Friston KJ (2001) On the marriage of cognition and neuroscience. NeuroImage 14:1231–1237. McIntosh AR, Rajah MN, Lobaugh NJ (2003) Functional connectivity of the medial temporal lobe relates to learning and awareness. J Neurosci 23:6520 – 6528. Meck WH, Benson AM (2002) Dissecting the brain’s internal clock: how frontal-striatal circuitry keeps time and shifts attention. Brain Cogn 48:195–211. Middleton FA, Strick PL (2000) Basal ganglia and cerebellar loops: motor and cognitive circuits. Brain Res Rev 31:236 –250. Nichols T, Brett M, Andersson J, Wager T, Poline JB (2005) Valid conjunction inference with the minimum statistic. NeuroImage 25:653– 660. Oldfield RC (1970) The assessment and analysis of handedness: the Edinburgh inventory. Neuropsychologia 9:97–113. Pascual-Leone A, Grafman J, Clark K, Stewart M, Massaquoi S, Lou JS, Hallett M (1993) Procedural learning in Parkinson’s disease and cerebellar degeneration. Ann Neurol 34:594 – 602. Penny WD, Holmes AP (2003) Random effect analysis. In: Human brain
J. Neurosci., June 1, 2005 • 25(22):5290 –5297 • 5297 function (Frackowiak RSJ, Friston KJ, Frith CD, Dolan R, Price CJ, Zeki S, Ashburner J, Penny WD, eds), pp 843– 850. New York: Academic. Petrides M (1991) Functional specialization within the dorsolateral frontal cortex for serial order memory. Proc R Soc Lond B Biol Sci 246:299 –306. Rao SM, Mayer AR, Harrington DL (2001) The evolution of brain activation during temporal processing. Nat Neurosci 4:317–323. Sakai K, Ramnani N, Passingham RE (2002) Learning of sequences of finger movements and timing: frontal lobe and action-oriented representation. J Neurophysiol 88:2035–2046. Schmahmann JD, Sherman JC (1998) The cerebellar cognitive affective syndrome. Brain 121:561–579. Schmahmann JD, Doyon J, McDonald D, Holmes C, Lavoie K, Hurwitz AS, Kabani N, Toga A, Evans A, Petrides M (1999) Three-dimensional MRI atlas of the human cerebellum in proportional stereotaxic space. NeuroImage 10:233–260. Schubotz RI, von Cramon DY (2001) Interval and ordinal properties of sequences are associated with distinct premotor areas. Cereb Cortex 11:210 –222. Stephan KE, Marshall JC, Friston KJ, Rowe JB, Ritzl A, Zilles K, Fink GR (2003) Lateralized cognitive processes and lateralized task control in the human brain. Science 301:384 –386. Talairach J, Tournoux P (1988) Coplanar stereotaxic atlas of the human brain. 3-Dimensional proportional system: an approach to cerebral imaging. Stuttgart, Germany: Thieme Medical. Torriero S, Oliveri M, Koch G, Caltagirone C, Petrosini L (2004) Interference of left and right cerebellar rTMS with procedural Learning. J Cogn Neurosci 16:1605–1611. Wager TD, Smith EE (2003) Neuroimaging studies of working memory: a meta-analysis. Cogn Affect Behav Neurosci 3:255–274. Wolpert DM, Kawato M (1998) Multiple paired forward and inverse models for motor control. Neural Netw 11:1317–1329.