Journal of Experimental Psychology: Human Perception and Performance 2006, Vol. 32, No. 5, 1197–1207
Copyright 2006 by the American Psychological Association 0096-1523/06/$12.00 DOI: 10.1037/0096-1523.32.5.1197
Shared Spatial Representations for Numbers and Space: The Reversal of the SNARC and the Simon Effects Wim Notebaert, Wim Gevers, Tom Verguts, and Wim Fias Ghent University In 4 experiments, the authors investigated the reversal of spatial congruency effects when participants concurrently practiced incompatible mapping rules (J. G. Marble & R. W. Proctor, 2000). The authors observed an effect of an explicit spatially incompatible mapping rule on the way numerical information was associated with spatial responses. The authors also observed an effect of an incompatible numerical mapping rule (if smaller than 5, press right; if larger than 5, press left) on the Simon effect. This effect was observed only when both tasks used the same effectors. The results point to a shared spatial representation for explicit spatial information (locations) and implicit spatial information (numbers). Keywords: spatial congruency effects, Simon effect, SNARC effect
is true for responses with the left response key, where small numbers (2 and 4) are faster than large numbers (6 and 8). The SNARC effect demonstrates that mental representations of numbers are associated with spatial information and follow the properties of a mental number line representation oriented from left to right. Relatively small numbers are associated with left responses, and relatively large numbers are associated with right responses. During parity judgment, one could argue that magnitude information is not required for the task but that it is nevertheless necessary to activate magnitude information in order to access parity information. However, the SNARC effect is also observed when participants have to perform a task that does not require magnitude information for correct task performance, a task where the presented number is totally irrelevant for the task at hand. For instance, in studies where participants had to press a left or right response button in response to the orientation of a centrally presented number, small numbers were preferentially responded to with the left hand and large numbers with the right hand (Fias, Lauwereyns, & Lammertyn, 2001; Lammertyn, Fias, & Lauwereyns, 2002). This confirms that the SNARC effect is observed when magnitude information is completely irrelevant. The Simon and the SNARC effects can both be explained in terms of dual route models (e.g., De Jong, Liang, & Lauber, 1994; Kornblum, Hasbroucq, & Osman, 1990). There is a conditional route that processes the relevant information and an unconditional route that processes the irrelevant information. The unconditional route is faster than the conditional route, and consequently, a response is primed by the irrelevant information. When the slower conditional route activates the same response (congruent trial), a fast response occurs. Slow RTs are observed if the conditional route points toward the alternative response (incongruent trial). Recently, a computational model explicitly implementing a dual route architecture provided a detailed account for a variety of characteristics associated with the SNARC effect (Gevers, Verguts, Reynvoet, Caessens, & Fias, 2006). There is also electrophysiological support for this dual route interpretation. It has been demonstrated that the SNARC effect bears an electrophysiological signature that corresponds to the one observed for the
Although in general people are good at selecting the appropriate information for a set of goals, several experimental designs have revealed that motor actions can be triggered by information that is not relevant for the task at hand. It seems particularly difficult to ignore spatial information (Simon, 1990; for a recent overview, see Caessens, Notebaert, Burle, & Soetens, 2005). In a Simon task for instance, participants have to respond to the color of a stimulus with a left or right response key. Stimuli are randomly presented to the left or right of the fixation cross, but only the color of the stimulus is relevant, and the location of the stimulus should be ignored. Results typically show that reaction times (RTs) are faster when the irrelevant stimulus location corresponds with the response location than when these locations do not correspond (Simon, 1969). The Simon effect consequently demonstrates that the spatial location of a stimulus cannot be ignored and, moreover, that response priming can occur on the basis of this irrelevant information. Spatial congruency effects occur not only for explicit locations but also for representational space. A fascinating example of such an implicit spatial congruency effect is the SNARC (spatial numerical association of response codes) effect obtained with number stimuli (Dehaene, Bossini, & Giraux, 1993; Dehaene, Dupoux, & Mehler, 1990; for overviews, see Fias & Fischer, 2005; Gevers & Lammertyn, 2005). When participants perform a parity judgment task (for an odd number, press right, and for an even number, press left), the responses on the right are usually faster for large numbers (7 and 9) than for small numbers (1 and 3). The reverse
Wim Notebaert, Wim Gevers, Tom Verguts, and Wim Fias, Department of Experimental Psychology, Ghent University, Ghent, Belgium. We thank Jan De Houwer for discussing initial data and ideas and Robert Proctor for his helpful comments on a previous version. This research was sponsored by Grant P5/04 from Interuniversity Attraction Poles. Correspondence concerning this article should be addressed to Wim Notebaert, Experimentele Psychologie, Henri Dunantlaan 2, 9000, Ghent, Belgium. E-mail:
[email protected] 1197
NOTEBAERT, GEVERS, VERGUTS, AND FIAS
1198
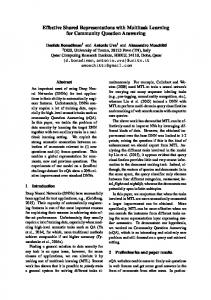
Simon effect (Gevers, Ratinckx, De Baene, & Fias, 2006; Keus & Schwarz, 2005). The similarity between the Simon effect and the SNARC effect goes beyond this dual route model, in the sense that the irrelevant information that is processed in the unconditional route is spatial in both cases. Thus, the response priming that occurs in both cases is triggered by spatial information, or both congruency effects are caused by preexisting space-to-response associations. In this study, we investigated whether there is a common spatial representation for the spatial information associated with numbers and the spatial information activated by physical locations. Figure 1 presents three possible architectures that associate locations (space) and numbers (magnitude) with spatial responses. In Figure 1a, there is a direct association from both types of spatial information (bottom) to the spatial responses (top). The spatial responses are implemented as left-hand and right-hand responses. This type of architecture is implemented in the SNARC model by Gevers, Verguts, et al. (2006). A similar architecture is also implicitly assumed in the dimensional overlap model by Kornblum et al. (1990). Figure 1b presents an architecture where a common spatial code is activated by the two types of information. This intermediate representation is then associated with spatial responses. In Figure 1c, an architecture is presented where both numbers and locations activate a distinct intermediate spatial code that in turn activates the spatial responses. Several authors have assumed an architecture like that shown in Figure 1b (e.g., Hubbard, Piazza, Pinel, & Dehaene, 2005; Walsh, 2003). However, the evidence in favor of this architecture is not conclusive. First, the existence of the SNARC effect demonstrates that magnitude information provided by numbers is associated with spatial responses. The mere existence of the SNARC effect, however, does not imply that a similar spatial representation is activated by numerical magnitude and physical space. Indeed, it is possible that the spatial information associated to numbers bears
a. No intermediate representations Lh
l
r Space
b. Intermediate shared representations
Rh
5
Magnitude
no similarity to the way in which physical spatial information is mentally coded. Moreover, there is in fact an important difference between the SNARC effect and the Simon effect that argues in favor of distinctive representations. Whereas the traditional horizontal Simon effect decreases as the RTs increase, the SNARC effect increases (Gevers, Caessens, & Fias, 2005; Mapelli, Rusconi, & Umilta`, 2003). The decreasing Simon effect with longer response latencies is usually explained in terms of decay of the irrelevant information (Hommel, 1993a; but see Ridderinkhof, 2002; Ridderinkhof, van den Wildenberg, Wijnen, & Burle, 2004). This differential time course suggests that the spatial codes associated with both effects are of a different nature (Mapelli et al., 2003). The different time course was also crucial when the interaction between the Simon effect and the SNARC effect was investigated. Mapelli et al. (2003) followed the additive factors method (Sternberg, 1969) and argued that if Simon and SNARC derive from the same mechanism, they should interact with each other (in a situation where numbers are presented to the left or to the right). Given that they did not observe an interaction between Simon and SNARC congruency, they concluded that both effects have a different origin. Recently, however, Gevers, Caessens, and Fias (2005; see also Keus & Schwarz, 2005), argued and demonstrated empirically that the different time course of both effects is a mediating factor in this missing interaction. Temporal differences suggest, but certainly do not imply, an interpretation in line with Figure 1a or Figure 1c. Similarly, Proctor, Marble, and Vu (2000) proposed a dissociated architecture in line with Figure 1c for verbal spatial information provided by the words LEFT and RIGHT and physical spatial information provided by locations. A second observation that has been taken as evidence in support of shared spatial representations comes from hemineglect patients. Zorzi, Priftis, and Umilta` (2002) demonstrated that hemineglect patients show a bias not only in bisecting lines (Marshall & Halligan, 1989), but also in a number bisection task. Patients
l
Lh
Rh
L
R
r Space
5
Magnitude
c. Intermediate separate representations Lh
Rh
L
R
L
l
r
5
Magnitude
Figure 1. Three different architectures for spatial response associations for space and numbers (magnitude) are presented. The bottom layer represents the input. In space, a stimulus can be presented on the left (l) or right (r) side of fixation. Magnitude information is presented as smaller (⬍5) or larger (⬎5) than a given referent (i.e., 5). In Figure 1a, a direct association between the input layer and the response layer is assumed. For instance, there is a direct association between a relatively small number (⬍5) and the left hand (Lh). In Figure 1b, an intermediate layer (L and R) is assumed where both types of information (space and magnitude) converge. In Figure 1c, an architecture is proposed where both types of information activate separate intermediate spatial representations. Rh ⫽ right hand.
SNARC AND SIMON REVERSAL
neglecting the left visual space typically bisected a line at a position to the right of the objective midpoint. Similarly, when asked for the number in the middle between two numbers (e.g., 11 and 19) they exhibited a similar rightward bias (in this example, 17). This suggests that physical space and number space are associated in one way or another, but this does not indicate a shared spatial representation per se. Moreover, Doricchi, Guariglia, Gasparini, and Tomaiuolo (2005) recently reported a double dissociation between physical and number line bisection, making it even more difficult to interpret the results from hemineglect studies. An interpretation for the overall pattern is that there are shared mechanisms involved in attentional shifting in number and physical space. Finally, fMRI results have also been taken as support for a shared representation for numbers and space (Walsh, 2003). Dehaene, Piazza, Pinel, and Cohen (2003) reviewed fMRI experiments that had demonstrated activation in the posterior superior parietal lobe for both numerical and visuospatial tasks. As with the interpretation of the hemineglect data, it is not clear whether these shared parietal circuits derive from overlapping spatial representations or from shared supporting attentional mechanisms, with the latter being suggested by Dehaene et al. (2003). In summary, although it has been suggested that there are shared spatial representations for numbers and space (Figure 1b), no strong and direct empirical evidence supports this claim. In the present study, we used a paradigm that was introduced by Proctor et al. (2000) to investigate this issue. The core of the paradigm is to change associations from spatial representations to spatial responses by practicing spatially incompatible mapping rules. Several studies demonstrated that the Simon effect reversed (faster incongruent than congruent responses) when participants practiced an incompatible mapping rule in a location-relevant task (pressed left when the stimulus was presented on the right and vice versa). Proctor and Lu (1999) demonstrated that the Simon effect reversed after 1,800 incompatible location-relevant practice trials. Tagliabue, Zorzi, Umilta`, and Bassignani (2000) observed a reversal after practicing only 72 incompatible trials. Marble and Proctor (2000) mixed trials where the stimulus location was relevant with trials where the location was irrelevant and also found a reversal. Proctor et al. used this paradigm to investigate the relationship between different kinds of spatial information. They observed that the traditional horizontal Simon effect was not reversed by incompatible mapping rules of spatial words or arrows. They concluded that there is no support for shared spatial representations activated by locations, arrows, and spatial words. Indeed, when two types of spatial information activate a common spatial representation, changing the associations from this shared representation to the responses should affect both types of information. We used this paradigm to investigate the spatial representations involved in the Simon and the SNARC effects. This paradigm typically uses an inducer task to change the response associations and uses a diagnostic task to assess the response associations. In Experiment 1, we replicated the basic paradigm in a numerical context. We investigated the influence of incompatible mappings in the magnitude comparison task (if a number is smaller than 5, press right; if it is larger than 5, press left) on a concurrent SNARC task (orientation judgment) in which numerical information was completely irrelevant (if number is tilted, press left; if it is upright, press right). To exclude stimulus-specific effects, we used differ-
1199
ent numbers in the inducer task (magnitude comparison) and the diagnostic task (orientation judgment). In Experiment 2, we imposed spatially incompatible mappings in a spatial compatibility task (press left if a stimulus is presented on the right and vice versa) and investigated whether the new explicit location-toresponse mappings also affected the spatial numerical response associations. A reversal of the SNARC effect can be explained only in terms of an architecture with shared spatial representations (Figure 1b). In Experiment 3, we investigated the reversal of the Simon effect by the concurrent use of numerical incompatible mapping rules. In Experiment 4, we investigated the specific associations that are responsible for this reversal by means of dissociating the response modalities (hand vs. feet) in the inducer and the diagnostic task.
Experiment 1 In our first experiment, participants switched between a magnitude comparison and an orientation judgment task. We started from Marble and Proctor’s (2000) approach by randomly intermixing two types of trials (see also, Proctor & Vu, 2002). When the presented number was black, participants had to respond to the magnitude (smaller or larger than 5); when the presented number was red, participants had to respond to the orientation. In the orientation task, participants had to press one response key when the number was presented upright and another when the number was tilted. Following Fias et al. (2001), we chose an orientation task rather than a parity task, so that every number was mapped on both responses in the orientation task (each number received left and right responses depending on whether it was tilted). This made it possible to calculate the SNARC effect in one session and to assess the influence of the mapping rule from the magnitude task on the SNARC effect in the orientation task. In the compatible magnitude task, we expected a regular SNARC effect in the concurrent orientation task, whereas we expected a reversed SNARC effect in the incompatible magnitude task. In Marble and Proctor’s (2000) study, the stimuli in the locationrelevant and the location-irrelevant trials (the Simon task) were located left or right. The fact that the Simon effect reversed when participants had to respond incompatibly on location-relevant trials can be explained by assuming that during the location-relevant trials, new connections were created between the two spatial locations (left and right) and the two responses. If such a stimulusspecific mechanism underlies the Simon reversal, then the Simon reversal boils down to a response-priming phenomenon. To exclude this priming-based, stimulus-specific reversal, we used different numbers in the inducer task (magnitude) and in the diagnostic task (orientation).
Method Participants. Forty undergraduate students (18 to 23 years old; 27 women and 13 men) at Ghent University participated in return for course credits. All had normal or corrected-to-normal vision and were naive to the purpose of the study. Each participated in a single 15-min session. Apparatus and stimuli. Stimuli were presented on Pentium computers using E-prime software (Schneider, Eschman, & Zuccolotto, 2002a, 2002b) and a response box. The numbers were 2.8 cm ⫻ 1.4 cm. From an average viewing distance of 50 cm, this resulted in a visual angle of 3.2°
NOTEBAERT, GEVERS, VERGUTS, AND FIAS
1200
⫻ 1.6°. The numbers were presented upright or in italics (tilted 20° to the right). Procedure. The numbers 1, 2, 3, 4, 6, 7, 8, or 9 were presented in the center of the screen. When the number was presented in black (only the numbers 3, 4, 6, or 7), participants had to react to the magnitude of the stimulus. We refer to this task as the inducer task. Half of the participants were instructed to adopt a compatible mapping rule; that is, when the number was smaller than 5, they had to press the left response key, and when the number was larger than 5, they had to press the right response key. The other half of the participants experienced an incompatible mapping rule. When the number was smaller than 5, they had to press the right response key, and when the number was larger than 5, they had to press the left response key. When the number was presented in red (1, 2, 8, or 9), participants had to react to the orientation of the number. We refer to this task as the diagnostic task. Half of the participants had to respond with the left response key when the number was presented upright and with the right response key when the number was in italics. This mapping rule was reversed for the other half of the participants. Black and red numbers were presented randomly. The response–stimulus interval was fixed at 1,500 ms. Participants ran through 12 blocks of 32 trials. After each block they had the opportunity to take a break. By pressing a response button, they started a new block of trials.
numbers, resulting in a slope value for every participant. A regular SNARC effect was recognized by a negative slope (left responses were faster for small numbers than large numbers, and right responses were faster for large numbers than for small numbers). There was an interaction between the SNARC slopes for both groups of participants (compatible and incompatible inducer task), t(38) ⫽ 4.79, p ⬍ .001. In the compatible group, the negative slope (⫺16.59) was significant, t(19) ⫽ 4.74, p ⬍ .001. The reversed SNARC effect recognized by the positive slope (7.85) in the incompatible condition was also significant, t(19) ⫽ 2.11, p ⬍ .05. Both slopes are presented in Figure 2. For the error analysis, we calculated the percentage of errors on congruent (1 and 2 with left and 8 and 9 with right) and incongruent (1 and 2 with right and 8 and 9 with left) responses for both groups. In the compatible group, more errors were made on incongruent trials (9.3%) than on congruent trials (3.6%), t(38) ⫽ 4.01, p ⬍ .001. In the incompatible group, more errors were made on congruent trials (8.5%) than on incongruent trials (4.6%), t(19) ⫽ 2.15, p ⬍ .05. The difference between both conditions was significant, t(38) ⫽ 5.22, p ⬍ .001.
Discussion Results Inducer task: Magnitude comparison (3, 4, 6, and 7). Although there is a relatively large difference between the compatible mapping condition (629 ms) and the incompatible mapping condition (709 ms) in the RTs for the magnitude task, the difference is not statistically significant, t(38) ⫽ 1.59, p ⫽ .12. Participants in the incompatible group (6.9%) also made more errors than participants in the compatible group (5.2%), but this difference also did not reach statistical significance, t(38) ⫽ 1.16, p ⫽ .25. Diagnostic task: Orientation judgment (1, 2, 8, and 9). We analyzed the data with Lorch and Myers’s (1990) regression analyses. First, the differences between the RTs for right and left responses for each number (1, 2, 8, and 9) were calculated. These differences for each number were then regressed on the specific
We observed an influence of the mapping rule applied in the magnitude (inducer) task on the RTs and error percentages in the orientation (diagnostic) task. The direction of the SNARC effect in the orientation task reflected the mapping rule in the magnitude task. When this mapping rule associated small numbers with the right response and large numbers with the left response, a significant reversed SNARC effect was observed. As stated earlier, we used different numbers in the magnitude and the orientation task so that stimulus-specific priming processes would not cause the reversal. In Experiment 2, we investigated the SNARC reversal by applying a spatially incompatible mapping rule.
Experiment 2 Experiment 1 revealed that the SNARC effect can be reversed when participants respond incompatibly in a concurrent magnitude
Magn Comp
Magn Incomp
Linear (Magn Comp)
Linear (Magn Incomp)
60 40
dRT
20 0 -20 -40 -60 -80 -100 -120 1
2
8
9
Figure 2. The differences between the reaction times (dRTs) for right responses and left responses for each number (1, 2, 8, and 9) in the orientation task. The dRTs for the participants in the compatible magnitude (Magn Comp) condition and in the incompatible magnitude (Magn Incomp) condition are shown. The full line represents the linear fit for the compatible group, and the striped line represents the linear fit for the incompatible group.
SNARC AND SIMON REVERSAL
task. In Experiment 2, we investigated whether the SNARC effect could be reversed through the concurrent use of a spatially incompatible mapping rule. For this purpose, we mixed a number orientation task with a spatial compatibility task where half of the participants had to respond spatially compatibly (stimulus on the right, press right) and the other half incompatibly (stimulus on the right, press left). A reversed SNARC effect would be in line with an architecture where both types of spatial information activate a shared representation (Figure 1b).
Method Participants. Forty volunteers (18 to 25 years old; 29 women and 11 men) participated in return for course credits. All had normal or correctedto-normal vision and were naive to the purpose of the study. Each participated in a single 15-min session. Procedure. The orientation task (diagnostic task) was identical to that of Experiment 1. Again, the numbers were presented in red in the orientation task. A spatial compatibility task was mixed with this orientation task. A black X (1.4 cm ⫻ 1.4 cm or 1.6° ⫻ 1.6° with a distance of 50 cm) could appear to the left or right of the fixation cross. The spatial compatibility task was the inducer task. The stimuli in the spatial compatibility task appeared 3.2 cm (3.7° with 50-cm distance) to the left or right of the fixation cross. Half of the participants responded compatibly (left location, left response) and the other half incompatibly (left location, right response). Participants were randomly assigned to the compatible or the incompatible condition.
1201
the spatially compatible group and the positive slope (3.86) in the spatially incompatible group were significant, with t(19) ⫽ ⫺2.64, p ⬍ .05 and t(19) ⫽ 2.24, p ⬍ .05, respectively. For the error analysis, we again compared congruent and incongruent trials for both groups. The compatible group made more errors on incongruent trials (10.3%) than on congruent trials (7.9%), t(38) ⫽ 1.08, p ⫽ .29, while the incompatible group made more errors on congruent (9.0%) than on incongruent trials (7.6%), t(38) ⫽ 0.72, p ⫽ .47. However, in error rates, neither of the SNARC effects reached significance, although the difference between both effects neared significance, t(38) ⫽ 1.89, p ⫽ .07.
Discussion The SNARC effect reversed when participants responded incompatibly to spatial locations. This means that changing associations between explicit spatial information and spatial responses had an effect on the associations between small and large numbers and spatial responses. This can be the case only when the processing of numbers, at least partially, draws on the same representations as the processing of physical locations. Accordingly, it should also be possible to reverse the Simon effect through the concurrent use of incompatible magnitude mappings. This prediction was put to test in Experiment 3.
Experiment 3 Results Inducer task: Spatial compatibility task. Participants with a spatially compatible mapping rule were faster (438 ms) than participants with a spatially incompatible mapping rule (500 ms), t(38) ⫽ 3.91, p ⬍ .001. Participants in the compatible group made fewer errors (0.6%) than participants in the incompatible group (1.7%), t(38) ⫽ 3.13, p ⬍ .01. Diagnostic task: SNARC orientation. There was a significant difference between the two SNARC slopes, t(38) ⫽ 3.43, p ⬍ .01, as is demonstrated in Figure 3. Both the negative slope (⫺7.19) in
In Experiment 2, we demonstrated that the SNARC effect was modulated by explicit spatial mappings. From this result, we put forward the hypothesis that numbers and lateralized stimuli share spatial representations and that the associations from these representations to lateralized responses are common for the two domains. If this is the case, we can predict the inverse modulation, namely that Simon effect can be modulated with incompatible mappings induced by numbers. We tested this prediction in Experiment 3.
Method Spat Comp
Spat Incomp
Linear (Spat Comp)
Linear (Spat Incomp)
50 30
dRT
10 -10 -30 -50 -70 1
2
8
9
Figure 3. The differences between the reaction times (dRTs) for right responses and left responses for each number (1, 2, 8, and 9) together with the linear fit. The dRTs for the participants in the spatially compatible (Spat Comp) condition and the spatially incompatible (Spat Incomp) condition are shown. The full line represents the linear fit for the compatible group, and the striped line represents the linear fit for the incompatible group.
Participants. Forty psychology undergraduate students (18 to 22 years old; 26 women and 14 men) at Ghent University participated in return for course credits. All had normal or corrected-to-normal vision and were naive to the purpose of the study. Each participated in a single 15-min session. Procedure. A Simon task was mixed with a magnitude comparison task. The Simon task (diagnostic task) consisted of red or green circles (1.4 ⫻ 1.4 cm or 1.6° ⫻ 1.6°) that were presented on the left or right of the fixation cross (3.2 cm or 3.66° away from center). Participants had to respond to the color of the stimulus. Half of the participants had to respond with the left response key to a red stimulus and with the right response key to a green stimulus. This mapping was reversed for the other half of the participants. The location of the stimulus is irrelevant in this task. In the magnitude comparison task (the inducer task), the numbers 1, 2, 8, or 9 were presented in the center of the screen. The numbers were presented in black and were again 2.8 ⫻ 1.4 cm, or 3.2° ⫻ 1.6°, with a viewing distance of 50 cm. Half of the participants were instructed to adopt a compatible mapping rule; that is, when the number was smaller than 5, they had to press the left response key, and when the number was larger than 5, they had to press the right response key. The other half of the participants experienced an incompatible mapping rule. When the number was smaller than 5, these participants had to press the right response key,
NOTEBAERT, GEVERS, VERGUTS, AND FIAS
and when the number was larger than 5, they had to press the left response key. Simon trials and magnitude comparison trials were randomly presented. The response–stimulus interval was fixed at 1,500 ms. Participants ran through 12 blocks of 32 trials. After each block, they had the opportunity to take a break. By pressing a response button, they started a new block of trials.
Results In the compatible condition, 1 participant had a median RT of 801 ms, whereas the overall median (this participant included) was only 539 ms, with a standard deviation of 86 ms. Hence, this participant’s median exceeded 3 standard deviations from the overall median, and we excluded the data of this participant. The result was that only 19 participants were included in the analysis of the compatible condition. The inducer task: Magnitude comparison. Participants with a compatible mapping rule were faster (514 ms) in the magnitude comparison task than participants with an incompatible mapping rule (584 ms), t(37) ⫽ 3.39, p ⬍ .01. There was no difference in terms of error percentages, with 4.9% errors in the compatible group and 4.2% in the incompatible group, t(37) ⫽ 0.53, p ⫽ .60. The diagnostic task: The Simon task. There was a different Simon effect for the two groups, t(37) ⫽ 2.56, p ⬍ .05. The Simon effect was 25 ms, t(19) ⫽ 2.42, p ⬍ .05, in the compatible group, and there was a reversed Simon effect of 13 ms in the incompatible group, t(20) ⫽ 1.23, p ⫽ .23. This is presented in Figure 4. In the compatible group, more errors were made on incongruent (8.7%) than on congruent trials (6.4%), t(36) ⫽ 1.01, p ⫽ .32. In the incompatible group, more errors were made on congruent trials (7.7%) than on incongruent trials (7.1%), t(38) ⫽ 0.36, p ⫽ .72. The difference between both Simon effects in terms of error rates did not reach significance, t(37) ⫽ 1.61, p ⫽ .12. The observation that the Simon effect does not significantly reverse in combination with the observation that the magnitude incompatible group is generally slower could be problematic for our interpretation. In the Simon literature, it is known that the Simon effect decreases with increasing RTs (Hommel, 1993a; Ridderinkhof, 2002). The fact that the Simon effect disappears in
Simon Con
Simon Incon
640 620 RT (ms)
600 580 560 540 520 Magn Comp
Magn Incomp
Figure 4. Reaction times (RTs) from the Simon task for spatially corresponding and spatially noncorresponding trials for the magnitude compatible (Magn Comp) and the magnitude incompatible (Magn Incomp) groups. Con ⫽ congruent; Incon ⫽ incongruent.
Simon Con
RT (ms)
1202
Simon Incon
680 660 640 620 600 580 560 540 520 500 480 460 Block 1
Block 2
Magnitude Compatible
Block 1
Block 2
Magnitude Incompatible
Figure 5. Reaction times (RTs) for the first half (Block 1) and the second half (Block 2) of the Simon task. Spatially corresponding and spatially noncorresponding trials are presented for the magnitude compatible and the magnitude incompatible groups. Con ⫽ congruent; Incon ⫽ incongruent.
the magnitude incompatible condition could therefore be caused by the overall slower RTs. There is, however, an indication that this is not the reason why the Simon effect disappears in the incompatible condition. This indication comes from an analysis where, by splitting our data into two blocks, we take the evolution during the experiment into account. First, when we analyzed the inducer task with this extra variable (block), we observed a smaller between-subjects compatibility effect in the second half (Block 2) than in the first half (Block 1) of the experiment, indicated by an interaction between block and magnitude compatibility, F(1, 37) ⫽ 7.00, p ⬍ .05. This suggests that the impact of our inducer task is reduced in the second half of the experiment.1 When we consequently analyzed the diagnostic Simon trials with this extra block variable, we observed a close to significant Block ⫻ Congruency interaction in the incompatible group, F(1, 37) ⫽ 3.33, p ⫽ .08. Moreover, the reversed Simon effect was significant in the first block, F(1, 37) ⫽ 5.10, p ⬍ .05, and disappeared in block 2, F(1, 37) ⬍ 1, ns. No interaction between block and congruency was observed in the compatible group, F(1, 37) ⬍ 1, ns. This is presented in Figure 5. The block analysis revealed two important effects. First, in the incompatible group, participants display a reversed Simon effect in the first half of the experiment. This cannot be explained in terms of decay or inhibition with longer RTs. Second, in the compatible group, the Simon effect was identical for Blocks 1 and 2. This suggests that overall RT differences between the two blocks do not alter the Simon effect. Both observations support the interpretation that the reversed Simon effect in the incompatible group is caused by our compatibility manipulation and not simply by RT differences. The fact that the Simon effect is reversed only in the beginning of the experiment fits with the observation that the between-subjects compatibility effect (in the magnitude comparison task) also decreased from Block 1 to Block 2. 1 The between-subjects compatibility effect did not change in Experiment 1, F(1, 38) ⫽ 2.54, p ⫽ .12, and Experiment 2, F(1, 38) ⬍ 1, ns, explaining the overall reversed SNARC effects.
SNARC AND SIMON REVERSAL
We have demonstrated that the SNARC effect is modulated by spatial compatibility (Experiment 2) and that the Simon effect is modulated by magnitude compatibility (Experiment 3). We interpret this in terms of a common spatial representation that is activated by these two sources of spatial information. The incompatible mappings change the associations from this common spatial representation to spatial responses. In a Simon context, it was originally believed that the spatial codes associated with the location of a stimulus (e.g., right) automatically primed all the responses on the side of the location (e.g., Simon, 1969). However, recent evidence shows that this is not necessarily the case. Researchers have observed that the representation of the responses is crucial for the Simon effect to occur (Hommel, 1993b; ValleIncla´n & Redondo, 1998). These observations are integrated in the response discrimination account of Ansorge and Wu¨hr (2004). They demonstrated that the Simon effect was observed only for the dimension (horizontal or vertical) that discriminated between the responses. For instance, if the participant had to make a choice between left and right response, a Simon effect for the horizontal dimension was observed, but if a participant always had to make a response to the right (and select between top-right and bottomright responses), no advantage was observed for stimuli presented on the right side of the screen over stimuli presented on the left side. This finding was replicated in the SNARC effect (Gevers, Lammertyn, Notebaert, Verguts, & Fias, in press). These observations are important for this particular reversal paradigm because in all reversal studies conducted so far, both the inducer and the diagnostic task used the same response sets. Assume that the inducer task uses a different response set than the diagnostic task. In this situation, the response discrimination account predicts that the associations from the spatial codes to one response set are changed but that the other associations remain. Stated in terms of the model in Figure 1b, changing the connection pattern from spatial codes toward one effector should not change the connections toward a different effector. We investigated this hypothesis to further understand the associations from spatial representations to spatial responses.
Experiment 4 In this experiment, we investigated the effect of a spatially incompatible mapping rule on the SNARC effect as in Experiment 2. The crucial difference was that the spatially incompatible responses were made with foot responses, and the orientation judgments were made with index fingers, as in Experiment 2. On the basis of the response discrimination account, we predicted a regular SNARC effect because this account postulates that the associations between spatial codes and responses depend on the response set. We did not include the spatially compatible mapping condition, because the prediction is no longer formulated in terms of differences between a compatible and an incompatible mapping.
Method Participants. Thirteen paid volunteers participated (18 to 30 years old; 9 women and 4 men). They received 5 euro for participation. All had normal or corrected-to-normal vision and were naive to the purpose of the study. Each participated in a single 20-min session.
Procedure. Participants were asked to take off their shoes. They responded a few times with the left and with the right foot to get acquainted with the foot response box. Then the instructions were given and the actual experiment started. Participants responded spatially incompatibly to the location of an X that was presented to the left or right of the fixation cross. Responses to the location of the X were given with the feet. If an X appeared on the left side of the screen, participants were required to respond with their right foot, if the X appeared on the right side of the screen, participants were required to respond with their left foot. Randomly intermixed were orientation judgment trials for the numbers 1, 2, 8, and 9 (SNARC trials), requiring manual responses. Except for the response manipulation, the design was exactly the same as in Experiment 2.
Results Inducer task: Spatial compatibility task (feet). The median RT was 519 ms, and in total 4.75% errors were made. Diagnostic task: SNARC orientation (fingers). A regular SNARC effect was observed, as indicated by the significant negative SNARC slope value (⫺12.60), t(12) ⫽ ⫺3.31, p ⬍ .01. This is presented in Figure 6. As in the previous experiments, for the error analysis we calculated the percentage of errors on congruent (1 and 2 with left and 8 and 9 with right) and incongruent (1 and 2 with right and 8 and 9 with left) responses. A regular SNARC effect was observed in the sense that more errors were made to SNARC incongruent (6.19%) than to SNARC congruent (3.73%) trials, t(12) ⫽ ⫺3.10, p ⬍ .01.
Discussion In Experiment 4, we observed a regular SNARC effect, although participants experienced a spatially incompatible mapping rule. The fact that the incompatible mapping rule did not affect performance in a task with a different response set is in line with the response discrimination account. Other conclusions are discussed in the General Discussion.
General Discussion In four experiments, we investigated the spatial response associations in the Simon and the SNARC effects. We investigated the likelihood of a common spatial representation for implicit and
Observed
Linear (Observed)
5 0
dRT
Discussion
1203
-5 -10 -15 -20 -25 -30 -35 -40 -45 1
2
8
9
Figure 6. The differences between the reaction times (dRTs) for right and left responses for each number (1, 2, 8, and 9), together with the linear fit.
1204
NOTEBAERT, GEVERS, VERGUTS, AND FIAS
explicit spatial information. In Experiment 1, we observed that the mapping rule of the magnitude task (smaller or larger than 5) influenced the SNARC effect as measured in an orientation task. Participants responding compatibly (small numbers left and large numbers right) showed a regular SNARC effect, and participants responding incompatibly (left on large numbers and right on small numbers) displayed a reversed SNARC effect. In Experiment 2, the SNARC effect reversed through the concurrent use of an explicit spatial compatibility task. When participants had to respond incompatibly to lateralized stimuli (press left when stimulus appears on the right and right when stimulus appears on the left), the SNARC effect in the orientation task reversed. In Experiment 3, the Simon effect was modulated by the compatibility of a magnitude comparison task (smaller or larger than 5). In Experiment 4, we demonstrated that the SNARC effect was not affected by a spatially incompatible mapping rule that was applied to different effectors. Theoretically, this series of experiments has important implications for the understanding of the spatial numerical response associations, but also for the mechanisms behind the reversal of congruency effects as studied with this particular paradigm.
Shared Spatial Representations The reversal observed in Experiment 1 was another demonstration that the Simon and the SNARC effects are comparable in many respects. Experiment 1 was analogous to the experiment that was conducted by Marble and Proctor (2000) with the Simon task, with the main difference being that different stimuli were used in the inducer task (3, 4, 6, and 7) and the diagnostic task (1, 2, 8, and 9). The theoretical relevance of this manipulation is discussed later. More important, in Experiments 2 and 3, we demonstrated that the similarity between the Simon and the SNARC effects is more than a mere analogy and that both effects result from at least partially overlapping representations. This idea was proposed earlier (Walsh, 2003), but it was never demonstrated explicitly. From earlier studies, it could be concluded that it is justified to assume an underlying dual route architecture for the SNARC effect (as was proposed for the Simon effect). On the basis of the results of Experiments 2 and 3, we can conclude that the processing of the irrelevant spatial information of both tasks converges on a shared representation for spatial information. This implies that implicit, mentally generated spatial information, at least the left– right information as it is generated by numbers, overlaps with the spatial representations derived from external space. This means that both a large number presented at the center of a screen and a stimulus presented on the right side of the display automatically activate the same spatial code “right” (Figure 1b). In the introduction, we discussed the one important indication arguing against shared spatial representations: the different time courses for both effects. The Simon effect decreases with increasing RTs, while the SNARC effect increases with increasing RTs. It has been argued that these different temporal characteristics suggest different spatial representations (Mapelli et al., 2003). In contrast, we argue that this difference can be explained in terms of how the spatial code is activated in both cases. In the case of the Simon effect, the explicit physical location results in fast activation of spatial information, whereas it takes some time before the implicit spatial information is extracted from numbers. Conse-
quently, the different time courses of both effects could be explained in terms of different time courses of activation and decay (or inhibition) of the same spatial representation.
Only Numbers and Space? An important question now is whether this shared spatial representation is unique for physical locations and numbers. Proctor et al. (2000) did not observe a reversed Simon effect when participants had to respond incompatibly to the words right and left or to leftward and rightward pointing arrows. They therefore concluded that there is no shared spatial representation for spatial words, arrows, and locations. Integrating both data sets, we have to conclude that the numerical spatial code and the spatial code associated with locations have a shared representation that is not shared by other types of spatial information. At first sight, this might seem implausible, but the numerical and the physical left–right dimensions share one aspect that is not shared by the arrow and verbal left–right dimensions. The physical and numerical left–right dimensions vary gradually from left to right. In the case of arrows and location words, the spatial information is discrete: It is left or right. It could be the case that gradual, continuous spatial information and discrete spatial information are processed distinctively. Moreover, in the introduction we discussed two lines of research that already indicated a high connection between numbers and space, although the findings were not sufficient to conclude shared representations. Hemineglect (Zorzi et al., 2002) and fMRI studies (Dehaene et al., 2003) have suggested common brain mechanisms responsible for shifting attention in numerical and physical space. The present data add to this. We now know that it is not only the mechanisms responsible for processing spatial information that are shared, but also the representations as such.
Spatial Response Associations In Experiment 4, we observed that the SNARC effect did not reverse when the spatially incompatible mappings were applied to foot responses. This demonstrates that the mappings from spatial representations to spatial responses depend on the response characteristics. It has already been demonstrated that response priming on the basis of spatial information occurs only when the responses are also represented in the task setting (e.g., Ansorge & Wu¨hr, 2004). This contradicts pure stimulus-driven accounts of the Simon effect. Recently, it was also demonstrated that the SNARC effect depends on the response characteristics (Gevers et al., in press). In Experiment 4, we demonstrated that the associations for one task set can differ from the associations for another task set. The spatial response associations in the foot task were spatially incompatible, whereas the spatial response associations remained compatible in the finger task.
Mechanisms Behind the Reversal Our results also reveal interesting characteristics of the mechanisms behind the reversal of congruency effects in this specific paradigm. In Experiment 1, we used different numbers in the magnitude and the orientation tasks to exclude stimulus-specific priming. However, the use of different numbers in both tasks did
SNARC AND SIMON REVERSAL
not completely exclude priming-based processes. In the incompatible condition, participants learned associations between 3 and right, between 4 and right, between 6 and left, and between 7 and left. When these particular S-R associations were learned, one could argue that it was possible that adjacent numbers benefited from these new associations. For instance, when the number 2 was presented (in the orientation task), it is possible that this primed the right response through the stimulus-specific 3–right link. This is feasible given that distance-related priming has been observed repeatedly: Priming decreased as the numerical distance between prime and target number increased. For instance, priming from 1 was larger for 2 than for 3 (e.g., Reynvoet, Brysbaert, & Fias, 2002). This priming could potentially explain the results of Experiment 1 but could not be used as an explanation for the reversals observed in Experiments 2 and 3 because different stimulus sets were used in the inducer and the diagnostic tasks. Another possible explanation for the reversed congruency effects is that participants applied the mapping rule of one task to the other task. In Experiment 1, it could be that participants applied the rule to press right for a small number and press left for a large number to the numbers in the orientation task. This alternative account is at odds with the results of Marble and Proctor (2000). They demonstrated that the reversal of the Simon effect persisted even when the task was cued. The idea was that cueing the upcoming task (location relevant or location irrelevant) might reduce the use of the mapping rule from location relevant trials on location irrelevant trials. The data clearly showed a reversed Simon effect for stimulus-onset asynchronies ranging from 150 to 2,400 ms. A more direct way to exclude rule-based reversal is to ensure that the mapping rule from one task is not applicable to the other task, as was the case in Experiments 2 and 3. The reversal, in Experiments 2 and 3 at least, is therefore best explained in terms of a reconfiguration of spatial response associations. A final alternative hypothesis could be that the reversal as we observed it originates from a general recoding operation. It is possible that changing associations in one dimension influences the associations in another dimension, without any overlap between these dimensions. Hedge and Marsh (1975) demonstrated that when participants received an incompatible color-mapping rule (press red response key on green stimulus and vice versa), the Simon effect reversed for these lateralized colored stimuli. These results were explained in terms of logical recoding, meaning that the application of one incompatible mapping rule resulted in a general recoding, so that all incompatible associations were favored. Similarly, a logical recoding operation could cause a reversal of the Simon and the SNARC effects. The results of Experiment 4, however, strongly counter this alternative hypothesis. When the application of an incompatible mapping rule should result in a logical recoding operation so that all natural responses were reconfigured, a reversed SNARC effect should have been observed in Experiment 4. Moreover, the results of Proctor et al. (2000) are also at odds with this hypothesis. Proctor et al. observed no reversed Simon effect for spatial locations when participants practiced incompatible responses with arrows and spatial words, although compatibility effects were observed for these dimensions (e.g., faster responses with a right response key on arrows pointing to the right than on arrows pointing to the left). This clearly demonstrates that experiencing any incompatible mapping rule
1205
does not lead to the reversal of congruency effects. One possible difference between Hedge and Marsh’s design on the one hand and our designs and Proctor et al.’s designs on the other, was that the former involved only a single task set, whereas the latter involved two tasks. Although it is difficult to make strong statements about what exactly caused the different results, it is clear that the interpretation of the findings by Hedge and Marsh is not universally applicable.
Between-Subjects Compatibility Effects In all experiments, we observed a between-subjects compatibility effect. Participants in the compatible group were faster than participants in the incompatible group in the inducer task. Only in Experiment 1, this difference (80 ms) did not reach statistical significance. These compatibility effects are in contradiction with the results of Proctor, Vu, and Marble (2003). They observed that the spatial compatibility effect disappeared when the compatibility task (location relevant) was mixed with a Simon task (location irrelevant, color relevant). The overall inconsistency in the way the relevant information is mapped on the responses in a mixed condition results in more uncertainty, and this blocks fast direct S-R translation in the compatible mapping condition. At first sight, the compatibility effect in Experiment 2 is in line with the results of Experiment 2 of Proctor et al. (2003). When a spatial compatibility task was mixed with a task where the stimuli appeared centrally (color relevant), the compatibility effect was observed. However, we assume that the centrally presented numbers in our Experiment 2 also evoked spatial codes, and this should have eliminated the compatibility effect according to Proctor et al. Also in Experiment 3, Proctor et al. would basically have predicted that the between-subjects compatibility effect would be eliminated. One could ultimately argue that the compatibility effects in Experiments 2 and 3 reveal that different spatial codes were activated in the inducer and the diagnostic tasks, because Proctor et al. demonstrated that when the inducer and the diagnostic tasks used similar codes, the compatibility effects were eliminated. This conclusion, however, seems somewhat premature because, also in Experiment 1, there was a relatively large (although not significant) difference between the compatible and the incompatible group (80 ms, p ⫽ .12). In Experiment 1, the same spatial– numerical information was used in both tasks, and still the compatibility effect was not eliminated. This raises doubts about the generality of the results of Proctor et al. It seems difficult to generalize their conclusion to implicitly generated spatial information. Moreover, they also observed a compatibility effect when the relevant information was presented horizontally and the irrelevant information was presented vertically, while it was suggested that these two dimensions are also similarly coded (e.g., Cho & Proctor, 2003). Consequently, it seems that more research is needed to fully understand what factors contribute to the disappearance of the (spatial) compatibility effects.
Conclusion We dissociated three possible architectures for spatial response associations and concluded that only an architecture with a shared
NOTEBAERT, GEVERS, VERGUTS, AND FIAS
1206
intermediate spatial representation can explain the current findings. The next task on the agenda is to further specify the nature of this spatial representation and to describe the underlying processing architecture of numbers, space, and spatial representations in a computational manner.
References Ansorge, U., & Wu¨hr, P. (2004). A response-discrimination account of the Simon effect. Journal of Experimental Psychology: Human Perception and Performance, 30, 365–377. Caessens, B., Notebaert, W., Burle´, B., & Soetens, E. (2005). Voluntary and involuntary control over automatic processing in spatial congruency tasks: Editor’s introduction. European Journal of Cognitive Psychology, 17, 577–589. Cho, Y. S., & Proctor, R. W. (2003). Stimulus and response representations underlying orthogonal stimulus–response compatibility effects. Psychonomic Bulletin and Review, 10, 45–73. Dehaene, S., Bossini, S., & Giraux, P. (1993). The mental representation of parity and number magnitude. Journal of Experimental Psychology: General, 122, 371–396. Dehaene, S., Dupoux, E., & Mehler, J. (1990). Is numerical comparison digital? Analogical and symbolic effects in two-digit number comparison. Journal of Experimental Psychology: Human Perception and Performance, 16, 626 – 641. Dehaene, S., Piazza, M., Pinel, P., & Cohen, L. (2003). Three parietal circuits for number processing. Neuropsychology, 20, 487–506. De Jong, R., Liang, C. C., & Lauber, E. (1994). Conditional and unconditional automaticity: A dual-process model of effects of spatial stimulus–response correspondence. Journal of Experimental Psychology: Human Perception and Performance, 20, 731– 750. Doricchi, F., Guariglia, P., Gasparini, M., & Tomaiuolo, F. (2005). Dissociation between physical and mental number line bisection in right hemisphere brain damage. Nature Neuroscience, 8, 1663–1665. Fias, W., & Fischer, M. H. (2005). Spatial representation of numbers. In J. I. D. Campbell (Ed.), Handbook of mathematical cognition (pp. 43–54). New York: Psychology Press. Fias, W., Lauwereyns, J., & Lammertyn, J. (2001). Irrelevant digits affect feature-based attention depending on the overlap of neural circuits. Cognitive Brain Research, 12, 415– 423. Gevers, W., Caessens, B., & Fias, W. (2005). Towards a common processing architecture underlying Simon and SNARC effects. European Journal of Cognitive Psychology, 17, 659 – 673. Gevers, W., & Lammertyn, J. (2005). The hunt for SNARC. Psychology Science, 47, 10 –21. Gevers, W., Lammertyn, J., Notebaert, W., Verguts, T., & Fias, W. (in press). Automatic response activation of implicit spatial information: Evidence from the SNARC effect. Acta Psychologica. Gevers, W., Ratinckx, E., De Baene, W., & Fias, W. (2006). Further evidence that the SNARC effect is processed along a dual-route architecture: Evidence from the lateralized readiness potential. Experimental Psychology, 53, 58 – 68. Gevers, W., Verguts, T., Reynvoet, B., Caessens, B., & Fias, W. (2006). Numbers and space: A computational model of the SNARC effect. Journal of Experimental Psychology: Human Perception and Performance, 32, 32– 44. Hedge, A., & Marsh, N. W. A. (1975). Effect of irrelevant spatial correspondence on 2-choice response-time. Acta Psychologica, 39, 427– 439. Hommel, B. (1993a). Inverting the Simon effect by intention. Psychological Research, 55, 270 –279. Hommel, B. (1993b). The relationship between stimulus processing and response selection in the Simon task: Evidence for a temporal overlap. Psychological Research, 55, 280 –290.
Hubbard, E. M., Piazza, M., Pinel, P., & Dehaene, S. (2005). Interactions between number and space in parietal cortex. Nature Reviews Neuroscience, 6, 435– 448. Keus, I. M., & Schwarz, W. (2005). Searching for the functional locus of the SNARC effect: Evidence for a response related origin. Memory & Cognition, 33, 681– 695. Kornblum, S., Hasbroucq, T., & Osman, A. (1990). Dimensional overlap: Cognitive basis for stimulus–response compatibility—A model and taxonomy. Psychological Review, 97, 253–270. Lammertyn, J., Fias, W., & Lauwereyns, J. (2002). Semantic influences on feature-based attention due to overlap of neural circuits. Cortex, 38, 878 – 882. Lorch, R. F., Jr., & Myers, J. L. (1990). Regression analysis of repeated measures data in cognition research. Journal of Experimental Psychology: Learning, Memory, and Cognition, 16, 149 –157. Mapelli, D., Rusconi, E., & Umilta`, C. (2003). The SNARC effect: An instance of the Simon effect? Cognition, 88, B1–B10. Marble, J. G., & Proctor, R. W. (2000). Mixing location-relevant and location-irrelevant choice-reaction tasks: Influences of location mapping on the Simon effect. Journal of Experimental Psychology: Human Perception and Performance, 26, 1515–1533. Marshall, J. C., & Halligan, P. W. (1989). When right goes left: An investigation of line bisection in a case of visual neglect. Cortex, 25, 503–515. Proctor, R. W., & Lu, C.-H. (1999). Processing irrelevant location information: Practice and transfer effects in choice-reaction tasks. Memory & Cognition, 27, 63–77. Proctor, R. W., Marble, J. G., & Vu, K.-P. L. (2000). Mixing incompatibly mapped location-relevant trials with location-irrelevant trials: Effects of stimulus mode on the reverse Simon effect. Psychological Research, 64, 11–24. Proctor, R. W., & Vu, K.-P. L. (2002). Eliminating, magnifying, and reversing spatial compatibility effects with mixed location-relevant and irrelevant trials. In W. Prinz & B. Hommel (Eds.), Common mechanisms in perception and action: Attention and performance XIX (pp. 443– 473). Oxford, England: Oxford University Press. Proctor, R. W., Vu, K.-P. L., & Marble, J. G. (2003). Mixing locationrelevant and irrelevant tasks: Spatial compatibility effects eliminated by stimuli that share the same spatial codes. Visual Cognition, 10, 15–50. Reynvoet, B., Brysbaert, M., & Fias, W. (2002). Semantic priming in number naming. Quarterly Journal of Experimental Psychology: Human Experimental Psychology, 55, 1127–1139. Ridderinkhof, K. R. (2002). Activation and suppression in conflict tasks: Empirical clarification through distributional analyses. In W. Prinz & B. Hommel (Eds.), Attention and performance XIX: Common mechanisms in perception and action (pp. 494 –519). Oxford, England: Oxford University Press. Ridderinkhof, K. R., van den Wildenberg, W. P. M., Wijnen, J., & Burle, B. (2004). Response inhibition in conflict tasks is revealed in delta plots. In M. Posner (Ed.), Cognitive neuroscience of attention (pp. 369 –377). New York: Guilford Press. Schneider, W., Eschman, A., & Zuccolotto, A. (2002a). E-Prime reference guide. Pittsburgh, PA: Psychology Software Tools. Schneider, W., Eschman, A., & Zuccolotto, A. (2002b). E-Prime user’s guide. Pittsburgh, PA: Psychology Software Tools. Simon, J. R. (1969). Reaction toward the source of stimulation. Journal of Experimental Psychology, 81, 1974 –1976. Simon, J. R. (1990). The effects of an irrelevant directional cue on human information processing. In R. Proctor & T. Reeve (Eds.), Stimulus– response compatibility: An integrated perspective (pp. 31– 86). Amsterdam: Elsevier Science. Sternberg, S. (1969). The discovery of processing stages: Extension on Donder’s method. In W. G. Koster (Ed.), Attention and performance
SNARC AND SIMON REVERSAL II: Acta psychologica (Vol. 30, pp. 276 –315). Amsterdam: North Holland. Tagliabue, M., Zorzi, M., Umilta`, C., & Bassignani, F. (2000). The role of long-term-memory and short-term-memory links in the Simon effect. Journal of Experimental Psychology: Human Perception and Performance, 26, 648 – 670. Valle-Incla´n, F., & Redondo, M. (1998). On the automaticity of ipsilateral response activation in the Simon effect. Psychophysiology, 35, 366 –371.
1207
Walsh, V. (2003). A theory of magnitude: Common cortical metrics of time, space and quantity. Trends in Cognitive Science, 7, 483– 488. Zorzi, M., Priftis, K., & Umilta`, C. (2002). Brain damage—Neglect disrupts the mental number line. Nature, 417, 138 –139.
Received June 13, 2005 Revision received March 3, 2006 Accepted March 4, 2006 䡲
Members of Underrepresented Groups: Reviewers for Journal Manuscripts Wanted If you are interested in reviewing manuscripts for APA journals, the APA Publications and Communications Board would like to invite your participation. Manuscript reviewers are vital to the publications process. As a reviewer, you would gain valuable experience in publishing. The P&C Board is particularly interested in encouraging members of underrepresented groups to participate more in this process. If you are interested in reviewing manuscripts, please write to the address below. Please note the following important points: • To be selected as a reviewer, you must have published articles in peer-reviewed journals. The experience of publishing provides a reviewer with the basis for preparing a thorough, objective review. • To be selected, it is critical to be a regular reader of the five to six empirical journals that are most central to the area or journal for which you would like to review. Current knowledge of recently published research provides a reviewer with the knowledge base to evaluate a new submission within the context of existing research. • To select the appropriate reviewers for each manuscript, the editor needs detailed information. Please include with your letter your vita. In the letter, please identify which APA journal(s) you are interested in, and describe your area of expertise. Be as specific as possible. For example, “social psychology” is not sufficient—you would need to specify “social cognition” or “attitude change” as well. • Reviewing a manuscript takes time (1– 4 hours per manuscript reviewed). If you are selected to review a manuscript, be prepared to invest the necessary time to evaluate the manuscript thoroughly. Write to Journals Office, American Psychological Association, 750 First Street, NE, Washington, DC 20002-4242.