PHYSICS OF FLUIDS 20, 043306 共2008兲
Shear-induced particle migration in binary colloidal suspensions Denis Semwogererea兲 and Eric R. Weeksb兲 Department of Physics, Emory University, Atlanta, Georgia 30322, USA
共Received 27 September 2007; accepted 4 March 2008; published online 25 April 2008兲 We present experimental investigations of the spatial and temporal evolution of particle migration in pressure driven flows of Brownian particle suspensions. Binary suspensions of 1.4 and 3.0 m diameter colloidal particles are pumped through a 50⫻ 500 m2 rectangular-cross-section capillary tube. Shear rate gradients caused by the resulting parabolic velocity profile drive the particles away from the walls toward the center of the channel, where the shear rate is lowest. The flows are directly imaged using high-speed laser scanning confocal microscopy. Size segregation of the particles is observed. Depending on the conditions, either the large or the small particles enrich the center. We measure the development of the size segregation by tracking the evolution of the cross-stream concentrations of the particles. © 2008 American Institute of Physics. 关DOI: 10.1063/1.2907378兴 I. INTRODUCTION
When a suspension of particles is pumped through a narrow channel, the spatially varying shear flow causes the particles to interact and migrate toward the channel center.1–5 A suspension that enters the channel with its particles uniformly distributed develops over some characteristic distance into one with a stable nonuniform profile. Migration is thus important wherever suspensions are transported from one vessel to another. It is observed in applications such as paper coating6 and in food industries.7,8 It has been studied in suspensions of long-chain DNA molecules,9 and found to affect heat transfer in suspensions of nanometer-sized particles 共nanofluids兲.10 Particle migration has benefited from extensive simulation and modeling studies4,5 as well as experimental ones.2,3,11 However, most work is on suspensions of monodisperse particles; thus, particle migration in suspensions of more than one particle size is not as well understood. The monodisperse studies have identified two key ways of quantifying particle migration. The first is the shape of the particle concentration profile, in particular, how it dramatically deviates from the initial uniform profile. The second is the entrance length needed for the concentration to develop into the final downstream concentration profile. Several factors influence the final downstream particle concentration profile for a monodisperse suspension. The shear-induced particle interactions increase with the particle volume fraction; previous work has seen these interactions increasing either as 共Ref. 12兲 or as 2.1 Thus, increasing results in more inhomogeneous final concentration profiles. However, the largest value possible for the concentration of a monodisperse particle species is RCP ⬇ 0.64, which is the random close-packed volume fraction. Thus, for initial concentrations closer to RCP, migration is limited, and increasing would lead to a more homogeneous concentration proa兲
Electronic mail:
[email protected]. Electronic mail:
[email protected].
b兲
1070-6631/2008/20共4兲/043306/7/$23.00
file. A second factor influencing the concentration profile is Brownian motion in the case of colloidal particles with radius a ⬍ 10 m.11,13 Brownian motion opposes concentration gradients and thus tries to homogenize the profile. The parameter that characterizes the strength of Brownian effects is the Péclet number, Pe= 60␥˙ a3 / kT. This is the ratio of Brownian-driven versus shear-driven timescales, where 0 is the viscosity of the solvent, k is the Boltzmann constant, and T is the temperature. We define the shear rate as ␥˙ = umax / H, where umax is the maximum axial speed of the suspension 共set by the flow rate兲 and H is half the width of the channel. Migration increases with Pe; for Peⱗ 100, Brownian motion is significant and limits the inhomogeneity of the fully developed profile.11,13 Thus, to have the most inhomogeneous final downstream profile, it is advantageous to increase , increase particle radius a, and increase flow rate umax. All these three will have diminishing returns when → RCP and when Pe⬎ 100. The entrance length L needed for the concentration profile to develop has also been studied; it has a different dependence on these key parameters.4,11,14 Increasing results in a shorter entrance length 共faster profile development兲, while increasing Pe results in a longer entrance length.11 The influence of can be understood similarly to its influence on the final profile: increasing results in more interparticle interactions, allowing for faster migration. Larger particle sizes a increase cross-stream diffusion by causing larger lateral displacements for each interaction, again causing faster migration.1 A concise estimate for non-Brownian particles was given by Nott and Brady:4 L/H ⬃
冉冊
1 H 12d共兲 a
2
共1兲
,
with the volume fraction dependence of the shear-induced coefficient of diffusion coming from d共兲.3,15 In particular, with increasing , d共兲 increases, leading to a shorter entrance length. Likewise, with increasing a, Eq. 共1兲 predicts a shorter entrance length. Note that Eq. 共1兲 is a low Reynolds number result and thus does not depend on the flow rate.
20, 043306-1
© 2008 American Institute of Physics
Author complimentary copy. Redistribution subject to AIP license or copyright, see http://phf.aip.org/phf/copyright.jsp
043306-2
Phys. Fluids 20, 043306 共2008兲
D. Semwogerere and E. R. Weeks
While a larger flow rate leads to faster migration, this is balanced by the longer distance the sample flows before migration is completed. While Eq. 共1兲 was developed for nonBrownian particles, the influence of Brownian motion was examined in Ref. 11. When PeⰇ 100, L was roughly flowrate independent and qualitatively agreed with Eq. 共1兲. For Pe⬍ 100, Brownian motion limits the inhomogeneity of the final concentration profile, as was noted above, and thus, the total distance needed to move the particles into their final positions is reduced. Thus, to reduce entrance lengths, smaller particles can be used or the flow rate decreased to bring Pe⬍ 100. The above results are based on experimental studies of monodisperse suspensions; in this work, we focus on binary suspensions. Prior experimental studies on binary suspensions flowing through channels16,17 found that initially evenly distributed particles of a binary suspension will partially segregate as they flow downstream, with the large particles enriching the channel center in most reported cases. We show experimental work that suggests that enrichment of the center is determined by the species with the shortest development length. As was noted above, the characteristic distance for a monodisperse suspension to reach full development decreases with increasing particle size and increasing bulk concentration.11,14,18 Thus, for suspensions of equal volume fractions of large and small particles, it is the larger species that disproportionately enrich the center. However, by increasing the concentration of the smaller particles, their entrance length can be sufficiently reduced to switch the enrichment at the center. For a given set of two particle sizes, Eq. 共1兲 can be used to estimate their entrance lengths, leading to a prediction for which species enriches the channel center; we find these predictions to be consistent with our results. Modeling work on shear-induced migration of polydisperse suspensions is limited. Nir et al.19 modeled the migration of binary suspensions in a Couette device and found size segregation. In contrast to our results, their model always found the small particle species accumulating near the highshear inner wall, which is independent of other conditions. This may be because their model only considered the steadystate solution and did not examine the evolution of the profile over time; our experimental results suggest that this evolution is crucial. In our work, we use confocal microscopy to measure the detailed cross-stream concentration of each particle size species. Unlike in previous studies of binary suspensions, we track the evolution of the concentration profile for each species as it travels downstream through the channel. We thus measure both the final concentration profile and also the entrance length. II. EXPERIMENTAL METHODS
Our binary suspensions consist of large particles with radius aL = 1.5 m and small particles with radius aS = 0.69 m. Similar to our previous work, each particle species has a polydispersity of ⬃5%, and the mean radii of each species have an uncertainty of 2%. The particles are slightly
TABLE I. Characteristics of the nine samples studied, which are organized into matched sets of 3. The samples are named using the convention 共large , small兲. The entrance lengths LL and LS for the large and small particles, respectively, are given in terms of the half-width of the channel, H = 25 m. For the binary samples, the entrance lengths noted correspond to the individual species 共large or small兲. The uncertainties in L are the standard deviations obtained from the three experimental runs performed on each suspension. The dashes in the table indicate a species not present in a given sample, for which the entrance length is thus not defined. LL
LS
共0.10,0.10兲
400⫾ 150
a
共0.10,0兲
490⫾ 40
—
共0,0.10兲
—
1180⫾ 120
Sample
共0.14,0.16兲 共0.15,0兲 共0,0.15兲 共0.10,0.25兲 共0.10,0兲 共0,0.25兲
a
250⫾ 10 300⫾ 40
—
—
600⫾ 200b
a
490⫾ 40 —
200⫾ 40 — 350⫾ 30
a
Insufficient migration to measure L. Insufficient data; the value is estimated from Ref. 11.
b
charged polymethylmethacrylate hard spheres suspended in a cyclohexylbromide/decalin mixture. The density of the suspended fluid matches the density of the particles to prevent sedimentation and also its index of refraction matches that of the particles to allow for visualization deep into the suspension.13 To avoid aggregation due to van der Waals attraction, the spheres are sterically stabilized by a thin layer of poly-12-hydroxystearic acid.20 In addition, the particles are labeled with fluorescent rhodamine dye to enable visualization with laser scanning confocal microscopy. We study three matched sets of samples, as listed in Table I. Each set has a binary sample, and two monodisperse samples were chosen with volume fractions matched to the volume fraction of that particle species within the binary sample. The total volume fraction of the samples 共L + S兲 ranges from 0.10 to 0.35. The flow chamber is a 50⫻ 500 m2 rectangular glass channel 共Fig. 1兲 with a 10 cm axial length 共Friedrich and Dimmock兲.11 The distances in our work are measured in terms of H = 25 m, which is the half-width of the channel. The flow chamber is glued inside a 900⫻ 900 m2 glass channel to allow visualization of the channel entrance. The glue also serves to seal the large chamber so that the entire flow is directed through the smaller channel. The suspensions are pumped into 共and removed from兲 the larger channel through Teflon tubes connected to either side of the large chamber. A 100 l gas-tight syringe is attached to one of the Teflon tubes and placed in a syringe pump 共KD Scientific兲, which drives the suspension at a controlled flow rate of Q = 0.30 l / min for all the experiments. All our experiments in this work are conducted at the same flow rate, Q = 0.3 l / min. The a3 dependence of Pe means that the two particle species have different Pe: 47 for the small particles and 480 for the large particles. Since Pe ⬍ 100 for the small particles but is Ⰷ100 for the large par-
Author complimentary copy. Redistribution subject to AIP license or copyright, see http://phf.aip.org/phf/copyright.jsp
043306-3
Phys. Fluids 20, 043306 共2008兲
Shear-induced particle migration 1
1
1
1
1
1
1
1
1
1
1
1
1
1
1
1
1 1
Flow chamber entrance 1
1
1
1 1 1
1 1 1
1 1
1 1
1
1 1
1
1 1
1 1
1
1 1
1 1
1
1 1
1 1
1
1 1
1
1 1
1 1
1
1 1
1 1
1
1
1
1 1
1 1
1 1
1
1
1 1
1 1
1
1 1
1
1 1
1
1
1
1
1
1
1
1
1
1
1
1
1
1
1
1
1
1
1
1
1
1
1
1
1
1
1
1
1
1
1
1
1
1
1
1
1 1
1
1
1 1
1
1 1 1 Suspension in
1 1
1
1
1 1
1
1
1
1
1 1 1
1
1
1
1
1
1
1
1
1
1
1
1
1
1
1
1
1
1
1
1
1
1
1
1
1
1
1
1
1
1
1
1
1
1
1
1
1 1
1 1
1 1
1
1
1 1
1
1 1
1
1
1
1
1 1
1
1
1
1
1 1
1
1
1 1
1
1
1
1 1
1
1 1
1
1
1
1
1
1
1
1
1 1
1
1
1 1 1
1
1
1
1 1
1 1
1
1
1
1
1
1
1 1
1
1
1 1 1
1
1 1 1
1
1 1
1 1
1
1 1
1
1
1 1 1
1 1
1
1
1
1 1
1
1 1
1
1 1
1
1
1
1
1 1
1
1
1
1
1 1
1
1
1 1
1
1
1 1
1
Barrier 1
1 1
1
1
1 1
1
1 1
1 1
1 1
1
1 1
1
1 1
1
1 1
1
1 1
1
1 1
1 1
1
1
1 1
1 1
1
1
1 1
1
1
1 1
1
1
1 1
1 1
1
1
1 1
1 1
1
1
1
1 1
1
1
1 1
1 1
1
1
1
1 1
1 1
1
1 1
1
1
1
1 1
1
1
1
1
1
1
1
1
1
1
1
1
1
1
1
1 1
1
1 1
1
1 1
1 1
1
1 1
1 1
1 1
1 1
1
1 1
1
1
1
1
1 1
1
1
1
1
1
1 1
1
1
1
1
1
1
1
1
1
1
1
1
1 1
1
1
1 1
1 1
1
1 1
1
1 1
1 1
1
1 1
1 1
1
1 1
1
1
1
1 1
1
1 1
1
1
1
1 1
1
1 1
1
1 1
1
1 1
1 1
1 1
1 1
1 1
1 1
1
1 1
1 1
1 1
1
1 1
1
1
1
1 1
1
1
1 1
1 1
1
1
1
1
1 1
1
1 1
1
1 1
1
1 1
1 1
1
1 1
1 1
1
1 1
1
1 1
1 1
1 1
1 1
1
1
1 1
1
1
1 1
1
1 1
1
1 1
1
1
1
1
1
1
1 1
1
1
1
1
1
1
1 1
1
1
1
1
1
1
1
1
1
1 1
1 1
1
1
1 1
1 1
1
1 1
1
1 1
1
1 1
1
1 1
1
1 1
1 1
1
1
1 1
1
1
1
1 1
1
1
1
1
1
1
1 1
1 1
1
1
1
1
1 1
1
1
1
1
1 1
1
1 1
1
1 1
1 1
1
1 1
1 1
1
1
1
1 1
1
1
1 1
1
1
1
1 1
1 1
1
1
1 1
1 1
1
1
1
1 1
1
1
1
1
1
1
1
1 1
1
1
1 1
1
1
1
1
1
1
1
1
1
1
1
1
1
1
1
1 1
1
1
1
1
1
1 1
1
1
1
1
1
1
1
1
1
1
1
1
1 1
1
1 1
1 1
1 1
1 1
1
1
1
1 1
1 1
1
1
1 1
1
1
1
1
1
1
1
1
1
1
1
1
1
1
1
1
1
1
1
1
1
1
1
1
1
1
1
1 1
1
1
1
1 1
1 1
1
1 1
1 1
1 1
1 1
1
1 1
1
1 1
1 1
1 1
1
1 1
1 1
1 1
1
1
1
1 1
1 1
1 1
1
1
1 1
1 1
1 1
1
1 1
1 1
1 1
1
1 1
1
1
1 1
1 1
1 1
1
1
1
1 1
1 1
1 1
1
1
1
1 1
1 1
1 1
1
1
1
1 1
1 1
1 1
1
1
1
1 1
1 1
1 1
1
1
1
1 1
1 1
1 1
1
1 1
1 1
1 1
1
1 1
1 1
1 1
1
1
1
1 1
1 1
1
1
1
1
1 1
1 1
1
1
1
1 1
1
1
1
1
1 1
1
1
1
1
1
1
1 1
Transparent outer channel entrance
1
1
1
1 1
1
1 1
(a) Microscope position x
Image slices
y z 1
1
1
1
1
1
1
1
1
1
1
1
1
1
1
1
1
1
1 1
1
1
1 1 1 1 1 1 1 1 1 Suspension1 1
1
x
1 1
1
1
1
1
1
1
1 1
1
1
1
1
1
1
1
1 1
1
1 1
in
Flow chamber entrance
1 1 1 1
1 1
1
1
1 1
1
1 1
1
1 1
1
1 1
2H = 50 µm
(b)
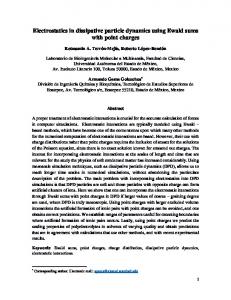
FIG. 1. 共a兲 Schematic of the experimental setup near the entrance of the rectangular-cross-section capillary tube. The suspension has a uniform concentration at the entrance because the flow is from a Teflon tube that has a much larger cross section. 共b兲 Glass rectangular-cross-section flow chamber showing the relative position of the microscope and the corresponding image slices. The capillary tube length is 4000H 共along x兲 and is not shown to scale.
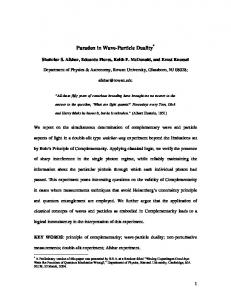
ticles, moderate changes in flow rate would affect the small particles much more than they would affect the large particles, as described in Sec. I. Before acquisition of data, air bubbles are first removed and the suspension is pumped through the chamber for some time to allow the flow to stabilize. Note that stabilization is quick and the flows are expected to be in steady state by the time the suspension has flowed long enough to traverse the length of the flow chamber. To resolve the thousands of particles flowing at a high speed, images are acquired using a fast laser scanning confocal microscope 共VT-Eye by VisiTech International兲. With a 100⫻, 1.35 numerical aperture objective set at a field of view of 55⫻ 55 m2, the confocal microscope acquires images at 94 frames/ s and can thus resolve particles flowing at speeds up to 5000 m / s, which is well above the 250 m / s maximum speed reached in these experiments. Data are collected at various points along the flow axis 共x axis Fig. 1兲 of the channel. The first point is at the entrance of the tube 共x = 0兲: the microscope objective is positioned just inside the entrance and a series of twodimensional 共2D兲 slices 0.2 m apart along the z axis 共Fig. 1兲 is taken through the depth of the rectangular-shaped channel, i.e., from z = 0 to z = 50 m. Figure 2 shows three such image slices taken far downstream at different z positions; migration is evident. Note that since all the experiments are
FIG. 2. 2D slices of a binary suspension of 3.0 and 1.4 m diameter particles taken along the vertical axis of the channel at a distance far downstream of the channel inlet 共x / H = 2000, where H = 25 m is half of the channel width兲. The slices are at the bottom wall, the center, and the top wall. Particle migration to the center is clearly visible by eye. Some segregation of the large and small particles is evident: the slices closest to the walls clearly have a lower concentration of large particles than that of small particles, and vice versa for the center slice. At the channel entrance, the suspension is 共large , small兲 = 共0.14, 0.16兲. The scale bar is 10 m in length.
conducted at the same flow rate and the volume fractions are all relatively low, the velocity profiles along the z axis are similar: approximately parabolic profiles with the flow speed almost zero near the walls and a maximum of approximately 250 m / s at the center.13 From the slices, the local volume fraction as a function of z is separately extracted for the large and small particles by counting the number of particles of each size observed in each image slice and by using the method described by Semwogerere et al.11 Due to local variability and overall uncertainty of the particles’ diameters 共⬃2 % 兲, we estimate the fractional uncertainties in our measured volume fraction to be of order 10% of the reported values. Figure 3 shows typical concentration profiles of segregating large and small particles. It confirms that size segregation as hinted at in Fig. 2 does occur. Measurement of the large and small particle bulk volume fractions of the suspension is performed at the channel entrance where the particles of the suspensions are uniformly distributed. The entrance length L is the characteristic length for which the particle concentration profile 共x , z兲 reaches steady state. We follow a method similar to that of Hampton et al.18 and described by Semwogerere et al.:11 at several positions downstream, we measure a scalar evolution parameter E p, which grows as the particle concentration becomes increasingly nonuniform. E p is plotted as a function of the downstream distance and fitted to an exponential whose characteristic growth rate is used as the definition of the entrance length. The evolution parameter is defined for each species as
Author complimentary copy. Redistribution subject to AIP license or copyright, see http://phf.aip.org/phf/copyright.jsp
043306-4
Phys. Fluids 20, 043306 共2008兲
D. Semwogerere and E. R. Weeks −X/L Efit 兲 + ␣2 , p 共X兲 = ␣1共1 − e
共3兲
where X = x / H is the dimensionless distance from the inlet and ␣1, ␣2 are the other fitting parameters. To graphically compare the evolution of different suspensions, the plots of E p vs x / H are normalized so that ˜E p共⬁兲 = 1. That is, ˜Efit共X兲 = Efit共X兲/共␣ + ␣ 兲. 1 2 p p
FIG. 3. Cross-stream concentration profiles showing downstream enrichment of the channel center by large and small particles of a flowing binary suspension. 共a兲 Center enrichment by the large particles at x / H = 1600 for 共large , small兲 = 共0.10, 0.10兲. 共b兲 Center enrichment by the small particles for suspension 共large , small兲 = 共0.10, 0.25兲 at x / H = 1850. 共c兲 Comparison of the small particles in binary suspension 共0.10,0.10兲 with monodisperse suspension 共0.0,0.10兲 at x / H = 1600. 共d兲 Comparison of the large particles in binary suspension 共0.10,0.25兲 with monodisperse suspension 共0.10,0.0兲 at x / H = 1850.
E p共x兲 =
1 2H
冕 冏 2H
0
冏
共x,z兲 ref共z兲 − dz, 具共x,z兲典z 具ref共z兲典z
共2兲
where ref共z兲 ⬅ 共x = 0 , z兲 is the concentration profile at the inlet, 具共x , z兲典z is the local cross-sectional average volume fraction, and 2H is the width of the channel. All volume fractions are for a particular species, so that the evolution of each species can be separately tracked. E p共x兲 is zero if no migration occurs but grows with x from the inlet if particle migration alters the concentration profile of the initially uniform suspension. Note that downstream, as particles migrate toward the faster-flowing channel center, the cross-sectional average volume fraction 具共x , z兲典z decreases to maintain the same total particle flux as the inlet, where 共x = 0 , z兲 is uniform. The plot in Fig. 4共a兲 of E p versus distance from the channel inlet for a monodisperse suspension is typical; it shows that the concentration profile asymptotically approaches a steady state. The exponential function that is fitted 共dashed line兲 to the plot is
FIG. 4. Plots of the 共a兲 unnormalized and 共b兲 normalized evolution parameters for large particle suspensions 共0.10,0兲 and 共0.15,0兲. Entrance lengths are L共0.10, 0兲 = 400⫾ 150 and L共0.15, 0兲 = 250⫾ 10.
共4兲
The normalization does not affect the shape and entrance length of the plot. That the 共0.15,0兲 suspension of large particles more quickly evolves than the 共0.10,0兲 volume fraction suspension is more clearly seen in the normalized plot of Fig. 4共b兲 than in the unnormalized plot of Fig. 4共a兲; see also Table I. The shorter entrance length for the higher volume fraction monodisperse suspension is consistent with findings of earlier experimental works11,18 and consistent with Eq. 共1兲. Additionally, as expected, the particle size dependence of shearinduced particle migration means that the corresponding monodisperse suspensions of smaller particles have longer entrance lengths;1,11,18 see Table I. III. RESULTS
The main results are the downstream partial segregation of initially uniformly mixed large and small particles. Figure 3共a兲 clearly shows that the large particles disproportionately populate the center of the channel for a suspension composed of equal volume fractions of large and small particles. Figure 3共b兲 shows the opposite: downstream enrichment at the center by small particles—this time with binary suspension 共0.10,0.25兲. The center enrichment by one size species is not because the other species is too dilute to result in appreciable migration. This is illustrated in Figs. 3共c兲 and 3共d兲, where we compare the nonenriching species with their monodisperse counterparts. In Fig. 3共c兲, the small particles in 共0.10,0.10兲 have a dip in their concentration at the center compared to the small particles in monodisperse suspension 共0.0,0.10兲. They also have a larger concentration near the channel walls. In Fig. 3共d兲, the large particles of binary suspension 共0.10,0.25兲 show no measurable migration to the center, while the large particles of monodisperse suspension 共0.10,0.0兲 have a large central peak in their concentration. Earlier studies16,17 observed that the center enrichment of large particles is due to the particle size scaling of shearinduced migration. The effective cross-stream diffusion for monodisperse suspensions migration is found to depend on particle radius a as a2.1,13 Figure 5 shows the faster migration of the large particles for equal concentrations of large and small particles. By tracking the evolution of the concentration profiles of the two species, that size segregation is indeed a result of the quicker migration of the large particles to the center than that of the small particles is suggested. The large particles reach a high enough local volume fraction that they effectively block out the small ones, which accumulate around z ⬇ 20 m and z ⬇ 30 m for suspension 共0.10,0.10兲. These z values correspond to a sharp increase in the volume fraction of large particles from approximately 0.1 to 0.2. Lyon and Leal17 studied non-Brownian binary particle suspensions and observed that for low enough fraction of
Author complimentary copy. Redistribution subject to AIP license or copyright, see http://phf.aip.org/phf/copyright.jsp
043306-5
Shear-induced particle migration
Phys. Fluids 20, 043306 共2008兲
FIG. 5. Plots of the cross-stream concentration profile of both the small and large particles for binary suspension 共0.10,0.10兲. The downstream evolution of the profile is evident with increasing values of x / H, as is indicated; H is the half-width of the channel. The z axis is as defined in Fig. 1. For this experimental run, the large particle entrance length is LL / H = 400⫾ 150.
FIG. 6. 共a兲 Plot of entrance length vs volume fraction for monodisperse suspensions of the large 共radius aL = 1.5 m兲 and small 共radius aS = 0.7 m兲 particles. The plots were derived from the computations outlined by Semwogerere et al. 共Ref. 11兲. 共b兲 Phase space for particle enrichment for the binary suspension of small particles and large particles. The solid line represents an estimate, using Eq. 共1兲, of the line of equal entrance lengths of monodisperse suspensions of the two particle species; see text for details. The dot-dashed line is obtained from the computations of part 共a兲. Above each line, LL ⬍ LS and thus the large particles are predicted to enrich the center, while below each line, the converse is true. The three crosses are the positions in phase space for the three different binary suspensions used 共see Table I兲.
large particles, enough small particles migrate to the center that they maintain their proportion at the center. That is, in that case, there was no center enrichment by the large particles. We see this for our Brownian suspensions as well, as shown in Fig. 3共b兲; in fact, here we see that lowering the large particle fraction yet further results in center enrichment by the small particles. Thus, particle volume fraction also influences size segregation. Our data suggest that for high-Pe flows, the entrance length is the main factor that determines which species enriches the center of the channel in flowing binary suspensions. The species that migrates to the center fastest as a monodisperse suspension is the species that enriches the center in the binary mixture. The two main parameters that affect the entrance length are the suspension volume fraction and the particle radius a 关as indicated by Eq. 共1兲兴.1,4,11,14,18 Thus, for a binary suspension of particles with fixed small radius aS and large radius aL, a volume fraction phase space that predicts the volume fraction combinations that result in large particle enrichment or small particle enrichment can be constructed. Figure 6 shows such a phase space for our suspension with aS = 0.7 m, aL = 1.5 m, and the flow rate matched to the experimental condition. The solid line in Fig. 6共b兲 is estimated by using Eq. 共1兲 and the expression for d共兲 from Refs. 3 and 15. The other lines in each plot are based on monodisperse entrance length measurements and computations outlined in Ref. 11. For flows in which Brownian motion is important, the entrance length may not be enough to predict which particles populate the center. In that case, the shape of the fully developed concentration profile is important. The determining factor, as in the high-Pe-flow case, is which particle species develops a substantial enough presence in the channel center first. However, in the low-Pe case, this does not necessarily correlate with entrance length. When the flow rate is such that Pe⬍ 100, Brownian motion substantially reduces particle migration to the channel center.11,13 Since migration is
strain dependent, there is a corresponding reduction in entrance length.15 For a large enough difference in particle size, the small particle entrance length can be made shorter than that of the larger particles by lowering the flow rate. However, the resulting central peak in the small particle concentration profile may not be substantial enough to prevent migration of the large particles. Thus, even though the small particles would have a shorter entrance length, the large particles would still likely enrich the center. The line that separates the regions of large and small particle enrichments in Fig. 6 is dependent on the ratio of particle sizes. Thus, in the extreme case that the sizes are nearly equal, it would be expected that the line is close to L = S; in the case that the small particles are much smaller than the large particles, S Ⰷ L would be required to see the small particles enrich the center. If the trend of the phase boundary does not radically change as the total volume fraction is increased, then there will be a minimum L that precludes small particle enrichment of the center. That is, given a particular set of particle sizes, there is a L for which large particles will always enrich the center since the required S for small particle enrichment is above the maximum allowed volume fraction. The phase boundary was not extended to lower than total ⬇ 0.1 since the computations used to determine the boundary are not valid at very low volume fractions. Moreover, particle migration at very low total volume fractions is very weak and may not lead to significant size segregation, if at all, since the interparticle interactions are rare. The phase boundary may follow a different trend than in Fig. 6共b兲 for large total volume fractions 共say, total ⲏ 0.4兲. In that case, using the monodisperse entrance lengths may be too crude a method in determining the boundary. For the relatively low total volume fractions we have studied, the estimate of the boundary may be sufficient to first order because interactions between the two species are not strong—at least for the enriching particles. That is, if the monodisperse
Author complimentary copy. Redistribution subject to AIP license or copyright, see http://phf.aip.org/phf/copyright.jsp
043306-6
Phys. Fluids 20, 043306 共2008兲
D. Semwogerere and E. R. Weeks
FIG. 7. Plots that compare the evolution of a single particle species in a binary suspension to that of its monodisperse counterpart, along with comparison of downstream concentration profiles. The open symbols represent the monodisperse suspension, and the closed symbols represent the same species in the binary suspension. The dashed lines are exponential fits to the experimental data. 共a兲 Downstream growth of the normalized evolution parameter for large particles in binary suspension 共0.10,0.10兲 and monodisperse suspension 共0.10,0.0兲. The corresponding entrance lengths are LL共0.10, 0.10兲 = 400⫾ 150 in the binary suspension and LL共0.10, 0兲 = 490⫾ 40 in the monodisperse suspension. 共b兲 Their downstream concentration profiles at x / H = 1600. 共c兲 Downstream evolution of the small particles in binary suspension 共0.10,0.25兲 and monodisperse suspension 共0.0,0.25兲. Their entrance lengths are LS共0.10, 0.25兲 = 200⫾ 40 and LS共0.0, 0.25兲 = 350⫾ 30. 共d兲 Their downstream concentration profiles at x / H = 1050 for the monodisperse suspension and x / H = 1360 for the binary suspension.
small particles have a shorter entrance length than that of the large particles, the interactions, when they are mixed in a binary suspension, are not sufficient to reverse that, and vice versa. Weak interactions were also noted by Lyon and Leal17 for suspensions 共0.30,0.10兲 and 共0.22,0.07兲 with large:small particle size ratio of 3.5:1; they observed that the small particles had little measurable influence on the large ones. However, at more dense total volume fractions, the interactions between the two species may substantially affect their entrance lengths, although we expect that LL ⬎ LS would remain true. Nevertheless, size segregation does occur even at very high volume fractions, as observed by Husband et al. in Ref. 16, where large particles migrated to the center for total volume fractions of 0.6 and over. The weakness of the interactions between the two particle species for relatively dilute suspensions 共total ⱗ 0.3兲 is illustrated by studying the entrance length. For suspension 共0.10,0.10兲 whose total volume fraction is 0.20, the enriching species is the large particles. Its entrance length is LL共0.10, 0.10兲 = 400⫾ 150 in the binary suspension, while it is approximately the same in the monodisperse suspension, which is at half the total volume fraction: LL共0.10, 0兲 = 490⫾ 40 关Fig. 7共a兲兴. Moreover, the large concentration profile is virtually unchanged by the addition of the small particles, as shown by the two curves in Fig. 7共b兲. A monodisperse suspension of large particles at the L = 0.2 would have a taller peak. For more dense volume fractions 共total ⲏ 0.3兲, the effects of the nonenriching species become more significant.
For binary suspension 共0.10,0.25兲, the entrance length of small particles is significantly shorter than that of small particles in the monodisperse suspension: LS共0.10, 0.25兲 = 200⫾ 40 compared to LS共0.0, 0.25兲 = 350⫾ 30. That is, the small particles in 共0.10,0.25兲 seem to see the larger total volume fraction when the large particles are added. Additionally, the concentration profiles in the two suspensions are slightly different 关Fig. 7共d兲兴, with the peak in the binary suspension being slightly taller than that in the monodisperse suspension, suggesting enhanced migration to the center. The entrance lengths were not measured for the nonenriching species in the binary suspensions because their shapes were distinctly different than those in the monodisperse case. Thus, a meaningful comparison is not possible. Also, because of their limited migration 关small values of E P, see Eq. 共2兲兴, measurements of the entrance length result in large uncertainties in their values. The entrance length measurements show that in these experiments, the segregated concentration profiles are nearly fully developed. The exponential nature of the evolution of E p for both large and small particles 关see Figs. 7共a兲 and 7共b兲, for example兴 suggests that substantial further migration downstream of the particle concentration profiles is unlikely. That is, we do not expect either the composition of the particles in the center or the particle distributions to significantly change farther downstream. IV. CONCLUSIONS
We have studied the flow of binary suspensions of Brownian particles flowing through narrow capillary tubes. We measure the detailed concentration profiles of both particles species and follow the evolution of these profiles downstream from the entrance to the tube. In each case, one of the particle species migrates to the center of the tube, while the other species does not. The migrating species appears to be determined by the species which would have the shorter entrance length were the other species not present. The migrating species always relatively quickly moves to the center and then seems to screen out the other species from the center. Thus, by tuning the particle sizes and relative volume fractions, either the larger or the smaller particles are able to migrate to the center. To some extent, the “screening out” caused by the center-enriching species is likely dependent on that species reaching a suitably large volume fraction in the center; it seems plausible that for two sufficiently dilute species, both could migrate, although in a dilute suspension, migration is minimal to begin with.13 In our experiments, the screening appears to be unlikely due to an insufficiently developed concentration profile of the slower migrating species: our entrance length data suggest that the particle profiles were tracked to nearly full development. However, we cannot rule out the possibility of further change on a very slow time scale 共equivalently, a length scale much longer than the 4000 half-widths of our flow channel兲. Nevertheless, such further changes are unlikely to be relevant for microfluidic applications. Along with our previous work,11 our findings suggest that there are several factors that encourage a short entrance
Author complimentary copy. Redistribution subject to AIP license or copyright, see http://phf.aip.org/phf/copyright.jsp
043306-7
length and thus determine the dominant species migrating to the center. A shorter entrance length is achieved by increasing the volume fraction and increasing the particle radius a.11 For two fixed particle sizes, by increasing for one of the species, that species is encouraged to the center. For fixed volume fractions of each species, by increasing the size of one particle species, that species will have a shorter entrance length and thus have its concentration enhanced in the center. These results may have important implications for microfluidic applications involving particle suspensions, in particular, where strong Brownian effects may be present, as in our experiments. Due to continuity, the total particle flux of each species is conserved across the cross-section area of the tube, which is independent of migration. However, if the output of the microchannel were to be split into several channels downstream, then this could potentially result in different relative concentrations of each species in the splitting channels. If the volume fractions or sizes of the species are available as control parameters, then this effect could be increased or diminished, as is desired. Our work also suggests that by tuning the parameters, it may be possible to find a sample where the two species equally migrate, thus preserving their relative concentration ratio. ACKNOWLEDGMENTS
We thank J. F. Morris for invaluable insight into particle migration and S. V. Franklin for developing the image analysis code that distinguishes the large and small particles. This material is based upon work supported by the National Science Foundation under Grant No. 0239109. 1
Phys. Fluids 20, 043306 共2008兲
Shear-induced particle migration
R. J. Phillips, R. C. Armstrong, R. A. Brown, A. L. Graham, and J. R. Abbott, “A constitutive equation for concentrated suspensions that accounts for shear-induced particle migration,” Phys. Fluids A 4, 30 共1992兲. 2 C. J. Koh, P. Hookham, and L. G. Leal, “An experimental investigation of concentrated suspension flows in a rectangular channel,” J. Fluid Mech. 266, 1 共1994兲. 3 M. K. Lyon and L. G. Leal, “An experimental study of the motion of concentrated suspensions in two-dimensional channel flow. Part 1.
Monodisperse systems,” J. Fluid Mech. 363, 25 共1998兲. P. R. Nott and J. F. Brady, “Pressure-driven suspension flow: Simulation and theory,” J. Fluid Mech. 275, 157 共1994兲. 5 J. F. Morris and J. F. Brady, “Pressure-driven flow of a suspension: Buoyancy effects,” Int. J. Multiphase Flow 24, 105 共1998兲. 6 P. Rose and N. Walker, “The influence of pigment selection on particle size and migration stability in aqueous inkjet inks,” in IS&T’s NIP19: International Conference on Digital Printing Technologies, Society for Imaging Science and Technology, New Orleans, 2003, Vol. 19, p. 190. 7 C. Lareo, C. A. Branch, and P. J. Fryer, “Particle velocity profiles for solid-liquid food flows in vertical pipes. Part I. Single particles,” Powder Technol. 93, 23 共1997兲. 8 K. L. McCarthy and W. L. Kerr, “Rheological characterization of a model suspension during pipe flow using MRI,” J. Food. Eng. 37, 11 共1998兲. 9 R. M. Jendrejack, D. C. Schwartz, J. J. de Pablo, and M. D. Graham, “Shear-induced migration in flowing polymer solutions: Simulation of long-chain DNA in microchannels,” J. Chem. Phys. 120, 2513 共2004兲. 10 Y. Ding and D. Wen, “Particle migration in a flow of nanoparticle suspensions,” Powder Technol. 149, 8492 共2005兲. 11 D. Semwogerere, J. F. Morris, and E. R. Weeks, “Development of particle migration in pressure-driven flow of a Brownian suspension,” J. Fluid Mech. 581, 437 共2007兲. 12 I. E. Zarraga and D. T. Leighton, “Measurement of an unexpectedly large shear-induced self-diffusivity in a dilute suspension of spheres,” Phys. Fluids 14, 2194 共2002兲. 13 M. Frank, D. Anderson, E. R. Weeks, and J. F. Morris, “Particle migration in pressure-driven flow of a Brownian suspension,” J. Fluid Mech. 493, 363 共2003兲. 14 R. M. Miller and J. F. Morris, “Normal stress-driven migration and axial development in pressure-driven flow of concentrated suspensions,” J. Non-Newtonian Fluid Mech. 135, 149 共2006兲. 15 D. T. Leighton and A. Acrivos, “The shear-induced migration of particles in concentrated suspensions,” J. Fluid Mech. 181, 415 共1987兲. 16 D. M. Husband, L. A. Mondy, E. Ganani, and A. L. Graham, “Direct measurements of shear-induced particle migration in suspensions of bimodal spheres,” Rheol. Acta 33, 185 共1994兲. 17 M. K. Lyon and L. G. Leal, “An experimental study of the motion of concentrated suspensions in two-dimensional channel flow. Part 2. Bidisperse systems,” J. Fluid Mech. 363, 57 共1998兲. 18 R. E. Hampton, A. A. Mammoli, A. L. Graham, and N. Tetlow, “Migration of particles undergoing pressure-driven flow in a circular conduit,” J. Rheol. 41, 621 共1997兲. 19 A. Nir, A. Shauly, and A. Wachs, “Shear-induced particle migration in a polydisperse concentrated suspension,” J. Rheol. 42, 1329 共1998兲. 20 L. Antl, J. W. Goodwin, R. D. Hill, R. H. Ottewill, S. M. Owens, S. Papworth, and J. A. Waters, “The preparation of methylmethacrylate lattices in nonaqueous media,” Colloids Surf. 17, 67 共1986兲. 4
Author complimentary copy. Redistribution subject to AIP license or copyright, see http://phf.aip.org/phf/copyright.jsp