Downloaded from ascelibrary.org by Tongji University on 05/05/16. Copyright ASCE. For personal use only; all rights reserved.
Tunneling and Underground Construction GSP 242 © ASCE 2014
Shear strength between Soil/Geomembrane and Geotextile/Geomembrane Interfaces Shi-Jin Feng 1 and Dong Cheng 2 1
Professor, Department of Geotechnical Engineering, Key Laboratory of Geotechnical and Underground Engineering of Ministry of Education, Tongji University, Si Ping Road 1239, Shanghai 200092, China; email:
[email protected] 2 Graduate Student, Department of Geotechnical Engineering, Key Laboratory of Geotechnical and Underground Engineering of Ministry of Education, Tongji University, Si Ping Road 1239, Shanghai 200092, China ABSTRACT: A series of laboratory tests were carried out to investigate the shear strength between geomembrane/geotextile and geomembrane/soil interfaces. These tests were conducted with a new test method which enabled repeating shear between soil body and cover system components under various normal stresses. The reduction of peak and residual shear strengths of the interface were investigated by conducting the test repeatedly on a same geomembrane/geotextile interface under constant normal stress. The stacking process of the landfill was simulated by testing interface samples under increasing normal stresses. The analysis results obtained from the tests demonstrate significant variation of the interface strength. INTRODUCTION Safe disposal of municipal wastes using engineered landfills has been receiving increasing attentions over the years. In order to prevent the migration of leachate and keep landfill gas under control, specially designed liner and cover composite systems should be placed at the base and the top of a landfill. These liner systems usually consist of compacted soil with low permeability and geosynthetic materials. The shear resistance between soil body and geosynthetic has been proved to be the major challenge in landfill design. The stability of these liner systems is controlled by the shear strength of each material layer and the various interfaces between contact layers in the system (Stark et al., 2012). Both the overall slope stability and the integrity of the geosynthetics are
Tunneling and Underground Construction
558
Downloaded from ascelibrary.org by Tongji University on 05/05/16. Copyright ASCE. For personal use only; all rights reserved.
Tunneling and Underground Construction GSP 242 © ASCE 2014
dependent on the shear strength at the interface between the various materials. The Kettleman Hills failure has caught researchers’ attention. Many laboratory test techniques have been introduced to study the peak and post-peak shear strength behavior of these components (Hisham T. Eid., 2011). Most of these techniques utilize either the standard or large direct shear box in which shearing is conducted regardless of the time factor, namely, that the shear failure along the gap between the upper and lower halves happens only once. However, in the cases of long construction period, modern engineered landfills are different from other geotechnical engineering programs, one of which is that the normal stress increases along with the rising overall volume of waste, which made these techniques less applicable to landfills. A study of the interactive shear strength behavior of liner system components as well as that of cover system components are presented in this paper. This study is carried out using a laboratory test apparatus and a new test method by which interfaces between these liner or cover system components would be used for several times under various normal stresses to explore the actual shear stress of the interfaces in engineered landfills. The effects of this behavior at different normal stress levels are also discussed. DESCRIPTION OF MATERIALS Textured high density polyethylene (HDPE) geomembrane, constructed by specifically formulated high-quality resin, was used for the tests. The geomembrane is co-extruded on one side. Nonwoven geotextiles used in the test, with a density of 400 g/m2,are made of polypropylene fiber and produced by GSE. The liner system of the landfill was simulated using soil sample with liquid limit (LL), plasticity index (PI) of 41.9, 23% respectively. The moisture content (w) is 30% and the unit weight (γ) is 16.5kN/m3. The soil is classified as silty clay with silty sand according to the Shanghai soil classification system. Soils of these type exhibit the low permeability, shrinkage potential, reasonable shear strength and workability that are necessary for MSW landfill liners. TEST APPARATUS AND PROCEDURE Test apparatus The tests were conducted using a large direct shear test device, with a dimension of 400 mm × 600 mm. The device consists of upper and lower parts. The upper part of the shear box is fixed during the tests and the movement of the lower box in the horizontal direction is controlled by a precise oil pressure control system. Normal load is applied by a steel plate. Considering the impact of area loss of shear plane, a limit of 40 mm is set as the maximum shear displacement to capture the post-peak behavior.
Tunneling and Underground Construction
559
Downloaded from ascelibrary.org by Tongji University on 05/05/16. Copyright ASCE. For personal use only; all rights reserved.
Tunneling and Underground Construction GSP 242 © ASCE 2014
Geomembrane/geotextile test procedure The geomembrane samples are cut into rectangles with a size of 565 mm × 365 mm (inside), placed either in the machine direction or at right angles to it. The effect of surface moisture on the interface shear strength has been described by Seed et al. (1988). All the geomembrane samples were wiped with a hand towel prior to tests. A wood plate overlain by a thin steel plate is put into the lower container to provide support for the geomembrane. For each test, a 1.5 mm thick textured HDPE geomembrane is glued to the surface of the thin steel plate. The geotextiles used were cut either in the machine direction or at right angles to it, and punched for clamping. The geotextiles are placed on the top of the geomembranes and clamped to the top box by four bolts. For the co-extruded textured geomembranes, a piece of thin plastic sheet is placed between geotextile and geomembrane to prevent any disturbance of the geotextile fibers, and removed before lowering the top container into position. A total of four geomembrane/geotextile interface samples are tested. To investigate the reduction of maximum and residual shear strength of the interface, three samples are tested for three times under a constant normal stress of 50, 100, 200 kPa, respectively. The rest one sample is tested under a increasing normal stress with the order of 50, 100 and 200 kPa. This is to simulate the increasing load of waste during the landfill construction process. Geomembrane/clay test procedure Six direct shear tests were conducted on geomembrane/clay samples. The specimen (lower) container is filled with compacted soil. Drainage line is open during the test. Before shearing, the normal stress is held constant for 30 min and adjusted to complete the consolidation of the soil sample if needed. Five of the specimens are tested for three times under a constant normal stresses of 20, 50, 100, 200 and 300 kPa respectively. The last interface sample is sheared for three times at increasing normal stress from 50 to 100 and to 200 kPa. A shearing rate of 1mm/min is used for all tests according to the rate requirements specified by ASTM D5321. Displacements and shear forces are recorded at specified time intervals (usually 0.5s) to ensure that the peak shear force can be measured. TEST RESULTS Geomembrane/geotextile shearing curves In order to capture both the peak and post-peak behavior of the sample, test data will be continuously measured until 40 mm shear displacement takes place. The stress-deformation results from the test, are presented in Fig 1. Before reaching the peak shear strength, shear stress increases with the increasing shear displacement. Once the peak strength is reached, a contact strength reduction of the shearing resistance’s designed value takes place. This strain softening behavior
Tunneling and Underground Construction
560
Tunneling and Underground Construction GSP 242 © ASCE 2014
561
is evident at all three applied normal stresses. 40
50 50kPa(1) 50kPa(2) 50kPa(3)
35
Shear stress/kPa
40
25 20 15 10
30 20 100kPa(1) 100kPa(2) 100kPa(3)
10
5 0
0
10
20
30
40
0
50
0
10
Displacement/mm
20
30
40
50
Shear displaecement/mm
80 80
50kPa (1) 100kPa(2) 200kPa(3)
70 60
60
Shear stress/kPa
Shear stress/kPa
Downloaded from ascelibrary.org by Tongji University on 05/05/16. Copyright ASCE. For personal use only; all rights reserved.
shear stress/kPa
30
40 200(1) 200(2) 200(3)
20
0
0
10
20
30
40
Shear displacement/mm
50 40 30 20 10
50
0
0
10
20
30
Shear displacement/mm
40
50
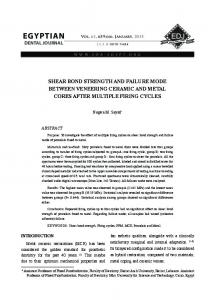
FIG. 1. Geomembrane/geotextile interface shear strength in dependence on samples’ displacement, r, tested under values of constant normal stress σ equalled 50, 100 and 200 kPa. The peak shear strength of textured geomembranes typically occurs at a displac ement much greater than that of the smooth geomembranes. Peak shear strength are reached at a displacement between 5 and 10 mm, depending on the magnitude of applied normal stress. For the curves of 50 kPa and 200 kPa normal stress, the co-extruded geomembrane/geotextile interface exhibits a strain softening behavior with the shear stress reducing by 20% ~ 30% at displacements around 40 mm. The curves of 100 kPa normal stress show a lower degree of strain softening than the other two tests with about 15% ~ 20% reduction of shear strength. Most tested interface contacts reach peak strength at a relatively higher displacement when they are sheared for the first time. As for the second and third time shearing tests, the peak strength is reached at much smaller displacement. It can be concluded that in all the tests, increasing shearing time will decrease peak and residual shear strength of the geotextile-textured/ geomembrane interface All the tests results about the peak and residual shear stress are summarized in Table 1. Taking the tests under 200 kPa normal stress for example, the peak strength values for the first shear test is 81.21 kPa and the residual value is 60.25 kPa. And for the second and third time tests, the peak stress values decrease down to 71.07 kPa and 70.44 kPa with residual stress values 54.3 kPa and 52.5 kPa respectively.
Tunneling and Underground Construction
Tunneling and Underground Construction GSP 242 © ASCE 2014
562
Geomembrane/geotextile shear strength The peak and residual shear strength of textured HDPE geomembrane/geotextile interface are plotted against the normal stresses in Fig 2. The linear regression fits of the first shearing test give a peak friction angle of 19.8° and a residual angle of 14.8°. Both the peak and residual friction decrease as the number of shearing times increases. For each regression line, values of the interface friction angle and adhesion are obtained using Eq(peak) or Eq(residual). Table 1 gives a summary of strength results of all geomembrane-geotextile interface shear tests. The experimental data reported in literature (Stark et al., 1996; Jones and Dixon, 1998) and investigation (Bacas, 2009) show that the most textured geomembrane-nonwoven geotextile interfaces present a residual friction angle between 10° and 14°, which meets up with the results in this study well. The variation of geomembrane/geotextile interface’s friction angle at peak and friction angle at residual strength with shear times are shown in Fig. 3. Since the friction under increasing normal stress has a similar value with the second and third time results, that is, 17.48° to 18.07°, and 17.45°, which suggests that for textured geomembrane/geotextile interface when a first relative displacement happens at the interface, the shear strength would decrease significantly but then the decreasing line starts to be much more gentle. 90
90 80
Y =9.46965+0.36007 X (peak)
80
Y =7.06414+0.32614 X (peak)
70
Y =8.585+0.26487 X (residual)
70
Y =6.75+0.244 X (residual)
Shear stress/kPa
Shear stress/kPa
Downloaded from ascelibrary.org by Tongji University on 05/05/16. Copyright ASCE. For personal use only; all rights reserved.
During the process of tests, it can be concluded that, in practice, the HDPE geomembrane texture has no obvious change after the first shearing test, meanwhile the surface of geotextile have changed much and become much more smooth and neat. Therefore the decrease of peak and residual shear strength may be attributed to this flattening effect of the nonwoven geotextile.
60 50 40 30
1st shear test/peak 1st shear test/residual
20 10
40
80
120 Normal stress/kPa
160
60 50 40 30 2st shear test/peak 2st shear test/residual
20 10
200
40
80
120 Normal stress/kPa
Tunneling and Underground Construction
160
200
Tunneling and Underground Construction GSP 242 © ASCE 2014
90
80
Y =8.9733+0.31432 X (peak)
80
Y =10.0898+0.31482 X (peak)
70
Y =8.5+0.22857 X (residual)
70
Y =7.94+0.24206 X (residual)
Shear stress/kPa
Shear stress/kPa
90
60 50 40 30 3st shear test/peak 3st shear test/residual
20 10
40
80
120
160
FIG. 2.
60 50 40 30
50-100-200 peak 50-100-200 residual
20 10
200
40
Normal stress/kPa
80
120
160
200
Normal stress/kPa
Geomembrane/geotextile interface shear strength envelopes 22 peak residual
20 Friction angle/degree
Downloaded from ascelibrary.org by Tongji University on 05/05/16. Copyright ASCE. For personal use only; all rights reserved.
563
18 16 14 12
1
2
3
Shear times
FIG. 3. Variation of geomembrane/geotextile interface friction angle at peak and friction angle at residual strength with shear times Table 1.
Geomembrane/geotextile interface shear strength
Shear strength Shear times
Peak strength
Residual strength
Friction angle
cohesion
Friction angle
cohesion
1st
19.80
9.47
14.84
8.59
2st
18.07
7.06
13.71
6.75
3st
17.45
8.97
12.88
8.50
Increasing normal stress model
17.48
10.09
13.61
7.94
Geomembrane/Clay shearing curves Figure 4 shows stress-deformation curves for a geomembrane/soil interface under values of normal stress (σ) equaled 20, 50, 100, 200 and 300 kPa. The test processes are similar to the experiments mentioned above. For test specimens that simulate typical liner systems, a soil with liquid limit, plasticity index of 41.9, 23%, respectively is utilized. The soil's moisture content is 30% with a unit weight of 16.5 kN/m3. Shear displacements are applied 15 minutes after imposing the normal load. No drainage line is open at the bottom of the soil sample, and the
Tunneling and Underground Construction
564
only drainage line is at the lateral edges. Since the dimension of the test device is 400×600 mm, the lateral drainage path length is determined as 200mm. The rate of shearing is 1.00mm/s, which was high enough and the test can be regarded as undrained. It can be seen from Fig. 4 that most peak interface shear strength are reached at very small shear displacements, and there is an obvious post-peak shear strength reduction. During the shear strength tests of clay and geomembrane which have been sheared for three times under 200 kPa normal stress, peak strength values for the first shear test is 30.90 kPa and the residual value is 25.8 kPa; While for the second and third times tests, the peak strength values decrease down to 27.05 kPa and 26.14 kPa with 22.52 kPa and 22.57 kPa of the residual stress values. 10
12 20kPa(1) 20kPa(2) 20kPa(3)
10 Shear stress/kPa
Shear stress/kPa
8 6 4 2 0
8 6 4
50kPa(1) 50kPa(2) 50kPa(3)
2
0
10
20
30
40
0
50
0
10
25 100kPa(1) 100kPa(2) 100kPa(3) Shear stress/kPa
Shear stress/kPa
40
50
30
15 10 5
0
10
20
30
40
20
0
50
200kPa(1) 200kPa(2) 200kPa(3)
10
0
10
Shear displacement/mm
30
60
25 Shear stress/kPa
50 40 30
300kPa(1) 300kPa(2) 300kPa(3)
20 10 0
10
20
30
Shear displacement/mm
20
30
40
40
50
Shear displacement/mm
70
0
30
40
20
0
20
Shear displacement/mm
Shear displacement/mm
Shear stress/kPa
Downloaded from ascelibrary.org by Tongji University on 05/05/16. Copyright ASCE. For personal use only; all rights reserved.
Tunneling and Underground Construction GSP 242 © ASCE 2014
50kPa(1) 100kPa(2) 200kPa(3)
20 15 10 5
50
0
0
10
20
30
Shear displacement/mm
40
50
FIG. 4. Geomembrane/clay interface shear strength in dependence on sample displacement, r, tested under values of normal stress σ equalled 20, 50, 100, 200, 300 kPa.
Tunneling and Underground Construction
Tunneling and Underground Construction GSP 242 © ASCE 2014
565
Fig. 5 presents the stress-deformation comparison between different samples. Except for some differences in peak stress under normal pressure 100 and 200 kPa, similar shear curves are obtained from the interface shearing under constant normal stress mode and under increasing normal stress mode which indicates that the conclusion drawn above in the geomembrane/geotxtile section is still suitable for application to geomembrane/clay interface shearing.
50 constant 50 increase 100 constant 100 increase 200 constant 200 increase
35
Shear stress /kPa
30 25 20 15 10 5 0
0
10
20
30
40
shear displacement / mm
FIG. 5. The comparison between results obtained from shearing tests under constant normal stress and increasing normal stress Geomembrane/geotextile shearing strength Fig. 6 provides the peak and residual shear strength envelopes for the interface test results represented in Fig. 4. As normal stress increases, there is a significant growth in shear strength, which is different from the test results provided by Filz (2001). This indicates that the increase of shear strength exists only in the initial stage and this increase in shear strength tapers off when under higher normal stress. For each regression lines, values of interface friction angle and adhesion are obtained using Eq(peak) or Eq(residual). As presented in Fig. 7, the friction angles of geomembrane/clay interface varies with number of shear tests. 70
70
60
Y =0.30951+0.18849 X (peak)
60
Y =0.41396+0.15962 X (peak)
50
Y =0.24526+0.15145 X (residual)
50
Y =0.3811+0.12992 X (residual)
Shear stress/kPa
Shear stress/kPa
Downloaded from ascelibrary.org by Tongji University on 05/05/16. Copyright ASCE. For personal use only; all rights reserved.
40
40 30 20 1st shear test/peak 1st shear test/residual
10 0
0
50
100
150
200
Normal stess/kPa
250
40 30 20 2st shear test/peak 2st shear test/residual
10 0
300
0
50
Tunneling and Underground Construction
100
150
200
Normal stress/kPa
250
300
Tunneling and Underground Construction GSP 242 © ASCE 2014
566
60
Y =0.11847+0.1583 X (peak)
50
Y =0.24771+0.1302 X (residual)
30 20
0
Y =3.69445+0.12474 X (peak) Y =2.41+0.09423 X (residual)
40
20
10 50-100-200 peak 50-100-200 residual
3st shear test/peak 3st shear test/residual
10 0
50
100
150
200
250
0
300
0
50
100
Normal stress/kPa
150
200
250
Normal stress/kPa
FIG. 6. Geomembrane/clay interface shear strength envelopes 12 peak residual
11 Friction angle/degree
Downloaded from ascelibrary.org by Tongji University on 05/05/16. Copyright ASCE. For personal use only; all rights reserved.
30
Shear stress/kPa
Shear stress/kPa
70
10 9 8 7 6
1
2
3
Shear times
FIG. 7. Variation of geomembrane/clay interface peak and friction angle with number of shear tests There exists an obvious jump of the friction angles between the first and the consecutive two tests, while the results from the second and third tests are almost the same. Compared with the first test, in the second test, friction angles decrease by 15.00% and 14.05% for the peak and residual values, respectively. Additionally, cohesion maintain at a very low value, ranging from 0.118 to 0.414. Lower friction angle and higher cohesion are presented for the linear regression fits under increasing normal stress shear model, which are shown in Table 2. Table 2.
Geomembrane-clay interface shear strength
Shear strength Shear times
Peak strength Friction angle
Residual strength
cohesion
Friction angle
cohesion
1st
10.67
0.31
8.61
0.25
2st
9.07
0.41
7.40
0.38
3st
9.00
0.12
7.42
0.25
11.26
16.71
5.38
2.41
Increasing normal stress mode
Tunneling and Underground Construction
Tunneling and Underground Construction GSP 242 © ASCE 2014
Downloaded from ascelibrary.org by Tongji University on 05/05/16. Copyright ASCE. For personal use only; all rights reserved.
DISCUSSION Interface shear strength envelopes The observations described above reveal that the interface shear strength can be expressed as a function of the normal stress by a modified Mohr-Coulomb criterion: It is assumed that slide to occur at an interface, the shear stress should overcome the frictional resistance which is determined by the effective normal stress imposed on the interface and the friction angle, together with a component c which is independent of the normal stress. Summary of strength parameters from the test programs is shown in Table 1 and 2. Peak shear strength As mentioned above, the shear stress versus shear displacement curves are obtained by conducting displacement-controlled shear tests at under constant normal pressures of 50, 100 and 200 kPa and increasing normal pressures as from 50 to 100 and to 200 kPa. In all the 12 cases, there is an initial increase in shear stress as soon as displacement occurs but later with a rapid increase as displacement grows. Either for interface of geomembrane-geotextile or geomembrane-clay, peak strengths are mobilized at displacement around 5 mm. The second and third repetition tests are conducted and the reduction of peak interface friction angles versus number of shear tests are shown in Fig. 3 and 7. Large strain interface shear strengths The strain softening properties of many geosynthetic interfaces indicates that the determination of the large strain shear strength is of particular importance. Large strain or residual shear strength of the geomembrane-geotextile interfaces have been obtained in these tests. Fig. 3 and Fig. 7 show the variation of geomembrane/geotextile interface and geomembrane/clay interface residual friction angles with shear times. More importantly, significant variability of measured strengths has been observed between test times, which indicates that the actual shear strengths of large strain interface in a liner system are even lower than the residual shear strengths obtained from different experiments when large displacement happens within the liner system. CONCLUSIONS This study illustrates the interactive shear strength behavior of the components typically utilized in MSW landfill liner systems. Geomembrane/geotextile and geomembrane/clay interfaces are prepared and tested in large direct shear apparatus to investigate the variation of the interface strength in repeating shear tests, which turns out to be rather significant according to analysis results. Finds of this paper can be summarized as follows:
Tunneling and Underground Construction
567
Downloaded from ascelibrary.org by Tongji University on 05/05/16. Copyright ASCE. For personal use only; all rights reserved.
Tunneling and Underground Construction GSP 242 © ASCE 2014
The shape of the shear stress versus displacement curves of the geomembrane /geotextile are similar to those of geomembrane-clay interface. The peak interface strength of co-extruded geomembrane/geotxtile are mobilized at small displacements (usually less than 2 mm). For the co-extruded geomembrane/clay interface, peak stresses are obtained at a displacement between 5 and 10 mm, depending on the magnitude of imposed normal stress. The co-extruded geomembrane/geotextile interface exhibits a strain softening behavior with the shear stress reducing by around 20% at shear displacements around 40 mm. As for geomembrane/clay interface, reduction of the stress values is about 15%. Most of the tested interface contacts reach peak strength at relatively higher displacement when they are sheared for the first time. As for the second and third time shearing tests, the peak strength are reached at nearly the same displacement. According to analysis results, in every test, the increasing shearing times has worsened both of these two kinds of interfaces for both peak and residual strength. Friction angles at peak and residual states, a great difference is found between the first shearing friction values and the second (or third) ones which decrease a lot. Consequently this constant value would be regarded as the real friction angle when large displacement happens within a liner system. ACKNOWLEDGEMENTS Most work described in this paper is supported by the National Natural Science Foundation of China under Grant Nos. 50708079, 40902079, 41072201 and 41172245, the National Basic Research Program of China (973 Program) under Grant No. 2012CB719803, the Shanghai Pujiang Program under Grant No. 11PJD021, the Fundamental Research Funds for the Central Universities, and the Kwang-Hua Fund for College of Civil Engineering, Tongji University. The writers would like to greatly acknowledge all these financial supports and express the most sincere gratitude. REFERENCES ASTM (2003). Standard test method for determining the coefficient of soil and geosynthetic or geosynthetic friction by the direct shear method. 2003 Annual Book of Standards, D5321, West Conshohocken, PA. Stark, T. D., Choi, H., Lee, C., & Queen, B. (2011). Compacted Soil Liner Interface Strength Importance. Journal of Geotechnical and Geoenvironmental Engineering, 138(4), 544-550. Jones, D. R. V., & Dixon, N. (1998). Shear strength properties of geomembrane/geotextile interfaces. Geotextiles and Geomembranes, 16(1), 45-71. Eid, H. T. (2011). Shear strength of geosynthetic composite systems for design of landfill liner and cover slopes. Geotextiles and Geomembranes, 29(3), 335-344.
Tunneling and Underground Construction
568
Downloaded from ascelibrary.org by Tongji University on 05/05/16. Copyright ASCE. For personal use only; all rights reserved.
Tunneling and Underground Construction GSP 242 © ASCE 2014
Ömer Bilgin, P. E., & Shah, B. (2010, February). Statistical Assessment of Repeatability of Soil‐Geomembrane Interface Shear Tests. ASCE. Koerner,R. M., Martin, J. P., and Koerner, G. R. (1986). Shear strength parameters between geomembranes and cohesive soils. Geotextiles and Geomembranes, 4(1), 21-23. Kim, D., & Frost, J. D. (2010, April). Shear Mechanisms at Geotextile-Geomembrane Interfaces. In Characterization and Behavior of Interfaces: Proceedings of Research Symposium on Characterization and Behavior of Interfaces, 21 September 2008, Atlanta, Georgia, USA (p. 107). IOS Press, Incorporated. Bacas, B. M., Konietzky, H., Berini, J. C., & Sagaseta, C. (2011). A new constitutive model for textured geomembrane/geotextile interfaces. Geotextiles and Geomembranes, 29(2), 137-148. Esterhuizen, J.J.B, Filz, G.M., Duncan, J.M., 2001. Constitutive behavior of geosynthetic interfaces. Journal of Geotechnical and Geoenvironmental Engineering 127(10), 834-840
Tunneling and Underground Construction
569