Oct 22, 2016 - A vibrant network of exportable services surrounding the Panama .... All these practices, presumably aimed at protecting Panamanian workers, ...
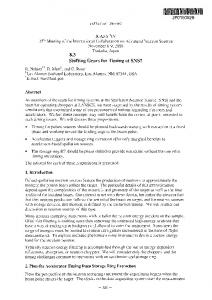
Shifting Gears: A GROWTH DIAGNOSTIC OF PANAMA
Ricardo Hausmann, Luis Espinoza and Miguel Angel Santos
CID Working Paper No. 325 October 2016 (Revised Jan. 2017)
Copyright 2016 Hausmann, Ricardo; Espinoza, Luis; Santos, Miguel Angel; and the President and Fellows of Harvard College
Working Papers Center for International Development at Harvard University
1
Executive Summary Panama has been one of the fastest growing economies in the world, duplicating its income per capita between 2004 and 2014. A vibrant network of exportable services surrounding the Panama Canal – ports, logistics, trade, communications, and financial services – has burgeoned. These activities have in turn spurred the demand for construction. Private non-residential developments – office buildings, warehouses, telecom infrastructure, shopping malls – have been complemented by large public infrastructure projects, such as the expansion of the Canal, the first line of the Panama City Metro, and the new terminal of Tocumen international airport. As a labor-intensive sector that relies mostly on non-skilled workers, the construction boom has effectively promoted a reduction in poverty and inequality. In parallel, an air hub has developed in Panama City, and many multinational companies have set foot in Panama under the umbrella of the Law of Multinational Headquarters (SEM). 1 A favorable business environment, a stable economy, and significant improvements in personal security, have been enhanced by fiscal and migratory benefits, attracting more than 120 regional headquarters of multinational companies. Within the context of such an impressive economic performance, there are two warning signals worth noticing. First, growth has decelerated since 2012. Deceleration is not necessarily a negative feature. It might be a signal of convergence to a steady state rate after such a long spell of growth acceleration. But it could also hint that some pillars of growth are subsiding. Construction, the spearhead of the large economic expansion, has been growing at a compounded annual rate of more than 18% for ten years, tripling its share within GDP over that period. Non-residential construction, the main driver of demand in construction in Panama, cannot grow indefinitely at a higher pace than the rest of the economy. First, because private non-residential construction responds to a demand for a stock of infrastructure coming from the modern service sector. Once that stock is in place, the flow of construction is expected to decelerate significantly. Second, to maintain the economic impulse stemming from developments such as the expansion of the Canal or the Metro of Panama City, would demand an unlikely flow of large public infrastructure projects. The second warning signal is income inequality. Amidst the income boom occurred in the previous decade, the distribution of income in Panama remains among the five most unequal in the world. Behind this feature there are some interesting dynamics. The large expansion registered in services and construction have come at the expense of other sectors such as manufacture and agriculture. The latter in particular, has seen its share within GDP go from 4.6% to 2.5% in ten years, and yet accounts for 16% of total employment. As a consequence, labor productivities in services and industry are higher than that of agriculture by a factor of seven. The construction boom has demanded non-skilled workers and absorbed some of the labor released by agriculture and fishing, 2 Law 41, passed on August, 2007, “Comisión de Licencias de Sedes de Empresas Multinacionales”, most commonly referred as Procter & Gamble law. 2 Agriculture and fishing accounted for 20% of employment back in 2005. 1
2
a fact that is most likely behind the improvement observed in inequality within these years. 3 Now that the construction boom is expected to decelerate, and a modern service sector demanding high skills is taking the lead on growth, there is a risk of losing some of the progress achieved in terms of poverty and inequality. Both of these warnings highlight the need to promote more complex economic activities in the capital and the remaining provinces of Panama. On one hand, there is a need to spur economic activities so that they takeover construction and allow Panama to continue growing at a sustainable pace. On the other hand, promoting more complex economic activities in the provinces of Panama will help to deconcentrate growth and make it more inclusive. Taking over construction by promoting more complex economic activities will require an upgrade in terms of productive capabilities, know-how and skills. The authorities of Panama have already taken some steps in that direction. They have increased their investment in education and achieved some important quantitative results. Panama ranks amongst the top countries in Latin American in terms of average years of schooling, and completion rates for secondary and tertiary school. At the same time, the country has also made a significant effort to upgrade its skill base, by attracting multinational companies via SEM Law, establishing a technology park in City of Knowledge, and a special economic zone – Panama-Pacific – in the area previously occupied by the U.S. Howard military base. All these initiatives are aimed at providing the know-how and skills the economy needs to diversify into more complex economic activities. But they might not be sufficient. Although quantitative indicators of education have improved, quality remains a big concern. Panama scores on standardized tests are, together with Peru, at the bottom of Latin America (OECD, 2010). On top of that, Panama has instated many restrictions to the free flow of migrant labor. There is a long list of occupations restricted to immigrants by law. Even within the Special Economic Zones (SEZs), the transit of labor and knowledge in and out of the zones is highly restricted. Foreign workers enjoy their SEM visas as long as they remain within the multinational companies. Once they are out of them, all the time they have spent working in Panama does not count for residence purposes. Citizens from a list of 50 countries are still considered national security concerns, and must undergo an intricate immigration process to obtain an “authorized visa”. Out of the SEZs, a cap of 10% to the share of foreign workers in payroll exists. Within the City of Knowledge, the restrictions go even further. Visas have to be renewed annually, are at hefty fee that might be quite significant for small and even medium companies were foreign scientists predominate. Also, most of the activities at the technology park gravitate towards research and development. Once companies want to move to exploit their innovations commercially, they might lose all their status and even asked to leave the park if the flow of innovations is interrupted.
According to World Development Indicators, income distribution in Panama improved between 2005 and 2014. The Gini coefficient went from 0.54 to 0.51 in the period, still the fourth largest in the world by 2014.
3
3
All these practices, presumably aimed at protecting Panamanian workers, are preventing Panama from developing the skill-base needed to continue diversifying its economy and growing. According to our analysis, these policies restricting the flow of migrants are not helping the Panamanians. As registered by censuses, immigrants tend to be more entrepreneurs than native workers, and the inflow of high-skilled migrants is associated with higher salaries for the Panamanians working on the same industry-province. The latter is a clear signal that the skills brought by immigrants are complementary, not substitutes, to those of Panamanians (Hausmann, Santos and Obach, 2016). At the same time, our analysis based on census data indicate that immigrants, whether coming through the SEM Law or not, have raised the skill-constraint bar and helped Panama grow faster. But highreturns to migrants of similar education, experience, and gender than their Panamanian counterparts are pointing out to skill-scarcity, which in turn hinders prospects of further productive diversification and growth. Other than skilled labor, red tape and corruption are often quoted by businesses in Panama as significant restrictions. The fact that one of the most valued features for tenants at Panama-Pacific is the one-stop-shop – a building containing all State dependencies that business need to obtain permissions, comply with regulations and function – hints that out of the zones bureaucracy might be significant. Our interviews with business in and out of the zones also indicate that, while the processes required by import-export business is rather expedient, red tape for companies importing and selling inside Panama is complex and tardy. Another factor often mentioned is corruption. Business surveys point out to “inadequacies of the court system” and “corruption” among the most important constraints to private economic activity. That is an area where the performance of Panama is inconsistent with its level of income. Taking the answers form entrepreneurs and business executives at face value, corruption seems to manifest more intensely in the frequency and amount of bribes and “gifts” paid to get things done. Although it must be said that most of the evidence consulted belongs to years before the election of President Varela (2014), this is an area where reforms and improvements typically move at a slower pace and the impacts coming thereof will be slow in materializing. The expansion of the Canal poses an excellent opportunity for Panama to rethink its development strategy and start shifting gears to continue growing at a sustainable and more equitable pace. The country has amassed significant capabilities and know-how within its service sector, which in turn can be combined and redeployed in the production of more complex goods and services. That process will demand a new approach to the immigration laws and regulations surrounding their Special Economic Zones, in order to attract and allow free flow of know-how from the zones to the rest of economy. The deceleration of construction will have significant impacts on salaries and employment of low-skilled labor, which might in turn create some political pressure to enact even more restrictive laws “protecting jobs for the Panamanians”. That shall be resisted, as restricting the free flow of immigrants and knowledge will not help Panamanians. To the contrary: Preventing skilled workers from bringing their know-how and combining it with other capabilities already present in the economy, will only result in less complex activities which in turn are able to sustain 4
lower salaries. Promoting more equitable growth will also demand an effort from the government to break the chicken-and-egg dilemma, and fostering economic activity away from the capital. Here, attracting and retaining the appropriate knowhow to the industries with the highest potential is key, as not all activities have the same likelihood in all places.
Table of Contents EXECUTIVE SUMMARY ................................................................................................................................... 2 1.
ECONOMIC GROWTH PERFORMANCE .............................................................................................. 8
2.
STRUCTURAL CHANGE ........................................................................................................................ 11
3.
MACROECONOMIC PERFORMANCE ................................................................................................. 18
4.
COST OF FINANCE: IS THE DEMAND OR SUPPLY OF CAPITAL AN ISSUE? ............................. 25 4.1 DESCRIPTION OF THE FINANCIAL SYSTEM .....................................................................................................................25 4.2 IS CREDIT LOW IN PANAMA? .....................................................................................................................................26 4.3 IS CREDIT A PROBLEM IN PANAMA? ............................................................................................................................27
5.
LOW SOCIAL RETURNS: IS IT BAD INFRASTRUCTURE? ............................................................... 29 5.1 ENERGY ................................................................................................................................................................29 5.2 TRANSPORT AND LOGISTICS ......................................................................................................................................34 5.4 COMMUNICATIONS .................................................................................................................................................36
6.
LOW SOCIAL RETURNS: IS IT LOW HUMAN CAPITAL? ................................................................. 39 6.1 EDUCATIONAL LEVEL ...............................................................................................................................................39 6.2 QUALITY OF EDUCATION ..........................................................................................................................................41 6.3 UNEMPLOYMENT RATES BY LEVEL OF SCHOOLING ..........................................................................................................43 6.4 RETURNS TO EDUCATION..........................................................................................................................................44 6.5 INDUSTRIAL OCCUPATION BY LEVEL OF EDUCATION ........................................................................................................46
7.
LOW APPROPRIABILITY: GOVERNMENT FAILURES ..................................................................... 54 7.1 MACROECONOMIC RISKS..........................................................................................................................................54 7.2 MICROECONOMIC RISKS...........................................................................................................................................57 7.3 TAX RATES AND ADMINISTRATION ..............................................................................................................................57 7.4 LABOR MARKET ......................................................................................................................................................58 7.5 RED TAPE ..............................................................................................................................................................61 7.6 CRIME ..................................................................................................................................................................61 7.7 CORRUPTION .........................................................................................................................................................62
8.
LOW APPROPRIABILITY: MARKET FAILURES ................................................................................. 63
BIBLIOGRAPHY ............................................................................................................................................... 70
5
Table of Figures FIGURE 1. GDP PER CAPITA LEVELS AND GROWTH RATES: PANAMA (1960-2014) ..........................................................8 FIGURE 2. GDP PER CAPITA GROWTH RATE: LATIN AMERICAN COUNTRIES (1990-2014 AND 2004-2014) ...................9 FIGURE 3. GDP PER CAPITA YEARLY GROWTH RATE: PANAMA (1960-2014) ................................................................10 FIGURE 4. PROVINCIAL GDP PER CAPITA LEVELS AND GROWTH RATES (2007-2013) ....................................................11 FIGURE 5. GROWTH BY SECTOR (2005-2015)..............................................................................................................12 FIGURE 6. SHARE OF EMPLOYMENT BY SECTOR (2005 AND 2015).................................................................................13 FIGURE 7. RELATIVE PRODUCTIVITY IN PANAMA (1983-2012) ....................................................................................13 FIGURE 8. TOTAL, GOODS AND SERVICES EXPORTS PER CAPITA (2014) ..........................................................................15 FIGURE 9. PANAMA: TOTAL, GOODS AND SERVICES EXPORTS PER CAPITA (1998-2014) ................................................15 FIGURE 10. PANAMA: EXPORT SERVICES, NET (2008-3Q2016) ...................................................................................16 FIGURE 11. EXPORTS OF GOODS (2014) .......................................................................................................................17 FIGURE 12. UNEMPLOYMENT AND INFLATION RATES (1990-2015) ..............................................................................18 FIGURE 13. CURRENT ACCOUNT BALANCE VS. ECONOMIC GROWTH (1990-2014) ..........................................................19 FIGURE 14. DRIVERS OF FOREIGN DIRECT INVESTMENT (2008-3Q2016) ....................................................................19 FIGURE 15. FOREIGN DIRECT INVESTMENT: REINVESTMENT RATIOS (2008-3Q2016) .................................................20 FIGURE 16. DISAGGREGATED PUBLIC AND PRIVATE INVESTMENT (2007-2014) ............................................................21 FIGURE 17. EARLY INDICATORS OF ACTIVITY IN THE CONSTRUCTION SECTOR (2012-2016*) .........................................22 FIGURE 18. THE GROWTH DIAGNOSTICS DECISION TREE ................................................................................................23 FIGURE 19. INVESTMENT AND CREDIT (% OF GDP, 2014) ...........................................................................................26 FIGURE 20. USE OF BANKS FOR FINANCING (2015-2016) .............................................................................................27 FIGURE 21. FINANCE AS A MAJOR CONSTRAINT (CIRCA 2010) ........................................................................................28 FIGURE 22. REAL LENDING INTEREST RATE IN PANAMA (1990-2014) ..........................................................................28 FIGURE 23. GENERATION AND CONSUMPTION OF ELECTRICITY (1999-2014) ...............................................................29 FIGURE 24. PANAMA: ELECTRICITY SUPPLY BY SOURCE (1999-2014) .........................................................................30 FIGURE 25. PANAMA: ELECTRICITY DEMAND BY SECTOR (1999-2014) .......................................................................31 FIGURE 26. PRICE OF ELECTRICITY (COMMERCIAL) AND COST OF GETTING ELECTRICITY (2017) .....................................32 FIGURE 27. ELECTRICAL OUTAGES (CIRCA 2010) ..........................................................................................................33 FIGURE 28. GENERATOR OWNERSHIP (CIRCA 2010) ......................................................................................................33 FIGURE 29. LOGISTICS PERFORMANCE INDEX, SELECTED COMPONENTS (2014) .............................................................35 FIGURE 30. DENSITY AND PAVED % OF ROADS (2010)..................................................................................................35 FIGURE 31. PORT INFRASTRUCTURE AND COST TO EXPORT (2014) ...............................................................................36 FIGURE 32. FIXED AND MOBILE PHONES PER 100 PEOPLE (2014) .................................................................................37 FIGURE 33. BROADBAND SUBSCRIPTIONS AND INTERNET USERS PER 100 PEOPLE (2014) .............................................37 FIGURE 34. PANAMA: QUALITY OF INFRASTRUCTURE (2015-2016) .............................................................................38 FIGURE 35. DISTRIBUTION OF YEARS OF SCHOOLING (2000-2010) ..............................................................................39 FIGURE 36. YEARS OF SCHOOLING: POPULATION 15+ (2010) .......................................................................................40 FIGURE 37. DISTRIBUTION BY SCHOOLING (% OF TOTAL LABOR FORCE, 2012) ..............................................................40 FIGURE 38. PISA TEST RESULTS (2009) ......................................................................................................................41 FIGURE 39. TERCE TEST RESULTS (2013)...................................................................................................................42 FIGURE 40. PISA: TOP PERFORMERS (2009) ...............................................................................................................43 FIGURE 41. UNEMPLOYMENT BY LEVEL OF EDUCATION (2012) ......................................................................................43 FIGURE 42. PANAMA: UNEMPLOYMENT BY LEVEL OF EDUCATION (2001-2015) ............................................................44 FIGURE 43. PANAMA: RETURNS TO SCHOOLING (2001-2015) .....................................................................................45
6
FIGURE 44. WORKFORCE W/PRIMARY EDUCATION BY INDUSTRY (2010) ......................................................................47 FIGURE 45. WORKFORCE W/SECONDARY EDUCATION BY INDUSTRY (2010) ..................................................................48 FIGURE 46. WORKFORCE W/TERTIARY EDUCATION BY INDUSTRY, 2010 .......................................................................48 FIGURE 47. WORKFORCE WITH TERTIARY EDUCATION BY OCCUPATION (2010) .............................................................49 FIGURE 48. UNIVERSITY STUDENTS BY CAREER GROUP (2004 AND 2013).....................................................................50 FIGURE 49. FOREIGN WAGE PREMIUM BY INDUSTRY AND OCCUPATION (2010)...............................................................51 FIGURE 50. PRIMARY BALANCE OF THE CENTRAL GOVERNMENT (1990-2014) ............................................................54 FIGURE 51. PUBLIC DEBT: SERVICE AND STOCK (2000-2014) ......................................................................................55 FIGURE 52. LATIN AMERICA: AVERAGE REMAINING MATURITY OF PUBLIC DOMESTIC DEBT (2015) ................................56 FIGURE 53. TAX REVENUE (2013) ................................................................................................................................57 FIGURE 54. TAX RATES (2015) ....................................................................................................................................58 FIGURE 55. MINIMUM WAGE AND SEVERANCE PAYMENTS (2015-2016) .......................................................................59 FIGURE 56. YOUTH UNEMPLOYMENT (1990-2014) .....................................................................................................60 FIGURE 57. DIVERSITY AND AVERAGE UBIQUITY OF EXPORTS (2014) ............................................................................64 FIGURE 58. PANAMA: EVOLUTION OF DIVERSITY AND UBIQUITY OF EXPORTS (1990-2014) .........................................65 FIGURE 59. DIVERSITY AND AVERAGE UBIQUITY OF EXPORTS, 2014...............................................................................65 FIGURE 60. ECONOMIC COMPLEXITY AND GDP PER CAPITA (2014) ..............................................................................66 FIGURE 61. ECONOMIC COMPLEXITY AND COMPLEXITY OUTLOOK (2014) .....................................................................67 FIGURE 62. PANAMA: INDUSTRY COMPLEXITY INDEX .....................................................................................................69
7
1. Economic Growth Performance Over the previous decade, Panama has been one of the fastest growing countries in the world. The average yearly growth rate registered between 1960 and 2014 was 2.8%, but was distributed unevenly in four sub-periods. After a decade of growing at nearly 5.0% per year in the 1960s, growth decreased substantially between 1970 and 1990, even becoming negative in 19851990. In the 1990s growth somewhat picked up, allowing to recover from the collapse of the previous five years. But the most spectacular performance was recorded from 2004 onwards, a decade in which Panama doubled its income per capita. Figure 1. GDP per capita levels and growth rates: Panama (1960-2014)
Panama has outscored all Latin American countries over the previous 25 years. Its 4.1% compounded annual growth rate (CAGR) 1990-2014 is higher than the 3.6% registered by Chile and the Dominican Republic. Even within the previous decade, where some countries in the region managed to grow at high rates such as Uruguay (5.0%) and Peru (4.7%), Panama stands out as the leader in the region with a solid 6.2%.
8
Figure 2. GDP per capita growth rate: Latin American countries (1990-2014 and 2004-2014)
Within the context of such an impressive performance, there are two warning signals that are worth noticing. The first is that growth has slowed down in recent years. Between 2004 and 2014, GDP per capita growth remained above 4.0% in every year – with the exception of 2009 – reaching a record high in 2007 (10.2%). However, over the last four years the rate declined from 8.9% (2011) to 4.5% (2014). The acceleration coincided with the start of the Panama Canal expansion project, 4 which – at a total cost of US$5.2 billion – was equivalent to 25% of Panama’s GDP in 2007. Deceleration is not necessarily a negative feature. It might be a signal of convergence to a steady state rate, after such a long spell of growth acceleration. But it could also hint that some pillars of growth are subsiding, in which case the country shall make an effort to find alternative drivers to diversify its productive capabilities and sustain economic growth.
The Project was approved by referendum on October 22 the same year. Works began on September 3rd, 2007.
4
9
Figure 3. GDP per capita yearly growth rate: Panama (1960-2014)
The second warning signal is that growth has been unevenly distributed, as there are significant income differences across regions within Panama. One of the most troubling signals for the outside observer is that the National Institute of Statistics and Census (INEC) neither computes nor publishes GDP data for the indigenous provinces (comarcas indígenas). In fact, the system of national accounts only considers the GDP of the provinces. The omission is far from inconsequential: Although the indigenous provinces represent only 6.3% of population, they host 22.6% of the poor (2015). 5 Within the provinces that are taken into account, there are little signs of convergence. To the contrary, the richest provinces are growing faster (Figure 4). The only exception was Bocas del Toro, which according to INEC grew at a yearly rate near 20% between 2007 y 2013. 6
According to Labor Market Survey 2015, only 0.96% of the population that is not poor, lived in comarcas. The sheer size of growth reported for Bocas del Toro its concentrated in three unlikely jumps reported by INEC, during the period 2007-2013: 2008 (29.3%), 2011 (50.9%) and 2013 (32.1%). 5 6
10
Figure 4. Provincial GDP per capita levels and growth rates (2007-2013)
Overall, fast economic growth has led to a reduction of poverty and inequality, in spite of which Panama continues to be one of the most unequal countries in Latin America. The growth questions then revolve around sustainability and inequality. These are not entirely unrelated. As reported in the next section, construction has been one of drivers of economic growth over the previous decade. It also tends to be a sector that employs less qualified labor. That probably accounts for the reduction observed in the Gini coefficient between 2005 and 2014 (54 to 51), 7 and highlights even further the importance of understanding the drivers of the construction boom and assessing its sustainability.
2. Structural Change Three sectors have been the drivers of this spectacular growth: Construction; Wholesale, retail and repair; and Transport and Communications. As depicted in Panel A of Figure 5, Mining, Construction, and Public Utilities have been the fastest growing sectors over the last decade, at a CAGR of 20.2%, 18.5% and 9.6%, respectively. However, Mining (1.2%) and Public Utilities (3.5%) represent a very small share of the economy. Once we take relative size into account, the contribution of sectors to economic growth becomes more clear (Panel B, Figure 5). Out of the 7.5% average growth registered in Panama between 2005-2015, 1.8% came from construction, 1.5% from Wholesale, Retail and Repair; and 1.1% from Transport and Communications. These three sectors account for 57% of the growth registered in the decade.
7
Taken from World Development Indicators database of the World Bank.
11
If we narrow our focus of sectorial analysis to the previous five years (2010-2015), the contribution of Construction to growth accelerates (2.5%), a result of fast growth (CAGR 18.6%) combined with an average share in the economy three times larger than in 2000-2005 (5.7% vs. 18.8%). Figure 5. Growth by sector (2005-2015) Panel A. CAGR (%)
Panel B. Contribution to growth (%)
Source: INEC.
Large differences in the rates of growth across sectors have resulted in significant changes in the composition of GDP in Panama. Over the years of the growth acceleration (2005-2015), Manufacturing was the sector losing the highest share, falling from 8.6% to 5.8% of GDP. Second to manufacturing, Agriculture, forestry and fishing also lost relative weight within GDP, from 6.2% to 3.1%. As mentioned above, Construction was the sector with the largest gains, augmenting its share on GDP four-fold from 5.8% to 15.8% of GDP. Changes in GDP composition have been accompanied by large changes in the structure of employment, in particular over the high-growth spell of the precious decade. Retail, Wholesale and Repair; and Construction, have gained share in employment, and by 2015 where the largest and third largest employer in Panama. In spite of the low growth registered and the corresponding loss of share of GDP, Agriculture and fishing continue to be the second largest employer in Panama.
12
Figure 6. Share of employment by sector (2005 and 2015)
The mixture of large swings in GDP and employment also implies big differences in productivity across sectors. Using WDI data for Agriculture, Industry and Services, we computed an indicator of productivity by dividing the share of GDP by sector into its share in employment. 8 Figure 7 portrays an economy with productivity in industry and services about seven times higher than agriculture. Figure 7. Relative productivity in Panama (1983-2012)
Overall, the structural transformation of production has some very distinct characteristics. First, there is a relative increase in the non-tradable sector (Retail, Wholesale, and Repair; We did not compute value added per worker for the sectors comprised in Figure 6 because the Economic Census – the only source of value added by sector – does not include finance and agricultural sector. 8
13
Construction), at the expense of tradable goods (manufacturing, agriculture). This trend might pose a risk for growth sustainability. Small open economies need to sell goods and services abroad in order to be able to acquire the goods and services their population demand but the country does not produce. Second, Construction has been growing at a rate significantly higher than the rest of economy, a feature that is unlikely to hold in the medium term. As we shall see in next section, from 2007 onwards Construction has been driven by large infrastructure projects and non-residential private investment. The latter is driven by the demand for infrastructure of other sector in the economy (warehouses, office buildings). Once the stock is built, the flow of construction shall decrease, losing weight within the GDP and releasing low-skilled workers. Panama needs to prepare for that, as this might threaten the improvements achieved in income inequality over the previous years. Third, Panama effectively developed a competitive tradable service sector (Logistic, Communications, Transport, Trade Services, and Information). These activities have gained a small share in employment, and are growing at a high, significant, but decreasing rate. 9 If Panama wants them to take over as the main driver of growth and foreign exchange, it is essential to figure out the binding constraints to these particular sectors. Al last, the loss in relative importance of Agriculture and fishing is in sharp contrast to their standing as the second largest employer in Panama. As a result, productivity in the agricultural sector is very low, a fact that might be at the core of the large income inequality in Panama. The construction boom, given that this is an industry that tends to employ low qualified labor, might have eased poverty down and account for the reduction in equality observed. Looking a structural transformation from a balance of payments standpoint, we can see that Panama has become the fourth largest exporter per capita in Latin America, a feature entirely driven by its service exports. As depicted in Figure 8, Panama is the largest exporter of services per capita in Latin America, at a level close to OECD economies. In contrast, Panama is the economy with the lowest exports of goods per capita in the region, a little more than US$200 per capita.
Transport and communications grew at a CAGR of 8.3% in 2000-2005; 7.6% in 2005-2010; and 5.8% in 2010-2015. 9
14
Figure 8. Total, goods and services exports per capita (2014)
Service exports per capita have steadily increased in time, while exports of goods remained stagnant. Between 2000-2008, goods exports per capita increased 25%, but during the next six years decreased 38%; ending 23% below their initial value. To the contrary, exports of services per capita have expanded continuously, in particular from 2005 onwards, growing by a factor of 3.5 times. Figure 9. Panama: Total, goods and services exports per capita (1998-2014)
Within services, exports are led by Transport (Canal and ports) and Travel. By 2014, Panama exported 2.4 times more Transport services than high-income OECD economies. 10 Something similar happened with Travel, which have expanded significantly over the previous decade, with the “Transport” covers all transport services (sea, air, land, internal waterway, pipeline, space and electricity transmission) performed by residents of one economy for those of another and involving the carriage of passengers, the movement of goods (freight), rental of carriers with crew, and related support and auxiliary services (including postal and courier services). Source: World Development Indicators. 10
15
creation of an air-travel hub in Panama City. 11 By 2014 Panama had also outperformed OECD economies on Travel services per capita by 40%. 12 Up to 2014, these two categories represented more than 95% of total service exports of Panama. In 2015 and the first three quarters of 2016, Business and Entrepreneurial services became relevant, registering a net surplus of US$1.3 billion on each. 13 Figure 10. Panama: Export Services, net (2008-3Q2016)
Source: INEC, Balance of Payments, Summary of Normalized Components.
11 In 1998, 29.5% of services exports corresponded to tolls collected by ACP and 5.8% to air passengers. By 2014, the first activity had reduced its share to 14.9% and the second had increased its to 15.7%. Source: INEC. 12 “Travel” covers goods and services acquired from an economy by travelers for their own use, during visits of less than one year for either business or personal purposes. Travel includes local transport but excludes international transport. Travel also excludes goods for resale. Source: World Development Indicators. 13 Starting in 2012, INEC introduced a change in the way they accounted for re-exports of goods (and in particular oil) that do not enter Panama. Before that, they used to report in the balance of payments only the margin left by these operations. From 2012 onwards, they record these as imports (negative) in the balance of goods (under the heading “Goods acquired in ports by means of transportation”); and simultaneously record an export (positive) in the balance of services (under “Other business and entrepreneurial services”). In order to ease the 2008-2016 comparisons and to avoid misrepresentations, in Figure 10 we have netted these amounts as was done before 2012, and reported the net balance as a service export. Note that the net balance of US$1.292 million registered in 2015 and US$ 1.266 million registered in the first half of 2016, are already net of imports of “Goods acquired in ports by means of transportation”.
16
Panama not only exports a small variety of goods, mostly comprised of simple products with little value-added. At first sight (Panel A on Figure 11), Panama has exports of US$5.3 billion, distributed among many sophisticated products. Once re-exports are removed (Panel b), we are left with US$1.2 billion, concentrated in a few primary products of little complexity. 14 Figure 11. Exports of Goods (2014) Panel A. Panama Gross Exports
Panel B. Panama Net Exports
Source: Harvard CID Atlas of Economic Complexity.
“Complexity” is a measure of the diversity of ‘capabilities’ that a given product requires to be manufactured and exported. We will define the indicator in detail in the section on Market Failures. For a more detailed explanation, see Hausmann et al (2013). 14
17
3. Macroeconomic performance Panama has kept low inflation with a declining unemployment rate. The unemployment rate has dropped steadily since 2001 - with the exception of the financial crisis of 2009 - from 16.1% (1991) to 4.8% (2014). Simultaneously, inflation remained at single-digit rates throughout the period, mirroring the price dynamics of the U.S. economy. However, Panama did experience an extraordinary acceleration in prices in 2007-2008, an indicator that the economy might have overheated between those years. Since then, it has fallen steadily to rates close to zero. In relative terms, Panama has also excelled in Latin America by having two of the lowest unemployment and inflation rates. Together, these indicators provide evidence that the economy did not overheat in spite of its high growth rate. Figure 12. Unemployment and inflation rates (1990-2015)
The balance displayed by the domestic economy does not extend to the external sector. Over the previous twenty years, Panama has registered increasingly larger current account (CA) deficits. Between 2010 and 2014 CA deficit averaged 11.3% of GDP, falling down to 6.5% of GDP in 2015. A CA deficit is not much of a problem itself, the key is what is driving it and how is it financed. In the case of Panama, CA deficits are driven by significant imports of goods, which exceed by far both the exports of goods and the service surplus. 15 The mirror image of CA deficits has been foreign direct investment (FDI). 16
The main groups of goods imported in 2014 were minerals (20.8%), and machinery, mechanical appliances, electrical equipment, sound and image recorders and reproducers (18.8%), followed by transport equipment (9.9%), metals and articles made of metal (9.9%), chemical products (7.6%) and foodstuffs (7.4%). 16 The pattern did not change during the 2007-2014 economic boom, in spite of Panama’s high savings rates (above 30% throughout the period). Most of FDI during this period went to trade (32.8%), FIRE (16.5%), transport and warehousing (14.1%), and mining (10.2%). 15
18
Figure 13. Current account balance vs. economic growth (1990-2014)
To the extent that Panama manages to maintain the flow of FDI – more stable than short-term portfolio investments and presumably a driver of higher productivity – the CA deficit will not be an issue. Interestingly, the main source (60%) of FDI in Panama comes from reinvestment of earnings (Figure 14). Figure 14. Drivers of Foreign Direct Investment (2008-3Q2016)
Source: INEC Balance of Payments, 2008-2016.
Foreign entities have reinvested more than 70% of their earnings in the economy since 2013 (Figure 15), a strong signal of confidence in Panama and its thriving economy. Reinvested earnings are likely to be a more stable source of FDI than new equity, but given its sheer size it seems advisable to pursue a strategy to gradually reduce CA deficits. Given the results observed in 2015 and first three quarters of 2016, the government has tackled it, reducing the CA deficit by means of significant import cuts. 19
Figure 15. Foreign Direct Investment: Reinvestment ratios (2008-3Q2016)
Source: INEC Balance of Payments, 2008-2016.
Looking at the expenditure side of GDP we notice an acceleration on investment driven by non-residential construction. Its sustainability is not guaranteed. Economic growth between 2007 and 2014 was propelled mostly by a surge in the aggregate demand via fixed capital formation (investment) and private consumption (20% and 11% CAGR, respectively). In particular, the ratio of investment to GDP boosted from 28.3% in 2007 to 43.3% in 2014. Most of the increase in investment came from the construction sector, which went from representing 41% of total investment in 2007 to 65% in 2014. The residential component, accounting for 57% of construction investment in 2007, had shrunk to 24% by 2014. The driving force from 2010 onwards has been investment in non-residential construction, both public and private. The public component has been pushed by large infrastructure projects, such as the expansion of the Panama Canal, the construction of the Panama City Metro, and the expansion of the airport. Sustaining this model of growth would require a permanent portfolio of mega projects in place.
20
Figure 16. Disaggregated public and private investment (2007-2014)
Indeed, public direct investment is already decreasing due to the current anti-corruption campaign and the policies aimed at reducing the of fiscal deficit. Driven by these large infrastructure projects, direct public investment went from accounting for 15% of total public expenditure in 2007, to 35% in 2013. Since then, it declined to 27% in 2015. This is consistent with evidence that the construction investment boom is petering out. The reduction in public investment is likely the consequence of both, the “greater scrutiny in awarding construction permits and public contracts” associated to the new government’s anti-corruption campaign, 17 and to the government stated goal of reducing the fiscal deficit. On the private boom of non-residential construction there is less information available. This category roughly gathers the construction or replacement of warehouses, office buildings, retail facilities, and shopping malls. The first three presumably cater the development of a modern service sector in Panama, focused in logistics, retail and wholesale, communications, and other business services. As such, it is unlikely to keep on growing at a pace significantly faster than these sectors, as has been the case over the previous decade. Once the stock of infrastructure required by these sectors is on site, construction will decrease its pace and share on GDP. Leading indicators of activity in the construction sector, provided by INEC and summarized in Figure 17, point out to a deceleration, mostly focused on non-residential construction. The fact that the production of ready-mix concrete and cement has been falling for the previous three years while the construction sector has continued to grow, can possibly be due to a gradual exhaustion of inventories or increased concrete imports. Whatever the reasons, the fact remains that most leading indicators on the construction sector have been pointing out to a deceleration of the sector for some time now.
International Monetary Fund (2015) “Panama: 2015 Article IV Consultation – Press Release; Staff Report; and Statement by the Executive Director for Panama”, IMF Country Report No. 15/237, August 2015. 17
21
Although we could not find out systematic series of quantities and prices to carry a proper assessment of the non-residential consumption boom, 18 some early indicators seem to point out that the boom might have started to wane, driving vacancy rates up. Depending on quality, vacancy rates within Panama City were anywhere between 11.5% (Class B) to 32.2% (Class A+ office space) by the end of last year. 19 Accordingly, rent prices experienced small decline for the first time since 2010. For warehouses in the Panama province the vacancy rates are lower (7.2%), and prices were reported stable over the first half of 2016. 20 Figure 17. Early indicators of activity in the construction sector (2012-2016*)
* The figure for 2016 correspond to the percentage variation of January-July 2016, with respect to same period 2015. Source: INEC.
The purpose of this report is to identify and analyze the most binding constraints to growth for the median industry in Panama; not for particular sectors. However, given the importance that construction has acquired as a driver of GDP and employment over the previous decade, we have The absence of official statistics, prices and volumes, related to the construction sector in Panama has already been pointed out by multilateral agencies. See for instance “Panama: Locking Success. A systematic country diagnostic”, World Bank, January 16th, 2015. 19 CBRE Market View, Panama City Office, December 2015. 20 CBRE Market View, Panama City Industrial, June 2016. 18
22
devoted some time to analyze the particular type of construction behind the boom (non-residential private, large infrastructure projects), and caution about the consequences of a deceleration for nonskilled workers. We also have analyzed the balances of the domestic banking system, and found no signs of increased exposure to Construction within their asset portfolio. To the contrary, in spite of the boom, banks have maintained stable their exposure to Construction and acted cautiously when lending to the sector, using conservative assessed values that effectively translate into strong asset guarantees for their loans. In any case, a more in-depth study on the likelihood and timing of a decrease in economic activity in the sector is worthwhile, but beyond the scope of this study. Our analysis of the growth performance in Panama portrays an economy that has managed to grow at a fast pace without overheating. Thriving service exports, FDI, and an extraordinary boom in non-residential construction promoted by government and domestic private sector alike, account for most of the growth acceleration registered in the previous decade. Some warning signals of decay have started to show up, rising concerns on the sustainability of the model of growth and its capacity to deliver higher income equitably. What might be the binding constraints to sustained growth in Panama? In the following sections, we search for the answers using a Growth Diagnostics approach, 21 aimed at telling apart what might already be, or soon become, binding constrains within the context of such an impressive economic performance. In order to do so, we start by analyzing the “usual suspects”. First, we look at the evidence regarding the availability of loanable funds (the right-hand side of the decision tree portrayed in Figure 18), followed by the other suspects under the low social returns to economic activity group (left-hand side of the tree). Figure 18. The Growth Diagnostics decision tree
21
Hausmann, R., D. Rodrik and A. Velasco (2005).
23
Source: Hausmann, Klinger and Wagner (2008)
24
4. Cost of finance: is the demand or supply of capital an issue? In this section, we first try to detect if the supply of credit might be a binding constraint to growth in the near future. Based on the available evidence, we do not think the future constraints to growth will come from the financial system.
4.1 Description of the financial system In Panama, the banking system is composed by four main groups of banks: (1) official banks, (2) private banks, (3) international banks, and (4) representation branches. The definition of the first group is straightforward: it contains the two state-owned banks in the country: 22 Banco Nacional de Panamá (a development bank 23) and the Caja de Ahorros (a commercial bank 24). Panama does not have a Central Bank. 25 In contrast, the distinction between the second and the third group is not based on the bank’s nationality, but rather on where they conduct business. On one hand, private banks are those with “general license”, which means that they can conduct business in both Panama and foreign countries, regardless of the origin of their capital. It follows that this group can also include foreign banks conducting operations in Panama. 26 On the other hand, the international banks are those with “international license”, which means that they can have offices in Panama but only conduct business abroad. This group can contain banks of Panamanian capital as well. Finally, the representation branches are offices of foreign banks that have a “representation license”, i.e. that are allowed to establish an office in Panama to represent their interests, but not to conduct business. Panama’s importance as an international banking center has grown considerably in the last 15 years, although its sphere of influence is mostly regional. By April, 2016, beside the two official banks, there were 47 banks with general license (29 foreign); 27 banks with international license; and 17 with representation license. The majoritarian presence of Latin American banks among the foreign banks indicates that the importance of Panama’s International Banking Center is
22 These are the two official banks that are supervised by the Superintendence of Banks (SBP). However, there are more state-owned banks in Panama: Banco de Desarrollo Agropecuario (a development bank for the agricultural sector), Banco Nacional Hipotecario (bank specialized in mortgages); and Instituto de Seguro Agropecuario (an insurance company for the agricultural sector). 23 It was founded in 1904, six months after independence, as the economic and financial arm of the State. Until 1934, it was one of the only two banks in the country, alongside the U.S.-based Citibank. 24 It was founded in 1934 with the double objective of financing the provision of social housing, and promoting savings among Panamanians. It would be one of the only two banks of Panamanian capital (both state-owned) until the foundation of Banco General in 1955. 25 Since its independence from Colombia in 1903, Panama has pegged its currency (the Balboa) to the U.S. dollar and, in doing so, surrendered the capacity of conducting independent monetary policy. 26 Legally, a bank in Panama is “foreign” if it is a branch (a bank’s office that does not constitute a different legal entity) or a subsidiary (an independent legal person owned totally or mostly by a bank) of a bank whose headquarters are located outside of Panama.
25
mostly limited to the region. 27 Moreover, its importance has increased considerably during the previous 15 years; as more than half of foreign banks (either with general, international or representation license) started operations after the year 2000. For our purposes, we will focus on the activities of the general license banks, insofar as the international banking center operates mostly as an enclave in Panama. In 2015, the international license banks represented 0% of net domestic credit, less than 6% of net domestic stock investments, and less than 1% of domestic deposits to the non-financial private sector. In contrast, general license banks represented 88% of net domestic credit, 65% of net domestic stock investments, and 95% of domestic deposits of the non-financial private sector. Official banks represented 12%, 29% and 4% respectively.
4.2 Is credit low in Panama? In terms of aggregate indicators, investment and credit are high and have positive trends in Panama. As a percentage of GDP, Panama ranks amongst the top in Latin America in both Gross Fixed Capital Formation (investment) and domestic credit to the private sector. Indeed, in terms of investment as a percentage of GDP, Panama ranked first in the region in 2014, with the ratio increasing steadily since 2002 all the way up to 43.4%. In terms of domestic credit to the private sector Panama ranked second (to Chile) in the region, still far from OECD countries. Figure 19. Investment and Credit (% of GDP, 2014)
Credit (2014)
Investment (2014) OECD members
Panama Nicaragua
Chile
Ecuador
Panama
Colombia
Brazil
Peru
Belize
Chile
Colombia
Guyana
Bolivia
Mexico
Guyana
Bolivia
El Salvador
Dominican Republic
Nicaragua
OECD members
Peru
Brazil
Mexico
Belize
Ecuador
Argentina
Dominican Republic
El Salvador
Argentina 0
10
20
30
40
Gross fixed capital formation (% of GDP)
0
50
100
150
Domestic credit to private sector (% of GDP)
Source: World Development Indicators (World Bank)
Of the 29 foreign banks with “general license”, 22 were Latin American, mostly Colombian (5), Ecuadorian (4) and Venezuelan (3). Likewise, of the 27 banks with international license, 20 were Latin American, mostly Colombian (9) and Peruvian (4). On the contrary, of the 17 banks with representation license, only 3 were Latin American (including one of Panamanian capital) 27
26
Microeconomic information suggests there are no major constraints in firms’ access to finance. According to the Global Competitiveness Report of 2015-2016, Panama takes the lead among Latin American countries in terms of accessibility and affordability of financial services. Moreover, Panama outperforms the US (country with one of the most well-developed financial system in the world) when it comes to the easiness of accessing to a loan (Figure 20). Figure 20. Use of banks for financing (2015-2016) Affordability of financial services
Availability of financial services United States Panama Brazil Chile Peru Guyana Ecuador El Salvador Venezuela Nicaragua Dominican Republic Bolivia Mexico Colombia Argentina
United States Panama Chile Brazil Dominican Republic Colombia Peru Mexico Ecuador Guyana El Salvador Bolivia Nicaragua Venezuela Argentina 0
2
4
0
6
2
4
6
Quality(1-7)
Quality(1-7)
Ease of acces to loans Panama United States Chile Bolivia Ecuador Guyana Peru El Salvador Nicaragua Dominican Republic Colombia Brazil Mexico Venezuela Argentina 0
1
2 Quality(1-7)
3
4
Source: Global Competitiveness Report 2015-2016
4.3 Is credit a problem in Panama? As mentioned above, firms in Panama do not consider finance as a major constraint. The percentage of firms declaring not needing a loan was higher in Panama (59%) than in any Latin American country (44%), and even the average of OECD countries (55%). Also, a negligible percentage of firms (1%) in Panama identified access to finance as a major constraint. These two indicators suggest that, there is not an excess of demand for credit in Panama.
27
Figure 21. Finance as a major constraint (circa 2010)
The cost of credit in Panama not only is among the lowest in the region, but also displays a decreasing trend over the previous 15 years. The real lending rate was among the lowest in Latin America in 2014 (4.7%) and has been decreasing since 2000, when it peaked 11.9%. Figure 22. Real lending interest rate in Panama (1990-2014)
Finally, Panama has been enjoying cheap access to external funds for a long while. The country has consistently been rated investment grade by the three main credit rating agencies, 28 and displays a sovereign spread amongst the smallest in the region.
28
In terms of credit rating, Panama ranked 4th in the region, after Chile, Peru and Mexico.
28
5. Low social returns: is it bad infrastructure? In the previous section, we concluded that it is unlikely that Panama´s potential binding constraints belong to the right-hand side of the Growth Diagnostics tree. Now we turn our attention to the lefthand side of the tree. We start by looking at the infrastructure of Panama, divided in three subsets: (1) energy, (2) transport, and (3) communications. We conclude that the neither energy nor transport are potential constraints to economic growth in the near future. However, efforts to promote industry diversification in the province might run into energy constraints. Also, Panama should continue its efforts of expanding its broadband coverage and internet usage.
5.1 Energy Panama produces more energy than it consumes. On average (1999-2014) total consumption of energy has been equivalent to 82% of total generation. Over those years the country managed to expand electricity generation at the lofty speed the accelerating economy demanded, but the actual situation is not as comfortable as depicted in Figure 23. Efficiency losses have averaged 14% of total domestic supply over the previous ten years. Other than efficiency losses, some warning considerations on both the supply and demand side of electricity are worth stressing. Figure 23. Generation and Consumption of electricity (1999-2014)
Panama derives most of its electricity supply from hydroelectric generation (both reservoir and run of river). The potential for expansion of hydroelectric-generated electricity is limited, as most of the best sites have already been developed and the remaining ones will have a relatively modest impact in supply. 29 Substantial dependence on hydroelectric plants, together with
29
Panamá: Plan Energético Nacional 2015-2050, pp. 30-31, Secretaria de Energía de Panamá, Julio 2016.
29
droughts and inefficiencies driven by plant failures, have made businesses – particularly in the capital – vulnerable to power shortages. 30 However, during the past decade reliance on hydroelectric generation has diminished. As displayed in Figure 24, hydroelectric generation went from 66% of total electricity supply in 2004 to 54% in 2014. Out of the 3.525 million kWh/hour capacity increase registered between those years, only a third came out of hydroelectric plants. Oil-based sources provided 41%, carbon (non-existing until 2010) another 19%, and wind an additional 3%. The shift poses new challenges as it has made Panama´s electricity supply more dependent on imported energy (oil in particular), a trend that will reassert itself as the country continues to grow in the future. Oil based energy production can be significantly less efficient and is subject to the volatility of global commodity markets, which in turn can have important implications with regards to production costs and the determination of appropriate tariffs. To adequately accommodate future growth, the country would need to diversify its sources of power generation, and continue growing its exports of goods and services to afford larger imports of energy.
Figure 24. Panama: Electricity Supply by Source (1999-2014)
Source: International Energy Agency (IEA).
Another interesting feature is derived from the evolution of the demand for electricity (Figure 25). The fact that a large chunk of the value added in Panama over the previous decade came 30
This point has been already stressed by the World Bank (2015), Panama: Locking in Success: A Systematic th Country Diagnostic. January 16 , 2015. Pp. 41-47.
30
from the service sector, which is not energy-intensive, 31 has allowed to country to grow at a fast pace without running into an electricity constraint. Figure 25. Panama: Electricity Demand by Sector (1999-2014)
Source: International Energy Agency (IEA).
Electricity prices in Panama are significantly higher than in the rest of Latin America, although the cost of getting connected to the grid is amongst the lowest. Increasing prices over the decade were mostly the consequence of increased reliance on oil as a source of power-generation. More recently, the government has taken advantage of lower oil prices to reduce some of the subsidies to electricity.
31
International Energy Outlook 2016, U.S. Energy Information Administration. See Chapter 7.
31
Figure 26. Price of electricity (commercial) and cost of getting electricity (2017)
Panama performs better than other Latin American countries in terms of reliability of the electricity service, but it also has a higher proportion of electricity obtained from generators. By 2010, Panama had less electrical outages in a typical month, with lower duration, and lower loses due to power cuts than most Latin American countries. Moreover, the proportion of firms owning or sharing a generator in Panama was less than half the average in Latin America. Nonetheless, the proportion of electricity gotten from a generator was higher in Panama than in other countries. When looked at in detail, we found that the proportion is high mostly in non-retail services firms, and that more than 90% of electricity among firms owning a generator comes from it. This might mean that back then the few firms that owned a generator were big enough to account for a non-trivial percentage of total electricity output, and were located in places where the public grid is absent or the service is unreliable. 32
32
Unfortunately, the latest data available from the World Enterprise Survey of the World bank on power outages and generator ownership does not go beyond 2010.
32
Figure 27. Electrical outages (circa 2010)
Figure 28. Generator ownership (circa 2010)
Overall, the subjective assessment of energy as a constraint in Panama is very positive. When asked about major constraints in 2010, only 4.2% of Panamanian firms identified electricity as a major constraint. This share was by far the lowest in the region (the Latin American average was 32.4%, Peru comes second with 14.8%), and even lower than the average of OECD countries (21.8%). However, among large firms (more than 100 employees), electricity ranked as their top concern.
33
Panama has grown significantly over the previous five years, putting some demand-pressure on electricity prices. The evidence we have analyzed so far has some important implications. Oil and carbon seem to have played a significant role from 2011 onwards on supplying the power the fastgrowing economy demanded. That have put some pressure on prices. Overall, business do not consider electricity one of the most important constraints to growth, but that is closely related to the pattern of growth that Panama has followed. In particular, electricity might become a serious constraint if Panama pursues a diversification strategy to promote the development of industries, and in particular, manufacturing, in the province. For example, Chiriqui has a potential to become a hub for construction materials, including forged metal, cement, cast, and wood. 33 If that potential were to be developed, power generation would soon become a constraint. Panama has already started working on two interconnection projects that are aimed at diversifying its sources of power, while achieving economies of scale that allow for a more cost-efficient supply of energy. These projects are aimed at expanding the interconnection line via Costa Rica and Colombia. The first one connects Panama to the Electric Interconnection System of Central America (SIEPAC). Two tranches of the line, going from the Costa Rica border to corregimiento Veladero in Chiriqui, covering a total of 150 kilometers, have already been deployed. 34 The second project entails connecting Panama to Colombia, and is much more difficult to execute. It is only at the feasibility study stage, and faces many hurdles associated to ecological reasons, and authorization from the indigenous communities located along the corridor.
5.2 Transport and logistics Panama ranks high in quality of infrastructure and logistics. In spite of its size, Panama ranks second-to-Brazil in the region in container port traffic (with almost 8 million TEUs a year). 35 Given that the country owns one of the most important pieces of infrastructure in international trade, and has become highly competitive at providing the services surrounding the Canal, it is not surprising to find Panama among the countries with the best trade-related infrastructure and logistics, and the most efficient customs clearance processes in Latin America in 2014.
33
Hausmann, R. Morales, J. & Santos, M.A. (2016). Gobierno de la República de Panamá (2016). El Mercado Eléctrico de Panamá, junio 2016. 35 Twenty-foot equivalent unit (TEU) is a unit of cargo capacity, used to describe the capacity of container ships and container terminals. 34
34
Figure 29. Logistics Performance Index, selected components (2014)
Panama also ranks among the best performers on the road network extension and quality in Latin America. The road network in Panama in 2010 is half as dense and half paved than the roads in OECD countries, but was among the best in Latin America. 36 Although we do not have more recent internationally comparable data, we have information that by 2014 Panama had slightly increased the share of paved roads to 43.4%, up from 41.1% in 2010.
Figure 30. Density and paved % of roads (2010)
36
Unfortunately, currently the World Development Indicators is no longer including data on road network.
35
Firms in Panama do not consider transport a major constraint. Only 0.5% of firms in 2010 identified transport as a major constraint in Panama, by far the lowest percentage in the region. Moreover, the proportion of products lost to breakage or spoilage during shipping to domestic markets (0.1%) is also the lowest in the region (1.1%), even lower than average OECD (0.7%). Panama also has a good quality of port infrastructure and low shipping costs. In 2014, Panama topped the rank of quality of port infrastructure, well above the average of OECD countries. Granted, this ranking is based on a subjective assessment, but when we look at the cost of shipping a 20-foot container, Panama also comes out cheapest in Latin America. Figure 31. Port infrastructure and cost to export (2014)
5.4 Communications Following a well-known pattern in developing countries, Panama underperforms regarding fixed telephone lines per 100 people, and outperforms in terms of mobile phone subscriptions per 100 people (1.5 mobile phones per person), well above the OECD average, and close to the Latin American leaders, Uruguay and Argentina. As many other developing countries, Panama leapfrogged into mobile before providing widespread access to their fixed-phone lines.
36
Figure 32. Fixed and mobile phones per 100 people (2014)
However, Panama is lagging behind in terms of broadband subscriptions and internet usage, even by Latin American standards. By 2015, Panama only had one third of Latin American leader Uruguay, and half of those in Paraguay, Argentina and Chile. Moreover, it ranks on the average of Latin America in terms of internet users per 100 people, less than half OECD levels. Figure 33. Broadband subscriptions and internet users per 100 people (2014)
Based on the information available, we conclude that it is unlikely that infrastructure will be a binding constraint in Panama, although the insufficiencies of internet provision are significant. This is a surprising feature, which is inconsistent with its income per capita and relatively more favorable business environment. Although broadband quality in Panama City has plenty of room to improve, the low number of internet users in Panama might be more related to the income inequalities reported above, and differences in the coverage of the internet grid across the country. Indeed, Panama has one of the lowest prices for fixed broadband in Central America 37
and Mexico (2011) 37 and has already positioned itself as a regional telecommunications hub by being the interconnection point of seven international optic fiber submarine cables. The challenge seems to lie on prioritizing infrastructure investments needed to expand the coverage and quality of broadband internet in the country. Other than that, Panama performs well in infrastructure indicators, leading Latin American countries in most indicators of overall infrastructure, transport and logistics, either by WDI standards or Global Competitiveness Report (Figure 34).
Figure 34. Panama: Quality of Infrastructure (2015-2016)
Panama's Quality of Infraestructure Global Competitiveness Report 2015-2016 Overall infraestructure
Transport
United States Panama Ecuador Chile Mexico El Salvador Guyana Dominican Republic Bolivia Nicaragua Colombia Peru Argentina Brazil Venezuela
United States Panama Mexico Ecuador Chile Dominican Republic El Salvador Brazil Argentina Peru Guyana Colombia Nicaragua Bolivia Venezuela 0
2
Quality(1-7)
4
6
0
2
Quality(1-7)
4
6
Electricity and telephone United States Chile Panama El Salvador Brazil Colombia Ecuador Argentina Peru Mexico Bolivia Nicaragua Venezuela Guyana Dominican Republic 0
2
Quality(1-7)
4
6
García-Zeballos, A., F. González, E. Iglesias Rodríguez and M. Porrúa (2013) “Banda Ancha en Panamá. Situación actual, retos y oportunidades para el crecimiento económico y la inclusión social”, IADB. 37
38
6. Low social returns: is it low human capital? In this section, we analyze if there is a shortage of human capital in Panama, and, if so, if it might be a binding constraint to future growth. We conclude that, while the government efforts have yield quantitative results (higher years of schooling and participation at all educational levels), in terms of quality there is still much left to do. Panama has shifted gears and is in the middle of a transition to a growth model based on a modern service sector, which demands skills that at present cannot be accommodated with Panamanian workers. Moreover, there seems to be a mismatch between the skills demanded by more complex services, and the skills provided by tertiary education. That gap has not been a major growth constraint in so far thanks to immigration. There has been an active effort of the government to attract foreign talent via multinational headquarters, embodied in the Ley de Sedes de Empresas Multinacionales (SEM). But a large number of high-skilled immigrants out of the SEM have joined the Panamanian economy and helped raise the bar of growth to a new level. Restricting the flow of knowledge that comes with high-skill workers at a time when the economy will be relying more on the engine of its modern service sector, might pose a risk to sustained economic growth. High premiums paid to foreign workers seem to indicate that the immigrants bring skills that are in short supply in Panama.
6.1 Educational level The average years of schooling of the Panamanian workforce has increased almost two years between 2000 and 2010. The labor force shifted from being composed mostly by workers with complete primary schooling, to one where secondary schooling predominates. Additionally, the share of workers with tertiary education increased, at the expense of uneducated workers. Figure 35. Distribution of years of schooling (2000-2010)
39
Panama’s workforce exhibits a high number of years of schooling on average. In 2010 (the most recent year with internationally comparable data), Panama performed well in terms of average years of schooling of its work-aged population (active or not). Moreover, two years later it also performed above the regional average in terms of labor force schooling. Figure 36. Years of schooling: Population 15+ (2010)
Figure 37. Distribution by schooling (% of total labor force, 2012)
40
6.2 Quality of education Panama’s youth has been among the worst performers worldwide regarding international comparable competence tests. The year 2009 was the last one Panama took part of the PISA test, which attempts to comparatively assess competence on reading, mathematics and science among 15 years olds (secondary schoolers) in the world. Panama was among the worst performers in the test (which included several, but not all, Latin American countries). 38 The country ranked last in the world in mathematics, and among the worst in reading and science (63 out of 66 in both), only surpassing Peru in Latin America. As a benchmark, OECD countries´ rank averaged 27, 24 and 24, respectively.
Figure 38. PISA Test results (2009)
Source: PISA 2009, OECD
In 2013 Latin American took another test for third and sixth graders (primary school), measuring their level of competence in mathematics, reading, writing and natural sciences (TERCE). Again, Panama ranked below the regional average in reading and mathematics in both grades. In writing the third graders lagged the Latin American average, while sixth graders were not statistically different from the rest of the region.
38
The participant countries were Chile, Uruguay, Mexico, Colombia, Brazil, Argentina, Panama and Peru.
41
Figure 39. TERCE Test results (2013)
Source: TERCE (2013)
At last, Panama has an extremely low percentage of top performer students in mathematics and science, compared both to other countries in the region and to the OECD average. In math, Panama’s best performers account for only 0.4% of students, as compared to a 12.7% of OECD countries. This means that Panama should increase in 30 times the number of top performer students if it wants to resemble the OECD distribution. Having a sizable number of people performing at the top of math and sciences may encourage a more sustainable path of growth for 42
Panama, as these future workers are most likely to foster innovation and productive transformation. With all these evidence, it is clear that Panama does have an issue of low quality of education at the basic level (primary and secondary). Figure 40. PISA: Top performers (2009)
Source: Pisa 2009, OECD.
6.3 Unemployment rates by level of schooling Panama has one of the lowest unemployment rates in the region, for all levels of education. In 2012, the unemployment rate of the labor force with primary, secondary and tertiary education in Panama was 1.9%, 5.5% and 3.7%, respectively, among the lowest in Latin America. Lowest unemployment rate in the region for tertiary education may indicate a shortage of skilled labor. Figure 41. Unemployment by level of education (2012)
43
The unemployment rates, except for those with tertiary education, have started to increase in the last years. The trend of unemployment during the last decade and a half has been clearly negative for all levels of education. However, since 2013, it has started to slowly increase, in particular for those with secondary education. The deceleration of Construction seems to have had a negative impact in employment for these particular type of workers. The fact that unemployment for workers with tertiary education has not increased as the others did might also hint a shortage of skilled labor.
Figure 42. Panama: Unemployment by level of education (2001-2015)
6.4 Returns to education The average returns to schooling have decreased during the last 15 years. The first piece of evidence we looked at was the classic Mincer returns: We calculated the average returns to an additional year of education, regardless of the base level of education. 39 We found that the rate of return has decreased from around 10% in 2001 to less than 8% in 2015. This suggest that the relative scarcity of skilled labor must have diminished over that period. Most likely, the decrease in the average rate of return to schooling might be due to the fact that the economic sector that has grown the most in Panama (construction) mostly hired workers with primary education (approximately 60% of total workforce in construction).
We ran the following regression: ln(𝑤𝑤𝑖𝑖 ) = 𝛽𝛽0 + 𝛽𝛽1 𝑠𝑠𝑠𝑠ℎ𝑜𝑜𝑜𝑜𝑜𝑜𝑖𝑖 + 𝛽𝛽2 𝑒𝑒𝑒𝑒𝑒𝑒𝑖𝑖 + 𝛽𝛽3 𝑒𝑒𝑒𝑒𝑒𝑒𝑖𝑖 2 + ∑𝑗𝑗∈𝐼𝐼𝐼𝐼𝐼𝐼𝐼𝐼𝐼𝐼𝐼𝐼𝐼𝐼𝐼𝐼 𝛽𝛽𝑗𝑗 𝐼𝐼𝑖𝑖𝑖𝑖 + 𝜇𝜇𝑖𝑖 , where exp is the years of experience, exp2 its square, school is the years of schooling, Ij is a dummy indicating the industry of the worker. The return of schooling is captured by the parameter 𝛽𝛽1 . 39
44
However, the rate of return to tertiary education has remained high. We also calculated the rate of return by level of education. 40 We found that there is a moderate return to completing primary (between 3% and 4%), and a lower return to completing secondary. Even more important, the return to secondary schooling has decreased considerably during the previous 15 years, falling from 3% in 2001 to 1% in 2015 (even turning negative in 2011 and 2012). This may be the consequence of an increase in the number of workers with secondary education relative to primary education (a supply effect), coupled with an increase in relative wages of people with only primary education due to the construction boom (a demand effect). Both effect temporarily rendered the time invested in pursuing secondary education unprofitable; unless the person continues up to college. In fact, even though the number of workers with tertiary education also went up during the period, the return to tertiary schooling slightly increased in Panama, from below 4% to 5% in 2015, with a brief period between 2011 and 2012 of rates as high as 6%. Figure 43. Panama: Returns to Schooling (2001-2015)
The main engine of growth over the previous decade (by non-residential public and private investment in construction) has not faced workforce bottlenecks because it demands mostly low-skilled workers. This is consistent with decreasing average returns to schooling. However, as pointed out above, it is unlikely that the demand for non-residential construction keeps on growing at the same pace. Other engines demanded more skilled workers such as logistic, transport and communication services, will eventually takeover. Such a transition might bring a difficult labor
We ran the regression: ln(𝑤𝑤𝑖𝑖 ) = 𝛽𝛽0 + 𝛽𝛽𝑝𝑝 𝐷𝐷𝑝𝑝𝑝𝑝 + 𝛽𝛽𝑣𝑣 𝐷𝐷𝑣𝑣𝑣𝑣 + 𝛽𝛽𝑠𝑠 𝐷𝐷𝑠𝑠𝑠𝑠 + 𝛽𝛽𝑡𝑡𝑡𝑡 𝐷𝐷𝑡𝑡𝑡𝑡𝑡𝑡 + 𝛽𝛽𝑡𝑡𝑡𝑡 𝐷𝐷𝑡𝑡𝑡𝑡𝑡𝑡 + 𝛽𝛽2 𝑒𝑒𝑒𝑒𝑒𝑒𝑖𝑖 + 𝛽𝛽3 𝑒𝑒𝑒𝑒𝑒𝑒𝑖𝑖 2 + ∑𝑗𝑗∈𝐼𝐼𝐼𝐼𝐼𝐼𝐼𝐼𝐼𝐼𝐼𝐼𝐼𝐼𝐼𝐼 𝛽𝛽𝑗𝑗 𝐼𝐼𝑖𝑖𝑖𝑖 + 𝜇𝜇𝑖𝑖 , where D is a dummy if the person finished a given education level (p = primary, v = vocational, s = secondary, tn = tertiary non-university, tu = tertiary university). The return of schooling per level of education is calculated relative to the immediate inferior level. For instance, the rate of return for primary education compares the gain of those with complete primary schooling to those with none, taking into account the foregone earning while studying (𝑟𝑟𝑝𝑝 = 𝛽𝛽𝑝𝑝 /6), the rate of return for secondary education does the same, but against those with primary (𝑟𝑟𝑠𝑠 = �𝛽𝛽𝑠𝑠 − 𝛽𝛽𝑝𝑝 �/6), and so forth. See: Montenegro, C. and H.A. Patrinos (2014). 40
45
market dynamic in Panama, as the demand for more abundant low-skill workers diminishes, and the demand for relatively more scarce skilled workers increases.
6.5 Industrial occupation by level of education Panama has focused its policy efforts on becoming an international logistic hub, leveraging on the Canal, its international finance center, logistic and transportation provided by ports and airports. We can evaluate the evolution of this policy from both a production and an employment standpoint. As reported above, from 1996 to 2014 the relative shares of economic sectors remained almost unchanged, except for the major expansion in construction. Construction has been able to accelerate economic growth, providing jobs to lowly educated workers, thus increasing rapidly GDP per capita while reducing poverty and economic inequality. In fact, in the last census, this sector employed 15% of the workers with complete primary schooling, just second to agriculture and retail trade. However, the question remains on what will happen after the construction boom recedes. There is a dual job market for workers with primary education in Panama. Panamanian workers with primary education work in two types of industries. On one hand, there is a large group employed in industries with relatively low returns to schooling (between 3.3% and 3.4%), such as agriculture (18.6% of Panamanian workforce with primary education), construction (15.3%), and domestic services (8.3%). On the other hand, there is a smaller group employed in industries with relatively high returns (between 4.3% and 4.6%), such as retail (14.7%), manufacturing (8.0%), transportation and storage (6.8%), hotels and restaurants (5.9%). In general, there seems to be a dual job market for workers with primary education in Panama. However, in the case of foreign-born workers with primary education, the majority works in high return industries, such as retail trade (35.7%), hotels and restaurants (10.1%); whereas a smaller group works in low return ones, mostly domestic services (15.3%) and construction (9.3%).
46
Figure 44. Workforce w/primary education by industry (2010)
Workers with secondary education are mostly concentrated in retail trade and lower return activities. Unlike workers with primary education, the rate of return to work in retail trade for a person who went through the six years of secondary education is relatively less attractive than in other industries (5.8% return vs. an industry average of 6.7%), but most Panamanian workers with secondary education work there (18.8% of workforce with secondary education). The same happens with manufacturing (5.6% return), construction (4.8%), and public administration (4.3%); each of which absorbs an important part of the workforce with this educational level (7.6%, 9.6% and 9.0%, respectively). To the contrary, agriculture; finance, insurance and real estate (FIRE); and transportation and storage, all have higher rates of return (between 9.1% and 10.2%), but only the latter employs a sizeable part of the workforce (8.9%). At this level of education, the distribution of industries among foreign workers is somewhat similar to that of the native-born.
47
Figure 45. Workforce w/secondary education by industry (2010)
Most native-born workers with college degree work in education, and few of them work in the industries with the highest returns. Among native-born Panamanians, almost a third of the most educated workers labor in two low-return activities: education and public administration. The rest are distributed among industries with relatively higher returns, such as transportation and storage, health and social work, professionals, finance, insurance and real estate, and retail trade. The relation between the ranking of returns and the distribution of educated workers might imply that there is a relative scarcity of workers in the most profitable industries, in spite of the overall high level of workers with tertiary education. Interestingly, at this level of education foreign workers are more evenly distributed across industries than native-born ones, and have a larger share in industries with larger returns.
Figure 46. Workforce w/tertiary education by industry, 2010
48
Educated foreign workers are mostly managers and professionals, and within the latter group, they specialize in different professions than native-born ones. While most of nativeborn workers with university education are professionals (44.2%), most of educated foreign workers are Managers (30.3%) or Professionals (31.1%). In fact, in many industries the high-level managerial positions are filled mostly by foreigners, such as in the manufacturing of furniture or cement. This suggests that educated foreigners are either filling up a gap of people with managerial skills, or are being brought by their companies when moving into Panama. Moreover, within the broad “professional” category, foreign professionals are more evenly spread among different specific categories than natives, which are mostly primary and secondary school teachers (17.3% and 10.4%, respectively), followed by accountants (7.0%) and lawyers (6.9%). To the contrary, foreign professionals are mainly civil engineers (5.8%), lawyers (5.5%), general medical doctors (4.9%), and architects (4.1%). 41
Figure 47. Workforce with tertiary education by occupation (2010)
On the supply side of education, most Panamanian students seem to be partially responding to the higher returns in some under-filled industries. In 2004, the six university careers with
All of these specific categories of employment for foreign professionals are restricted by Law to Panamanians (see footnote 50). That apparent contradiction might be explained by the fact that most of these professionals either belong to the “Group of Friends Countries” (Lista de países amigos) or have been brought by multinationals under the SEM Law, and/or operate from the different special economic zones. Another possibility, widely mentioned in the interviews performed by the Harvard CID team, is that some foreigners are employed in this capacity, but as they are not legally permitted to sign documents or carry other formal procedures, these are then done by Panamanian workforce explicitly hired for those purposes. 41
49
most students were business administration (29%), education (15%), Humanities (7.3%), 42 law (6.5%), Engineering (6.4%) and Health (6.0%) 43. In 2013, the first four had lost share to the latter two: engineering (18.7%) and health (9.9%), two careers associated with high-return industries. However, there are still some careers, such as agriculture, forestry and fisheries and manufacturing and processing (it includes mining) that are also associated to high-paying industries, but are not increasing their share among university students. While the distribution changes, could foreigners fill the gap?
Figure 48. University students by career group (2004 and 2013)
Highly educated foreign workers are not only working in different industries and occupations than Panamanians, but they are also earning more within the same industry and occupation. We regressed income on schooling and experience among all workers, controlling not only by industry and occupation, but also by the origin of the worker (if she is native-born or not). 44 We have found that foreign workers are associated to a 47% average premium on their salaries. 45 Among productive occupations, foreigners have a higher premium in “skilled agricultural, forestry and fishery workers” (73%), “management occupations” (70%), “professionals, scientists and intellectuals” (55%), and “services and sales workers” (54%). Regarding industries, we found higher premiums in “transportation and storage” (72%), “agriculture, forestry and fishing” (70%), “mining and quarrying” (55%), domestic service (55%) wholesale trade (54%), and manufacturing (50%). Humanities includes the following careers: religion and theology; language, literature and linguistics; history and archeology; philosophy and ethics. 43 Health includes medicine and dentistry. 44 We also controlled by gender and ethnicity. 45 This result holds even when comparing only people with university education (foreigners earn 31% more) 42
50
Figure 49. Foreign wage premium by industry and occupation (2010)
Whether foreign workers are more qualified (a quality of education argument) or they carry new know-how, native workers benefit. The previous finding can be associated to two different phenomena. On one hand, foreign workers may have received an education of better quality in their home country, which comes to supplement the low quality reported above on Panamanian education. On the other hand, they could be actually bringing new productive know-how (even within industries) to the Panamanian economy that would not have been there otherwise (or would have taken more time to develop). Although we have not been able to tell these competing hypothesis apart, we did find evidence of positive spillovers (no native workers) from the presence of foreigners. We found that a higher presence of foreigners is associated to higher native-workers’ income, after controlling for schooling, industry and occupation. 46 Within industries, the effect was higher in construction and transport and storage; among occupations, it was higher in agriculture and machinery operators. There are several conclusions from this section. First, at primary and secondary education level, most of Panamanians work in non-tradable industries (construction and retail). Second, among those with primary education, the majority works in low-productivity agriculture. However, among those with higher levels of education, agriculture becomes the industry with the highest returns. This feature is probably reflecting the contrast between a more old-fashion, large agricultural sector with low productivity, coexisting with a much smaller, modern, and export-oriented agriculture. Third, returns to schooling have decreased mainly due to the effects that the construction boom has on the unskilled labor demand in detriment to mid-skill workforce. Fourth, among the most educated Panamanians, a majority work in industries with lower returns, a pattern that is already (slowly) changing (based on the most recent distribution of university students across career groups) and that We were able to run an IV estimation by instrumenting the percentage points change in the share of immigrants between 2000 and 2010, with a dummy that identified those industry-province where foreign companies installed due to Law 41. 46
51
is partially compensated by the presence of highly-educated immigrants. Immigrants have raised the bar of growth, filling the gaps in skilled labor and bringing new productive capabilities to Panama. At last, the presence of immigrants not only is positive for the economy as a whole, but has positive spillovers that benefit native-born workers in the same industry and area.
As the construction boom recedes and Panama comes to rely more on its modern service sector as an engine for growth, some significant changes will occur in its labor market dynamics. On the one side, the demand of low-skill workers characterizing construction might subside, whilst the demand for skilled workers coming from the modern service sector will rapidly face a constraint. This trend is already occurring, as it was common to hear in all of our interviews within the service sector about the difficulties of finding skilled workers. This piece of anecdotal evidence has a more formal precedent in a survey published in 2010, reporting that 19% of Panamanian firms considered “inadequately educated workforce” as a major constraint. Back then, this was considered the third largest constraint, only behind “corruption” (20%, more on this in Section 7.2) and “the courts system” (22%). 47 Five years later, another survey ranked “quality of education” as the second most problematic factor for doing business, just below “inefficient government bureaucracy” and above “corruption”. 48 Our econometric analysis only confirmed that skilled workers are indeed scarce, as evidenced by the large wage-premiums they received when compared with similar Panamanians working in the same industry and district.
These results are more concerning in light of the existing barriers to hire foreign workers in Panama. There are many professions reserved “only for Panamanians”, 49 regardless of considerations on their relative scarcity. For instance, foreigners with degrees in agricultural sciences are banned to work in Panama since 1961, even though we have seen evidence that this is a sector with high returns that does not seem to be attracting enough native professionals. Also, citizens from a list of 50 countries comprising mostly African and Asian republics are considered national security concerns and required “authorized visas”, regardless of their skills and experience. These regulations are preventing Panama from attracting and retaining the people with the know-how and capabilities it requires to continue growing at a sustainable pace. 47 However, it is true that Panama had lower percentages than the Latin American and Caribbean average, and even than Costa Rica, Chile and Uruguay. Source: Enterprise Survey (2010), World Bank. 48 Source: Global Competitiveness Report 2015-2016, World Economic Forum. 49 Restricted professions, with the corresponding year of the Law or Decree in parenthesis are: education with the following specializations: history, geography and civism (1946), nursing (since 1954), barbering and cosmetology (1956), odontology (1956), architecture (1959), agricultural sciences (1961), pharmacy (1963), civil engineer (1965), chemical engineer (1965), chiropractic (1967), nutrition (1969), medicine (1970), psychology (1975), medical assistantship (1975), accountability (1978), journalism (1978), laboratory technicians (1978), public relations (1980), speech therapists (1980), medical radiology (1980), economics (1981), social work (1981), veterinary (1983), physiotherapy (1984), law (1984), dental assistant (1994), sociology (1996), chemistry (2001).
52
53
7. Low appropriability: Government failures 7.1 Macroeconomic risks Panama’s overall macro-management of the economy has been appropriate. As we have already seen previously, the unemployment rate considerably decreased during the previous 25 years, while inflation rates remained at relatively low levels. Even though it is true that inflation increased during the years of high growth (more than 4% in 2007 and more than 8% the following year), since 2011 it has converged again to its previous levels (near 0%). For this reason, it is unlikely that an inflation tax could be a binding constraint to growth in the near or medium term. The period of high growth has coincided with increasing fiscal deficits. Between 2004 and 2007, the primary balance of the Central Government 50 improved from a deficit of 1.16% to a surplus of 4.34%. However, a deteriorating trend in the fiscal balance started in 2007, that has turned a 4.0% of GDP surplus into a 2.83% of GDP deficit (2014). Among the different expenditure categories, “Direct Expenses” stands out as the one increasing faster, going from US$677 million in 2002 (17.9% of total expenditures) to US$3,360 million in 2014 (34.2%). Although the fiscal deficit is still at a manageable level, the trend mirrors a period of high growth associated to heavy public investment. Both the nature and size of public investment projects carried out over these years are not permanent. It will increase the stock of fixed capital of the economy and open new opportunities for other sectors in the economy, but is unlikely to drive growth at the same pace in the near future. Figure 50. Primary Balance of the Central Government (1990-2014)
Debt service has stayed constant, while the Public Debt stock has decreased relative to the size of the economy. In spite of the increasing primary deficits, debt service stayed approximately constant in dollars (US$1,392 million in 2007, US$1,365 million in 2014), and even decreased as a share of total expenditures (from 31.8% to 13.9%), and as a share of total GDP (from 6.6% to
50
Without including financial expenses, such as debt service.
54
2.8%). Moreover, even though the stock of public debt increased during these seven years from US$10.5 billion to US$18.2 billion, as a share of GDP it actually shrank from 50.0% to 37.1%. Figure 51. Public debt: service and stock (2000-2014)
Panama also has one of the longest average maturities for domestic public debt in Latin America, and has been consistently rated investment grade. As mentioned above, Panama almost duplicated its stock of public debt (out of which 79% is external debt) while keeping good credit ratings (investment grade) 51, and low spreads on its sovereign bonds. 52 This is symptomatic that financial markets are not worried about the country’s debt sustainability. Based on the available evidence, it seems unlikely that macroeconomic management will be a binding constraint for growth.
By mid-2016, Standard and Poor’s rated Panama’s bonds as BBB (stable), Moody’s as Baa2 (stable) and Fitch as BBB (stable). All of them, while in the so-called “investment grade” area, are of medium credit rate quality. Panama ranked fourth in the region, after Chile, Peru and Mexico, above Uruguay, Colombia and Costa Rica. 52 Panama’s Sovereign Bond Interest Rate Spread has remained between 130 and 230 basis points over US Treasuries between 2007-2014 (except for a brief exception during the 2008 crisis). In this last year, Panama´s country risk was fifth in the region, after Chile, Peru, Colombia, and Mexico. 51
55
Figure 52. Latin America: Average remaining maturity of public domestic debt (2015)
Source: IADB.
56
7.2 Microeconomic risks Microeconomic risks include issues such as excessive red tape, high tax rates, tax administration, regulations, corruption and property rights, and crime. In all these, Panama performs better than the Latin American average, and by some indicator seven better than the OECD countries. There only seems to be one exception: corruption (see section 7.7).
7.3 Tax rates and administration Panama has low tax-revenue as share of GDP, mostly because low-VAT revenue. Tax revenues in Panama were already low in 2002 (11.2% of GDP), but they kept declining until 2007 (8.0%). There recovered in 2010 (11.7%), and then started declining again. By 2014, tax revenues were just in 10.7% of GDP, among the lowest rates in the region. Low total public revenues are mainly driven by low VAT tax revenues; since in Direct taxes and Social security contributions the country ranks much higher. Figure 53. Tax revenue (2013)
Indirect tax rates in Panama are by far the lowest in the region. Value Added Tax (VAT) remained at 5% from its implementation in 1977, all the way down to 2010, when it was raised to 7%. Still, it is less than half the average VAT in Latin America (15%). Income taxes (for both natural and legal persons) are slightly less than the regional average. In both cases the maximum rate in 2015 was 25% (down from 30% in 2000), whereas the regional averages are 27.9% for legal persons, and 26.6% for natural persons. On top of this, there are many tax exemptions in place in Panama. For instance, since 2004 there is a special regime for multinational companies’ headquarters (Law 41), granting tax benefits not only to the companies53 but also to their management personnel. 54
Multinational corporations are exempt from payment of income, dividend and complimentary taxes on the services they provide to parties that do not generate taxable income in Panama. 53
57
Figure 54. Tax rates (2015)
Almost no firm considered taxes as a binding constraint in Panama. In 2010, only 2.2% of Panamanian firms considered “tax rates” a major constraint. The figure is many orders of magnitude lower than the Latin American average (32.9%), and even the OECD countries (23.6%). Moreover, only 4.6% of firms considered the “tax administration” to be a major constraint, compared to the 21% in Latin America and 11.5% in high income OECD countries. Most of multinational firms setting their headquarters in Panama were precisely attracted by the tax-breaks offered. This feature, together with favorable business environment, public security, and political stability; were quoted as the main drivers of their decision to move in, within the course of the interviews we conducted.
7.4 Labor market On a previous Growth Diagnostics exercise, Cárdenas and Salazar (2007) made the argument that labor regulation was a strong obstacle for business in Panama. They stated that the labor code was complex and rigid. The ratio of days-paid to days-worked was high (1.66 in Panama against 1.26 in Mexico and 1.34 in Costa Rica); it was difficult to hire and dismiss workers; there were many restrictions to hire foreign workers; there was limited wage flexibility; and the minimum wage was too high, leading to high levels of youth unemployment and informality. Using information from the Doing Business database, we found mixed performance of Panama’s labor regulation relative to other countries in the region. On one hand, it seems that in terms of direct costs, Panama is neither better nor worse than the rest of Latin America. For
The foreign management personnel of multinationals are exempt from payment of income tax, social security and education contributions so long as their salaries are paid from abroad. Moreover, they are also allowed to import household items without the payment of custom duties on their first arrival to the country. 54
58
instance, although the minimum wage in Panama is the fifth out of 17 countries (US$ 477.55 55), it is the sixth lowest relative to value added per worker (0.34%). Additionally, there is no notice period for redundancy dismissal in Panama, unlike many Latin American countries, and the severance payment is equivalent to just 18.1 weeks of salary (sixth lowest). That shall be put into the context where two countries do not allow redundancy dismissal (Bolivia and Venezuela), the leader demands a payment of 31.8 weeks of salary (Ecuador), and the lowest runs at 8.9 weeks of salary (Brazil). On the other hand, it is true that Panama underperforms in some other aspects. For instance, there are restrictions on weekly holiday and overtime work, although most of countries in the region do not have them. Moreover, the paid annual leave average is 22 working days, higher than many of Latin American countries, particularly Chile (15), Colombia (15), Dominican Republic (14), and Costa Rica (12).
Figure 55. Minimum wage and severance payments (2015-2016)
We did not find evidence to support the claim that the minimum wage or youth unemployment are too high. In fact, recent data show that youth unemployment in Panama actually decreased from 2002 (28%) to 2013 (10%). Although by 2014 it increased to 11%, it was still below that of high income OECD countries (17%) and near the average of the region, with a rate equivalent only to a third of the one in the Dominican Republic (31.4%), but twice that of Bolivia (5%).
55
The study uses as a reference worker a nineteen-year-old cashier with one year of work experience.
59
Figure 56. Youth Unemployment (1990-2014)
The evidence we analyzed does not indicate that labor costs have been binding in the past decade. We analyzed indicators of possible performance gaps, but not how binding these might be. Using data from the Enterprise Surveys for 14 Latin American countries, 56 Kaplan (2008) estimated the net permanent employment gains that would had been in the “absence of rigid labor regulations” in the 2005 fiscal year. The average for the group of countries was 2.0%, with a minimum of 0% (Nicaragua) and a maximum of 5.3% (Colombia). The figure in Panama, mere 0.4%, suggests that labor rigidities might not have been a binding constraint that year. Finally, there are subjective reports showing that labor regulations are not considered as major problem by firms in Panama. In 2010, only 4.9% of Panamanian firms considered “labor regulations” as a major constraint. In contrast, the figure for Latin America was 15.9%; 11.3% for OECD countries. Whereas in other relatively successful countries in the region, labor regulations were considered a more serious issue (Chile, 28.5%, Costa Rica, 19.9%, Uruguay, 25.5%), the percentage in Panama remained in single-digits across all firm sizes and sectors.
The 14 countries were: Argentina, Bolivia, Chile, Colombia, Ecuador, El Salvador, Guatemala, Honduras, Mexico, Nicaragua, Panama, Paraguay, Peru and Uruguay.
56
60
7.5 Red tape Red tape, a term referring to excessive regulation or rigid conformity to redundant bureaucratic rules, does not seem to be a major problem in Panama. Only 5.2% of firms in Panama considered “business licensing and permits” as a major constraint, close to the 4.9% in high income OECD countries, and lower than the 17.1% average for Latin America. Moreover, only 2.7% considered “customs and trade regulations” as a major constraint, a figure lower than the Latin American and rich countries’ averages (18.6% and 4.5%, respectively). In line with this, Panamanian firms on average need 25 days to obtain a construction-related permit, vis-à-vis 83.8 days in the region and 137 days in the high-income OECD countries. However, that does not mean there is no room for improvement. Firms considered that their senior management personnel spent a third of their time dealing with the requirements of government regulations, twice the Latin American average (14%) and three times the OECD countries’ average (9.7%). Moreover, Panamanian firms needed 66 days on average to obtain a license, while the regional average was 45.6 days, 49.9 in OECD countries. Over the course of the interviews we carried in Panama City, we noticed that complaints around red tape coming from business that imported to sell within Panama were significantly higher than from import-export firms. Also, among the most valued features of the Special Economic Zone in Panama-Pacifico, the one stop shop feature came on top. Clearly, there is room for improvement, but there is not enough evidence to regard red tape as a binding constraint to growth.
7.6 Crime Crime does not seem to be a major issue in Panama yet. Back in 2010, crime was ranked as the fourth major constraint by Panamanian firms. However, only 8.2% firms did so, even lower than in rich countries (9.9%), and considerably below the number for Latin America (34.5%). Consistent with that, the percentage of firms paying for security in Panama was 36.3%, almost half the Latin American average (61.4%) and half the average of OECD countries (64.6%). Five years later, “crime and theft” was considered only the 8th out of 16 most problematic factor by executives. Also, according to the 2016 Bureau of Diplomatic Security of the United States, homicides, armed robbery, and simple theft, were reported steadily declining. 57 Considered together, all the pieces of information we had access to do not indicate that crime and theft are or might become soon a bottleneck for economic growth.
United States Department of State, OSAC Bureau of Diplomatic Security, Panama 2016. https://www.osac.gov/Pages/ContentReportDetails.aspx?cid=19534 57
61
7.7 Corruption In 2010, corruption was clearly the issue selected by most firms as a constraint, and in particular the court system. That year, 22.1% and 20.4% of firms in Panama considered “the court system” and “corruption” as major constraints, respectively. Although these may not seem large percentages, they stand out compared to other potential issues affecting firms in the country, all in single digits. Moreover, relative to other countries, while the percentage that chose “corruption” is still lower than the regional average (43.9%), it is twice the share in OECD (10.8%) and Chile (12.5%). The situation is worse when it comes to the judicial system. Although Panama is still above the regional average (28.4%), it is three times higher than OECD (7.1%), and more than twice the region’s leaders Chile (12.5%) and Uruguay (12.0%). Taking the answers at face value, corruption in Panama seems to manifest more clearly when firms need “to get things done”. Neither bribery incidence nor its depth were high by regional standards. With respect to bribery, 7.1% of firms in Panama experienced at least one bribe payment request, compared to 10.4% in Latin America, and 1.7% in OECD countries. At the same time, in 6.7% of public transactions a gift or informal payment was requested, compared to 7.1% in Latin America and 1.2% in OECD. The problem seems to lie in the expectation of making gifts to public officials in order to obtain a license (to operate or to import) or a connection to a public service (e.g. electricity and water) required to function. Even higher is the share of firms that considered that peer companies in their industry are making informal payments or providing gifts to public officials to "get things done” with regard to customs, taxes, licenses, regulations, services, etc. (30.5% versus 11.3% in Latin America, and 8.4% in OECD). It is difficult to gauge the economic cost of corruption in Panama, let alone to determine if it currently can be considered among the most binding constraints to growth. We have seen that corruption and the judicial system were more likely to be reported by firms in Panama as major constraints. However, we cannot know if the high growth rates during that time were achieved in spite of corruption, or if the construction boom and the bonanza that ensued actually increased the potential for corrupt exchanges. Moreover, the data we have considered is six years old, an important detail to be considered in the face of a new government that has made the fight against corruption one of its political flags.
62
8. Low appropriability: Market failures For a small open economy as Panama to grow sustainably, the ability to sell goods and services abroad is a must. Small countries do not produce all the goods and services its population demands, hence it needs to import some of them. In order to afford that, they need to be able to export back to other markets. We have seen that in the aggregate Panama performs well in services exports, but it is among the worst performers regarding goods. In per capita terms, Panama not only exports more services than any other country in the region, but it reaches levels associated to rich economies. However, on the goods side, Panama´s exports are concentrated around a few goods of very low complexity. Overall, Panama exports less goods per capita than any other economy in the region. In terms of composition the situation does not look as bright. On the services side, Panama indeed exports a large amount relative to its population size, most of it related to the traffic of the Canal. Its most important new development has been in the air transport of passengers. In other services sectors, such as ICT and intellectual property, Panama’s performance is not as impressive, although these sectors are such at an infant state in Latin America that Panama still ranks above average. Modern economic production requires the simultaneous presence of several capabilities. According to Hausmann et al (2011), the most modern and dynamic sectors require the presence and coordination of different productive know-how, or ‘capabilities’. For this reason, these sectors are usually present only in those economies that have managed to accumulate the diversity of skills that is required. The industries (or products) and the economies in which they are present are located along a complexity gradient: more complex industries tend to be feasible in more diverse economies because productive diversity is a reflection of the presence of the capabilities required by them. We can see this in Figure 57, where we find the usual pattern that countries with high diversification of exports also tend to reveal comparative advantage on products that fewer other countries are able to make. 58 Seen this way, long-term economic development depends on the increased complexity of the economies and their productive capacities, which is expressed in a greater diversity and complexity of products and industries.
Since we have been comparing Panama to other Latin American countries and to the high-income OECD countries, we only show this subset of countries in the figure. 58
63
Figure 57. Diversity and average ubiquity of exports (2014)
The increase of economic complexity can be limited by the difficulty of solving coordination problems. Diversification requires the appearance of industries that are not present yet. These industries may require capabilities that are not available in a given economy, and thus they cannot develop. Moreover, there are no incentives for workers in this economy to acquire such capabilities, because the industries that would require them are not present. The severity of this “chicken-andegg” dilemma depends on how "close" is the productive capacity of the economy with respect to the new industries to where it could diversify. In Panama, the high growth period was accompanied by increasing diversification and decreasing average ubiquity, but since 2012 these trends have reversed. The Panamanian export basket did not only diversify from 2003 to 2012, but it did so into products that fewer other countries were able to make (i.e. with a decreasing average ubiquity). Based on our previous reflection, this was good news for the economy in the long run. Unfortunately, since 2012 both trends reversed, and by 2014 Panama’s diversification and average ubiquity were back at 1990 and 2003 levels, respectively.
64
Figure 58. Panama: Evolution of Diversity and Ubiquity of exports (1990-2014)
By 2014 Panama’s export basket had an average level of diversification and a high average ubiquity by regional standards. In spite of the reverse in trend, in 2014 Panama had a mid-level of export diversification relative to other countries in Latin America. However, it was still lower than most of high income OECD countries. Moreover, Panama’s export basket had a relatively high average ubiquity, meaning those goods that Panama is able to export require vary basic capabilities, which in turn many other countries on average produce. Figure 59. Diversity and average ubiquity of exports, 2014
Based on its ECI, Panama still has some room to grow. If we compute a ubiquity-weighted average of the goods exported by Panama, and then calculate again diversity, we would obtain a more precise measurement of the stock of capabilities. Likewise, if we compute a diversity-weighted index of countries that export a given product, and then calculate the average ubiquity of a product, we would also obtain a better measurement of it. If we keep doing this iteratively, both numbers will 65
converge to what we call Economic Complexity Index (ECI, our measure of the productive capabilities in a given economy) and the Product Complexity Index (PCI, our measure of the productive capabilities required by a given product). Hausmann et al. (2013) showed that in the medium to long-run (5-10 years) countries tend to converge to a level of income that is related to its ECI. Countries with greater economic complexity relative to their income level tend to grow faster; whilst countries with lower relative complexity growth at a slower pace. In 2014 Panama had a level of income that was slightly lower than would have been predicted by its ECI. In order to guarantee the sustainability in the long-run, Panama needs also to increase the stock of economic capabilities in the economy. Figure 60. Economic Complexity and GDP per capita (2014)
Panama can (and should) continue diversifying its economy. Hausmann et al (2011) show that economies tend to diversify into sectors that require further similar productive capacities to which the region already has, which reduces the intensity of the problems of the chicken and the egg that involves diversification. Therefore, it is easier for an economy to progress if the current activities are "close" to activities that are not yet present. The Complexity Outlook Index (COI) measures how close the production capacity of an economy with respect to the possibilities of diversification. Plotting both indices (ECI and COI) in a graph is a useful exercise to get a sense on where Panama stands today in terms of productive capabilities and how difficult would it be for it to diversify them. Initially, as countries develop and diversify their productive capabilities, the ECI and the COI tend to increase together, i.e. as they accumulate capabilities, more opportunities to combine them with others appear. However, there is a point where a given economy has already accumulated enough capabilities, such that adding new ones decreases the potential for diversification, once the country is already diversified throughout most of the range of available activities. When a country reaches such a point (such as Germany), the nature of economic growth changes: it is no longer an issue of acquiring productive capabilities that are available somewhere else, but to create new ones (in economic jargon, to push out the technological frontier). As can be seen in the next figure, relative to the 66
region, Panama is located among the Latin American countries with the highest ECI, although its COI is low. Having said that, when we compare it with other higher-income economies, we can see that Panama is still far from the absolute potential on the ECI scale. Figure 61. Economic Complexity and Complexity Outlook (2014)
The degree of coordination required by the private sector to get out of this balance is not trivial. It is unlikely (or a painfully slow process) that the market left alone to itself will diversify Panama into new industries if the complementary inputs needed are absent. In that situation, the State's role as coordinator (establishing incentives to attract private investment in new capabilities) and provider of complementary inputs (public goods) becomes critical, as the only agent able to address the chickenand-egg problem. An example of the State in action is the success of Panama’s government to, through Law 41, attract more than 100 multinationals’ regional headquarters of diverse industries into the country. Starting with Procter and Gamble and Maersk in 2007, the list today also includes LG (2008), Roche (2008), Caterpillar (2008), Western Union (2008), CEMEX (2009), ABB (2009), Phillips (2009), Nestle (2009), Adidas (2010), Ericsson AB (2010), Unilever (2011), Johnson & Johnson (2011), Hyundai Motors (2011), General electric (2012), Samsung (2012), 3M (2012), Maersk (2013), SONY (2013), Nike (2013), Dell (2014), Daewoo (2015), Schindler (2015), and Yamaha (2015). Even though this shows that state intervention as facilitator makes it possible to attract higher productivity activities, in order to call success, there are still two things to be shown. On one hand, we need to prove that the process has created enough positive synergies among these new industries such that the fiscal benefits that attracted them in the first place are no longer needed to keep them in the country. On the other hand, Panama needs to put in place mechanisms that guarantee that there will be an effective transfer of capabilities into the domestic economy, i.e., to prevent these new industries from being highly productive enclaves without spillovers to the rest of the economy. Panama situation right at the center of the schedule in Figure 61 does indicate that the country may have some opportunities for export diversification within manufactures. Given that current 67
competitive exports are concentrated in low-complexity foodstuffs and minerals, most likely the diversification opportunities lying nearby (in terms of capabilities) are to be found in more downstream products within the Food and Vegetables category. Our complexity analysis based on exportable goods identified as the most attractive opportunities products used by the printing industry (supply materials for newspaper, journals and magazines), paper and paperboard products (paperboard labels, toilet paper, cartons). Beverages also ranked well (water, beer, other fermented beverages), as did other preparations of cereals, flour, and starch (bakery products, malt, cereals). 59 Some diversification opportunities showed up in more complex sectors, such as Chemicals and plastics, but they require more significant jumps in terms of capabilities and know-how. In these cases, the role of the government in solving the chicken-and-egg type of coordination dilemmas must be more active. Dyes, paints and inks (mostly paint and varnishes), plastics (polyamides, plastic sheets, plastic tubes and fittings, packing lids) and soaps, waxes and paints (lubricants, cleaning products, soap) were the sections within this sector that came out with more potential. Identifying potential opportunities for diversification based on exportable goods does overlook the fact that Panama´s strongest capabilities and know-how are to be found in the exportable service sector. That knowledge and the corresponding opportunities that could be developed by redeploying it in the production of more complex goods or services can be incorporated using more disaggregated data coming from the economic and population census. Moreover, such a process allows to identify diversification opportunities within regions, providing a roadmap for a much needed promotion of more diverse economic activity in eastern and western Panama, away from the interoceanic region. Following this approach yields potential diversification opportunities in the modern service sector such as logistics, information and communications in Colon; hotels and restaurants in Darien; and commerce and transport logistics in Chiriquí. In any case, developing further any of these service sectors will demand a different, more complex, set of capabilities at the country and province level (Figure 59). Moving the provinces of Panama out of low-skill sectors that require a relatively low and ubiquitous number of capabilities such as agriculture and fishing (ECI -2.1), mining (-1.3) and construction (0.8); while stirring the wheel towards more complex sector that demand the combination of numerous capabilities such as Hotels and Restaurants (1.2), Retail and Wholesale (1.8), Logistic, transport and communications (2.5), or information (4.2) will demand a strong skill upgrade. Easing migration, knowledge transfer, and technology spillovers not only is a key element but will also allow the Panamanians to combine their capacities into more complex webs of knowledge and get better salaries in return.
59
See Hausmann, R., Morales, J.R. and Santos, M.A. (2016) for a complete profile of Panama productive capabilities and potential opportunities for diversification in goods and services, at national and sub-national level.
68
Figure 62. Panama: Industry Complexity Index
69
Bibliography [1] Bratsberg, B. and D. Terrell (2002), “School Quality and Returns to Education to U.S. immigrants”, Economic Inquiry, 40(2), April. [2] García-Zeballos, A., F. González, E. Iglesias Rodríguez and M. Porrúa (2013) “Banda Ancha en Panamá. Situación actual, retos y oportunidades para el crecimiento económico y la inclusión social”, Inter-American Development Bank. [3] Gobierno de la República de Panamá (2016). El Mercado Eléctrico de Panamá, junio 2016. [4] Gobierno de Panamá (2016). “Panamá: Plan Energético Nacional 2015-2050”. Secretaría de Energía de Panamá, Julio 2016. [5] Hausmann, R., C. Hidalgo, S. Bustos, M. Coscia, S. Chung, J. Jiménez, A. Simoes and M.A. Yildirim (2013), The Atlas of Economic Complexity: Mapping Paths to Prosperity. Cambridge MA: Puritan Press. [6] Hausmann, R., B. Klinger and R. Wagner (2008), “Doing Growth Diagnostics in Practice: A ‘Mindbook’, CID Working Paper No. 1777, John F. Kennedy School of Government, Harvard University. [7] Hausmann, R.; D. Rodrik and A Velasco (2005), “Growth Diagnostics”. Cambridge: John F. Kennedy School of Government, Harvard University. [8] Hausmann, R., Santos, M.A. and Obach, J. (2016). “Special Economic Zones in Panama: A critical assessment”. Harvard Kennedy School Faculty Research Working Paper No. RWP 16044, September 2016. [9] Hausmann, R., Morales, J.R. and Santos, M.A. (2016). “Economic Complexity in Panama: Assessing opportunities for productive diversification”. Harvard Kennedy School Faculty Research Working Paper No. RWP 16-046, October 2016. [10] International Monetary Fund (2015) “Panama: 2015 Article IV Consultation – Press Release; Staff Report; and Statement by the Executive Director for Panama”, IMF Country Report No. 15/237, August 2015. [11] Montenegro, C. and H.A. Patrinos (2014), “Comparable Estimates of Returns to Schooling Around the World”, Policy Research Working Paper 7020, World Bank. [12] Organization for Economic Co-operation and Development (OECD). (2010). PISA 2009 results: what students know and can do: student performance in reading, mathematics and science (volume I). OECD, Paris, France. [13] Schwab, K. y X. Sala-i-Martin [eds.] (2015), The Global Competitiveness Report 2015-2016. Full Data Edition. World Economic Forum. [14] Van der Marel, E. and B. Shepard, (2013), “International Tradability Indices for Services”. Policy Research Working Paper 6712, World Bank. [15] World Bank (2015). “Panama: Locking Success. A systematic country diagnostic”. 70


![[eBook] Download The Growth Gears: Using A Market ... - Google Sites](https://m.moam.info/img/260x300/ebook-download-the-growth-gears-using-a-market-goo_64781cf5097c4796708c72bc.jpg)

![[PDF] Download The Growth Gears: Using A Market ... - Google Sites](https://m.moam.info/img/260x300/pdf-download-the-growth-gears-using-a-market-googl_647727d5097c4737708b6360.jpg)
![[PDF] Download The Growth Gears: Using a Market ... - Google Sites](https://m.moam.info/img/260x300/pdf-download-the-growth-gears-using-a-market-googl_64786ca0097c4744708cd0c9.jpg)


![[PDF] The Growth Gears: Using a Market-Based ... - Google Sites](https://m.moam.info/img/260x300/pdf-the-growth-gears-using-a-market-based-google-s_647848cc097c474c228cf6b6.jpg)
![[Download] [PDF] The Growth Gears: Using a Market ... - Google Sites](https://m.moam.info/img/260x300/download-pdf-the-growth-gears-using-a-market-googl_64789bfd097c4737708cfe30.jpg)
![[PDF] Download The Growth Gears: Using A Market ... - Google Sites](https://m.moam.info/img/260x300/pdf-download-the-growth-gears-using-a-market-googl_64781639097c474b228ccd47.jpg)