1Collaboratory for Advanced Computing and Simulations, Departments of Materials Science ... with heteronuclear bonds, SiâC, with no phase separation, and no graphitic or diamond structures present. ... studies of a-SiC were performed in an attempt to answer .... the interaction between the valence electrons and ions.
PHYSICAL REVIEW B 70, 045207 (2004)
Short- and intermediate-range structural correlations in amorphous silicon carbide: A molecular dynamics study José P. Rino,1,2 Ingvar Ebbsjö,1,3 Paulo S. Branicio,1 Rajiv K. Kalia,1 Aiichiro Nakano,1 Fuyuki Shimojo,4 and Priya Vashishta1 1
Collaboratory for Advanced Computing and Simulations, Departments of Materials Science and Engineering, Physics and Astronomy, Computer Science, and Biomedical Engineering, University of Southern California, Los Angeles, California 90089, USA 2 Department of Physics, Universidade Federal de São Carlos, São Carlos, SP, Brazil 3 Studsvik Neutron Research Laboratory, University of Uppsala, Nyköping, Sweden 4 Department of Physics, Kumamoto University, Kumamoto, Japan (Received 20 October 2003; revised manuscript received 5 February 2004; published 30 July 2004) Short- and intermediate-range structural correlations in amorphous silicon carbide 共a-SiC兲 are studied in terms of partial pair distributions, bond angle distribution functions, and shortest-path ring statistics. A well relaxed sample is prepared following a slow annealing schedule of the simulation at the experimental density of the amorphous phase. The short-range correlation functions indicate a locally ordered amorphous structure with heteronuclear bonds, Si– C, with no phase separation, and no graphitic or diamond structures present. The bond distances and coordination numbers are similar to those in the crystalline phase. The rings statistics indicate an intermediate-range topology formed by the rearrangement of tetrahedra with the occurrence of corner and edge sharing units connecting two- (⬃5% of total), three-, four-, and five-fold rings. The presence of large size rings indicates the existence of nano-voids in the structure, which explains the low density compared with the crystal phase while keeping the same coordination number and bond distance. These simulation results agree well with experimental results. DOI: 10.1103/PhysRevB.70.045207
PACS number(s): 61.43.Dq, 61.43.Bn, 61.66.Dk, 81.05.Gc
I. INTRODUCTION
Silicon carbide 共SiC兲 has been receiving increasing attention due to its unique mechanical and electronic properties, which make it a promising candidate for engineering and optoelectronic materials, especially for high-power, highfrequency, and high-temperature applications.1–6 Its light weight, high strength, chemical stability, high thermal conductivity, and low thermal expansion allow its use in technological applications such as gas turbines, heat exchangers, and ceramic fans. Its wide band gap, high electron mobility, and high barrier for electron breakdown make it ideal for radar, microwave, solar cell, and high voltage devices. The silicon carbide in the amorphous alloy form, a-SixC1−x, is of additional technological interest due to the temperature stability of its tuning semiconducting properties, which allows unique applications under extreme conditions such as high temperature engines, turbines, and reactors.1 For the application of a-SiC alloys in new devices it is essential to deeply understand its properties and how they are related to its atomic scale structure, in the short and intermediate range. It is also essential to describe how these properties may change with the presence of structural defects. For this purpose inelastic neutron-scattering and neutrondiffraction studies have been used with success to describe the structure and dynamics of amorphous and glassy materials.7–15 To our best knowledge there are no such studies of a-SiC but several other experimental and theoretical studies of a-SiC were performed in an attempt to answer basic questions such as: Does the short-range structure consist of heteronuclear bonds, Si– C, as in the crystal 共c-SiC兲, homonuclear bonds, Si– Si and C – C, or a mixture of them? 0163-1829/2004/70(4)/045207(11)/$22.50
Is there any difference between the structures of the Si and C sublattices? Is there any segregation, phase separation, or voids? How can the intermediate topology be described? Unfortunately the results of recent studies differ widely and have conflicting conclusions. The main issue investigated in these studies is the chemical order, i.e., whether the alloy is made of heteronuclear bonds or not. Most of the experimental studies have shown chemical order, but in different degrees. For example, Katayama et al.16 in their x-ray photoemission and infrared absorption study of the hydrogenated form of a-SiC, a-SiC: H, have shown the presence of heteronuclear bonds, suggesting a completely ordered structure. Using infrared and visible spectroscopy, Rovira and Alvarez17 also reached the same conclusion. Based on energy-filtered electron diffraction of a film of a-SiC prepared by vacuum evaporation, Sproul et al.18 reached the conclusion that only silicon–carbon bonding was present. Using extended x-ray absorption fine structure (EXAFS) and extended electron-energy-loss (EXELFS) on a-SiC and a-SiC: H, Kaloyeros et al.19 have shown chemical order and demonstrated that the Si– C bonds have virtually the same length as in c-SiC. However, using EXAFS and x-ray scattering (XRS), Meneghini et al.20,21 have shown the presence of homonuclear bonding 共C – C兲, as well as a strong tendency for chemical order. Using EXAFS, Pascarelli et al.22 reached the same conclusion. Due to the complexity of the covalent bonding present in the a-SiC theoretical investigations were very limited until Kelires23 performed continuous space Monte Carlo (MC) simulations using the Tersoff potential.24 In this and following studies Kelires et al.23,25–27 have described the a-SiC alloy as an amorphous with significant order, but always with the presence of homonuclear C – C
70 045207-1
©2004 The American Physical Society
PHYSICAL REVIEW B 70, 045207 (2004)
JOSÉ P. RINO et al.
bonds and three coordinated C atoms. However the study of Finocchi et al.,28 performing molecular dynamics (MD) simulations with forces calculated from first principles,29 indicated that a-SiC has negligible chemical ordering. In face of the apparent contrast, between the result of Finocchi et al. and that of Kelires,23 Tersoff30 pointed out that the results could be understood, considering that 15% of the C atoms in the Finocchi et al. simulation were segregated in graphitic regions. Excluding these regions from the statistical counting one could infer a moderate chemical order. Very recent studies still picture different degrees of chemical order in a-SiC.27,31,32 However, Ivashchenko et al.,32 in a tightbinding MD study, pointed out how the final computer generated samples may have significantly different results depending on factors like the initial configuration, even though they found strong chemical order in all their samples. Films of a-SiC usually are made from plasma-enhanced chemical deposition from SiH4 and CH4. Seekamp and Bauhofer33 have shown that thermal annealing of these films can increase their photoluminescence, and asserted that this is a result of structural changes with formation of additional Si– C bonds. Very recently Ishimaru et al.34 using both transmission electron microscopy (TEM) and MD simulations have shown explicitly that the ratio of heteronuclear to homonuclear bonds changes upon annealing. They concluded that chemical order develops as annealing progresses and that the highly ordered a-SiC corresponds to a fully relaxed state of a-SiC. In this paper, we report highly ordered stoichiometric a-SiC structures generated by MD simulations, using a slow annealing schedule. We study the topology of this a-SiC sample in the short- and intermediate-range. The short-range order is described by total and partial pair distribution functions, structure factors, coordination numbers, and bond angles. The intermediate-range order is described through shortest-path rings statistics. The paper is divided into five sections. In Sec. II we describe the interaction potential for a-SiC; in Sec. III we discuss the simulation procedure; in Sec. IV we present and discuss the results and finally present the conclusions in Sec. V. II. INTERACTION POTENTIAL
The interatomic potential model encodes interactions among all the atoms and thus is the essential ingredient of
molecular dynamics (MD) simulations. Our interatomic potential for the a-SiC alloy consists of two- and three-body terms, N
V=
兺 i⬍j
N
V共2兲 ij 共rij兲
+
兺
ជij,rជij兲, V共3兲 jik 共r
共1兲
i⬍j⬍k
where N is the number of atoms, rij = 兩rជij兩, rជij = rជi − rជ j, and rជi is the position of the ith atom. The two-body term represents steric repulsion, Coulomb interactions due to charge transfer, induced charge-dipole interaction due to large electronic polarizability of the anions, and van der Waals (dipole–dipole) interaction: V共2兲 ij 共r兲 =
1/2共␣iZ2i + ␣ jZ2j 兲 −r/r Hij ZiZ j −r/r wij + e 1s − e 4s − 6 , 4 r r r r 共2兲
where Hij and ij are the strength and exponents of the steric repulsion, Zi the effective charge, ␣i the electronic polarizability, r1s and r4s the screening constants for the Coulomb and charge-dipole interactions, and wij the strength of the van der Waals interaction. The three-body term represents covalent bond bending and stretching:
冉
ជij,rជik兲 = Bijk exp V共3兲 jik 共r ⫻
+ rij − r0 rik − r0
冊
共cos ijk − cos 0兲2 1 + Cijk共cos ijk − cos 0兲2
共rij,rik 艋 r0兲, 共3兲
where Bijk is the strength of the three-body interaction, r0 the cutoff radius, and Cijk constants to adjust the stretching and bending terms, and ijk the angle formed by rជij and rជik. 0 in the case of SiC is the tetrahedral angle 109.5°, with cos 0 = −1 / 3. In the present work we use this model with the parameters optimized to reproduce a selected experimental data for SiC. Our fitting database includes crystalline lattice constants, cohesive energies, elastic constants, melting temperature, as well as structural transition pressures which are in excellent agreement with experiments and validate the quality of the
TABLE I. Molecular dynamics and experimental values for lattice constant, elastic constants, bulk modulus, and melting/decomposition temperature for cubic SiC. Also shown are the volume reductions just before and after the structural phase transformation. Properties
MD
Experimental result
Lattice constant 共Å兲 Elastic constants 共GPa兲 C11 C12 C44 Bulk modulus B共GPa兲 B = 共C11 + 2C12兲 / 3 Melting/decomposition temperature (K) Volume reduction just before transition Volume reduction just after transition
4.36
4.36
390 144 179 225 2727 0.78 V0 (V0=initial volume) 21%
390 142 150– 256 225 2557 0.757 V0 (V0=initial volume) 20.3%
045207-2
PHYSICAL REVIEW B 70, 045207 (2004)
SHORT- AND INTERMEDIATE-RANGE STRUCTURAL…
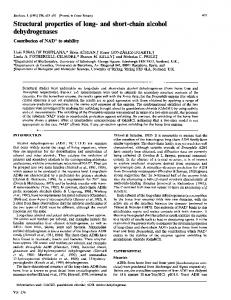
FIG. 1. Energy-volume relations for the crystalline SiC calculated using the present interatomic potential (closed symbols) and by ab initio quantum mechanics calculation (open symbols). Triangles correspond to the zinc-blend structure, while circles correspond to the rocksalt structure.
proposed interaction potential. Table I summarizes these results. This potential has been used to predict a new transition mechanism for the zinc-blend-to-rocksalt structural transition under pressure,35 which was later confirmed by a quantum mechanical calculation based on the density function theory.36,37 To further substantiate the potential and show its transferability, we calculate the energy-volume relationship for the zinc-blend and rocksalt phases of the SiC using ab initio quantum mechanical calculations, based on the density functional theory (DFT). The zinc-blend is the most common
FIG. 2. (Color) Partial pair distribution functions for (a) crystalline 共c-SiC兲 and (b) amorphous silicon carbide 共a-SiC兲 at 300 K.
FIG. 3. Molecular dynamics results for partial pair distribution function (continuous line) and coordination number (dashed line) calculated at 300 K for a-SiC.
of the polytypes of SiC at low pressures,38,39 while the rocksalt is known to be the stable structure at high pressures.40,41 The electronic-structure calculations are based on the generalized gradient approximation42 for the exchange-correlation energy in the framework of the density functional theory.43–45 The ultrasoft pseudopotential46 is employed for the interaction between the valence electrons and ions. The electronic wave functions are expanded by the plane-wave basis set. The energy functional is minimized using an iterative scheme based on the preconditioned conjugate-gradient
FIG. 4. Bond angle distributions for a-SiC calculated at 300 K. Si– C – Si and C – Si– C are peaked at 109° with full width at half maxima of 15° and 16°, respectively. The small peak for C – Si– C at 85° is due to twofold ring connection of the tetrahedra.
045207-3
PHYSICAL REVIEW B 70, 045207 (2004)
JOSÉ P. RINO et al. TABLE II. Calculated and experimental interatomic distances and coordination number for amorphous SiC at 300 K. Amorphous SiC Bond length 共Å兲 Coordination number
MD
EXAFS (Refs. 19 and 22)
1.89± 0.05 3.79
1.86(3) 3.99(4)
method43–47 with a sufficient k-point sampling in the first Brillouin zone. Figure 1 shows the good agreement between the data from the interatomic potential and those from the ab initio calculation. III. MOLECULAR DYNAMICS PROCEDURE
To create a well relaxed a-SiC structure, we use the experimental density and a large system to provide freedom for the short- and intermediate-range structural relaxation. We have used a slow annealing schedule to create the amorphous sample from liquid to get a low energy topology. We simulate an a-SiC sample consisting of 5324 Si and 5324 C atoms (total of N = 10 648 atoms). Periodic boundary conditions are applied in all directions and the equations of motion are integrated using a time reversible integration algorithm48 with a time step of ⌬t = 1.5 fs. Starting from a crystalline cubic zinc-blend structure ( = 3.2175 g / cm3, size of MD box L = Lx = Ly = Lz = 47.939 Å) at 300 K the system is gradually heated until we get a liquid configuration at 3800 K. At this temperature two different systems are generated with two densities smaller than that of the crystalline phase. The densities used are 1 = 3.057 g / cm3 共L = 48.7657 Å兲 and 2 = 2.896 g / cm3 共L = 49.6525 Å兲. This density range corresponds to a density reduction between 10% and 30%, which has been reported previously in experimental literatures.49–51 More recently a density reduction ranging from 7.4% to 14% was observed.52 The high temperature liquid systems with different densities are allowed to thermalize for 90 000 ⌬t. From the resulting thermalized liquid, the temperature of each system is lowered by schedule of successive cooling and thermalization steps until the amorphous phase at 900 K is obtained. This annealing process is made very slowly scaling the velocity of the atoms by
FIG. 5. (a) Density-density pair distribution function, g共r兲, and (b) charge-charge distribution function, gzz共r兲, as defined in Eqs. (6) and (7) for a-SiC at 300 K.
0.99 every 1000 time steps. That allows the systems to have a long relaxation period of 200 000 ⌬t from the liquid at 3800 K to the final amorphous configuration at 900 K. The system is further cooled to 300 K using the same procedure. Following the conjugated-gradient method the system is then relaxed to the local minimum energy configuration. The energy difference per atom between the crystalline and amorphous structure obtained is found to be ⌬E = 0.32 eV. Finally each system at the local-minimum configuration is heated slowly to 300 K and thermalized by 40 000 ⌬t. Averages were taken over additional 10 000 ⌬t. IV. RESULTS
In this section we analyze the two and three body structural correlations in addition to the rings statistics of the a-SiC samples to describe the short- and intermediate-range topology. Comparison with experiments is done whenever possible. A. Structural correlations
From the phase space trajectory, the two body structural correlations of the amorphous phase are analyzed through
TABLE III. Calculated bond angles and full width at half maxima (FWHM) for cubic crystalline and amorphous SiC at 300 K. Bond Angles for SiC at 300 K Peak position (FWHM) in degrees Crystal Amorphous Si– Si– Si C–C–C Si– Si– C C – C – Si Si– C – Si C – Si– C
60 (2); 90 (2); 120 (3); 180 (2) 60 (2); 90 (2); 120 (3); 180 (2) 35.5 (3); 90 (4); 145 (5) 35.5 (3); 90 (4); 145 (5) 109.47 (5) 109.47 (5)
045207-4
60 (11.5), 114.5 (29) 60 (11); 114.5 (40) 35.5 (9); 90 (30), 141 35.5 (8); 88 (28.5); 140 109 (15) 109 (16)
PHYSICAL REVIEW B 70, 045207 (2004)
SHORT- AND INTERMEDIATE-RANGE STRUCTURAL…
FIG. 6. (a) Density-density and (b) charge-charge correlations. From (a) we can infer that the correlation length for a-SiC is about 12 Å. Charge-charge correlation length is much larger than density correlation length.
pair correlations functions and coordination numbers, calculated from 具n␣共r兲典⌬r = 4r2⌬rcg␣共r兲 and N␣共R兲 = 4c
冕
共4兲
R
r2g␣ 共r兲dr,
共5兲
0
where 具n␣共r兲典⌬r is the number of atoms of species  in a shell between r and r + ⌬r around an atom of species ␣. The brackets represent the average in the ensemble and over all the atoms of species ␣. is the total number density and c the concentration of species  . N␣共R兲 gives the number of atoms of species  around an ␣ atom in a sphere of radius R. Figure 2 displays the partial pair distribution functions at 300 K for C-SiC and a-SiC (sample with 10% density reduction). Figure 3 shows the partial functions for the same a-SiC sample as well as the coordination numbers. The position of the first peak in gSi–C共r兲 gives the bond length Si– C to be 1.89 Å that is the same bond length in the zinc-blend structure. The corresponding coordination number (number of atoms within a 2.4 Å radius) is found to be 3.79 while for crystal it is 4. These results agree well with x-ray scattering21 and EXAFS data.19,22 Table II compares MD and EXAFS results on bond length and coordination number.19,22 It is worth noting that the coordination number 3.79 for the a-SiC is obtained using a cutoff radius of 2.4 Å, which corresponds to the minimum of the gSi–C共r兲 function in Fig. 3(b). As the first and second Si– C shells overlap because of the amorphous disorder the coordination number is a continuous increasing function of distance. However, we do not observe any wrong bonds (Si– Si,C – C). In Table II our results and experimental values are shown. The small difference in bond length and coordination number between them is probably due to the presence of small scale voids in the experimental sample that are absent in our model, which explains the coordination number virtually identical to the crystal with the bond length slightly smaller for an amorphous density 90% of the crystal density.
FIG. 7. (a) Static structure factor and (b) charge structure factor, as defined in Eqs. (9) and (10) for a-SiC at 300 K.
Figure 3 also shows the homonuclear correlations. The first peak in gC–C共r兲 occurs at 3.08 Å with the presence of a small shoulder around 2.50 Å. The absence of pairs for distances smaller than 2.1 Å indicates that graphite or diamond structures, whose nearest-neighbor distances are 1.43 and 1.55 Å, respectively, have insignificant presence. The shoulder at 2.5 Å in gC–C共r兲 corresponds to the nextneighbor distance in diamond and corresponds to carbon bonded to a like atom, C – C – C configuration, and the main peak at 3.08 Å corresponds to C – Si– C configurations. The Si– Si pair correlation function is slightly different from that of C – C. There are no atomic pairs below 2.5 Å, which means that there are insignificant diamondlike homonuclear bonds. The first peak occurs at 3.08 Å, as in the crystalline phase. The coordination numbers NSi–Si and NC–C calculated up to the first minima are slightly different: 11.5 for Si– Si and 11.3 for C – C, less than the crystalline value, 12. These results suggest a highly ordered a-SiC structure and agree well with x-ray photoemission,16 electron diffraction,18 x-ray scattering,21 and EXAFS19,22 studies. The three-body correlations were analyzed in terms of bond-angle distributions. In Fig. 4 the bond angles for
045207-5
FIG. 8. Partial static structure factors for a-SiC at 300 K.
PHYSICAL REVIEW B 70, 045207 (2004)
JOSÉ P. RINO et al.
TABLE IV. Distribution of n-fold rings for crystalline and amorphous SiC at two densities at 300 K. Distribution of n-fold rings in: 2
3
4
5
6
Crystal 共3C兲 SiC 共p = 3.2175 g / cm3兲
One edge sharing More than one edge sharing No edge sharing Total
0 0 0 0
0 0 6 6
0 0 0 0
0 0 0 0
0 0 0 0
Amorphous SiC 共 = 3.057 g / cm3兲
One edge sharing More than one edge sharing No edge sharing Total
0.173 0.071 0 0.244
1.103 0.177 2.25 3.53
0.572 0.164 0.60 1.336
0.006 0 0.032 0.038
0 0 0 0
Amorphous SiC 共 = 2.896 g / cm3兲
One edge sharing More than one edge sharing No edge sharing Total
0.166 0.076 0 0.242
0.987 0.175 2.045 3.207
0.533 0.177 0.552 1.262
0.034 0.0007 0.049 0.084
0 0 0 0
a-SiC are shown. The Si– C – Si and C – Si– C, internal tetrahedral angles, are peaked around 109° as in the crystalline phase. This bond angle together with the well-defined first peak in gSi–C共r兲, with coordination close to 4, characterizes a well-defined tetrahedral unit. The small peak at 85° for C – Si– C bond-angle distribution is due to the presence of edge-sharing tetrahedra forming a twofold ring, as we will discuss in Sec. IV C. The connectivity of the elemental tetrahedral units is described in terms of Si– Si– C and Si– C – C bond angles. While the crystalline structure has well-defined angles at 30°, 90°, and 144° characteristic of the zinc-blend arrangement, the amorphous phase displays a broad distribution, but the main peaks remain at 30°, 90°, and 144°. Besides Si– Si– C, C – C – Si bond angles have peaked around the same angles as observed in the crystal, the 90° angle in Si– Si– Si and C – C – C bond angles disappear in the amorphous phase. Table III summarizes the bond angles and the full width at half maxima calculated for a-SiC with a density 10% smaller than the crystalline sample at 300 K.
B. Density and charge correlations
The total density-density pair-distribution function g共r兲 is defined as g共r兲 =
c␣cg␣共r兲, 兺 ␣,
共6兲
and the corresponding charge-charge pair-distribution function is defined as
gZZ共r兲 =
Z␣Zc␣cg␣共r兲 兺 ␣,
兺␣ Z␣2 c␣
.
共7兲
These functions are shown in Fig. 5. The first peak in those correlations is only due to Si– C correlations while the second peak comes from all three (Si– C, Si– Si, and C – C) correlations. After the second peak, density-density and charge-charge correlations are out of phase. Note that charge-charge correlations are much more
FIG. 9. (Color) (a) Distribution of distances for twofold rings in a-SiC at 300 K. (b) Graphical representation of a twofold ring from our MD simulation.
045207-6
PHYSICAL REVIEW B 70, 045207 (2004)
SHORT- AND INTERMEDIATE-RANGE STRUCTURAL…
long ranged than density-density correlations. In order to highlight the long-range behavior, we show in Fig. 6(a) r2关g共r兲 − 1兴 and in Fig. 6(b) r2gZZ共r兲. As expected, chargecharge correlation is very long range while density-density correlation extends only up to 12 Å, i.e., at this distance the system has almost uniform density. The partial static structure factors are calculated from the Fourier transform of the corresponding partial pair distribution functions: S␣共q兲 = ␦␣ + 4共c␣c兲1/2
冕
⬁
关g␣共r兲 − 1兴
0
sin共qr兲 2 r dr. qr 共8兲
The total density-density structure factor and the chargecharge structure factor are defined, respectively, as S共q兲 =
共c␣c兲1/2S␣共q兲 兺 ␣,
共9兲
and
SZZ共q兲 =
Z␣Z共c␣c兲 兺 ␣,
1/2
Z2ac␣ 兺 ␣,
S␣共q兲 .
共10兲
Figure 7 shows the static structure factors for a-SiC at 300 K. Note that the first sharp diffraction peak at 2.5 Å−1 appears in both structural correlations. From the partial static structure factors, shown in Fig. 8, we can infer the origin of each peak in the diffraction function. All three correlations contribute to the first sharp diffraction peak. C. Rings analyses for the a-SiC topology
The topology and connectivity of the tetrahedral SiC units are analyzed further through shortest-path ring statistics. The rings analysis has been successfully used to describe computer generated samples of amorphous53,54 and glassy materials.55 A shortest-path ring is defined as the shortest closed path of alternating Si– C atomic bonds. We search for rings up to size 6, i.e., 6 Si atoms alternately connected to 6 C atoms. We use the same procedure outlined in the work of
FIG. 10. Bond angle distribution for twofold rings in a-SiC at 300 K.
Rino et al.53 Table IV summarizes the rings statistics for the C-SiC zinc-blend and for the two amorphous densities. While in the crystalline phase there are only three-fold rings (consisting of three atoms of Si alternatively connected with three C atoms), in the amorphous phase we find two-, three-, four-, and five-fold rings. The rings are formed by edge and corner sharing tetrahedra. Among the tetrahedra forming two-fold rings (edge sharing tetrahedra) a small fraction 共⬃1.2%兲 shares more than one edge. 1. Twofold rings
Twofold rings or edge sharing tetrahedra exist in a small amount 共4.74%兲 in a-SiC. There are only three distances in these rings, as can be seen in Fig. 9(a). Si– C distance still is peaked at 1.89 Å; Si– Si is peaked at 2.76 Å, and C – C at 2.55 Å. This distance 共C – C兲 is the origin of the small shoulder in the partial pair distribution function [Fig. 3(c)]. This will cause a large deformation in the tetrahedra as can be seen in the angles, where the Si– C – Si and C – Si– C angles are peaked around 90° [see Figs. 10(a) and 10(d)]. It is this peak 共C – Si– C兲 in a twofold ring which gives rise to the small peak in the total bond angles shown in Fig. 4. Figure
FIG. 11. (Color) (a) Distribution of distances for threefold rings in a-SiC at 300 K. (b) Graphical representation of a threefold ring from our MD simulation.
045207-7
PHYSICAL REVIEW B 70, 045207 (2004)
JOSÉ P. RINO et al.
FIG. 12. Bond angle distribution for threefold rings in a-SiC at 300 K.
FIG. 14. Bond angle distribution for fourfold rings in a-SiC at 300 K.
9(b) displays a graphical representation of a twofold ring from MD coordinates.
ber of rings. Figure 13(a) shows the distances in fourfold rings and Fig. 14 the angles distribution in this ring size. A large distortion is observed in the tetrahedra belonging to this ring size. Besides the Si– C – Si and C – Si– C angles being peaked at 109° a strong anisotropy is observed contrary to the same angle present in the threefold rings. C – C – C displays two main peaks at 60° and 90° that can be understood as a chairlike structure as shown in Fig. 13(b).
2. Threefold rings
Threefold rings are the most common rings, accounting for 68.57% of the total rings present in a-SiC. There is basically one Si– Si and C – C distance in the threefold ring [see Fig. 11(a)]. While in the twofold ring these distances are different, in the threefold rings they are the same. Consequently less distortion is observed in the tetrahedra and the distribution of angles in threefold rings is much more symmetric, as shown in Fig. 12. 3. Fourfold rings
Fourfold rings are the second most common size of rings in amorphous SiC, accounting for 25.95% of the total num-
4. Fivefold rings
Very few (only 0.74%) fivefold rings were found in a-SiC. The distances observed in this ring size are plotted in Fig. 15(a) and the angles distribution is shown in Fig. 16. In this ring size Si– C – Si and C – Si– C angles are peaked at 109°, but are still very asymmetric, indicating that these larger rings consist of distorted tetrahedra.
FIG. 13. (Color) (a) Distribution of distances for fourfold rings in a-SiC at 300 K. (b) Graphical representation of a fourfold ring from our MD simulation.
045207-8
PHYSICAL REVIEW B 70, 045207 (2004)
SHORT- AND INTERMEDIATE-RANGE STRUCTURAL…
FIG. 15. (Color) (a) Distribution of distances for fivefold rings in a-SiC at 300 K. (b) Graphical representation of a fivefold ring from our MD simulation.
The existence of large ring size can explain the fact that a-SiC has lower density in spite of having almost the same coordination number as c-SiC. Larger rings create nanovoids in the a-SiC structure which decreases the density with insignificant changes in coordinations and nearest-neighbor distances. 5. Planar rings
We search for the presence of any planar ring in the system. The relation between the connectivity angle C – Si– C, and , the internal tetrahedral angle Si– C – Si, for a n-fold planar ring is given by53
冉 冊
= n共兲 = 360 1 −
1 − . n
In Table V we display the bond angle in n-fold rings. The angle Si– C – Si, n共0兲°, given in the third column of Table V is the angle in a regular planar n-fold ring calculated from Eq. (11) with C – Si– C angle fixed and equal to 0 = 109.5°. MD results averaged over n-fold rings of the same size for C – Si– C 共MD兲 are given in column 4. Si– C – Si 共MD兲 computed using Eq. (11) is given in column 5. MD results for Si– C – Si angles as obtained in the simulations are given in column 6. Comparing the results in columns 5 and 6 one concludes that there are no planar n-fold rings. Even the twofold ring consisting of two Si and two C atoms is not planar.
共11兲
V. CONCLUSIONS
We have performed MD simulations of a-SiC using an effective interaction potential that reproduces several structural properties of SiC such as: the lattice parameter; elastic constants; melting temperature; and the structural phase transformation. The well relaxed a-SiC sample, obtained from the liquid phase in a slow annealing, consists of deformed tetrahedra with the presence of edge sharing units. The short-range correlation functions are in good agreement with experimental results and indicate an ordered structure with heteronuclear bonds, Si– C. No phase separation, no graphitic or diamond structures are present in the amorphous sample. Charge-charge correlation length is much longer than density-density correlation length, as expected. No rings containing an odd number of atoms as well as no planar rings TABLE V. Bond angles in n-fold rings. Comparison of bond angles calculated from Eq. (11) and results obtained from MD simulation.
FIG. 16. Bond angle distribution for fivefold rings in a-SiC at 300 K.
N
0°
2 3 4 5
109.5 109.5 109.5 109.5
045207-9
Planar vs nonplanar rings n共0兲° MD° n共MD兲° 70.5 130.5 160.5 178.5
83 109.02 110 111.06
97 130.98 160 176.94
MD° 92.7 109.31 110.5 110.66
PHYSICAL REVIEW B 70, 045207 (2004)
JOSÉ P. RINO et al.
were found. The existence of a larger ring size indicates the presence of nano-voids in the amorphous phase, which explains the low density material in addition to almost the same coordination number and bond distance as in the crystalline material. In particular our slow annealing procedure agrees very well with the experimental procedure33,34 and creates a model that supports the description of the relaxed a-SiC system as a highly ordered structure composed by heteronuclear bonds. This description is also supported by several other experimental studies.16–19,21,22,33,34 We described the local structure of the proposed model by calculating the short-
1 D.
Emin, T. L. Aselage, C. Wood, and Materials Research Society, Novel Refractory Semiconductors: Symposium held April 21–23, 1987, Anaheim, California (Materials Research Society, Pittsburgh, PA, 1987). 2 M. E. Levinshteæin, S. L. Rumyantsev, and M. Shur, Properties of Advanced Semiconductor Materials: GaN, AlN, InN, BN, SiC, SiGe (Wiley, New York, 2001). 3 R. C. Marshall, J. W. Faust, C. E. Ryan, Air Force Cambridge Research Laboratories (U.S.), and U. o. S. Carolina, Silicon Carbide—1973, Proceedings (University of South Carolina Press, Columbia, 1974). 4 J. R. O’Connor, J. Smiltens, and Air Force Cambridge Research Laboratories (U.S.). Electronics Research Directorate, Silicon Carbide, A High Temperature Semiconductor; Proceedings (Symposium Publications Division, Pergamon Press, Oxford, 1960). 5 A. Pechenik, R. K. Kalia, and P. Vashishta, Computer-Aided Design of High-Temperature Materials (Oxford University Press, New York, 1999). 6 M. F. Thorpe, M. I. Mitkova, and N. A. T. O. S. A. Division, Amorphous Insulators and Semiconductors (Kluwer Academic, Dordrecht, 1997). 7 C. K. Loong, K. Suzuya, D. L. Price, B. C. Sales, and L. A. Boatner, Physica B 241, 890 (1997). 8 D. L. Price and A. J. G. Ellison, J. Non-Cryst. Solids 177, 293 (1994). 9 S. Sampath, C. J. Benmore, K. M. Lantzky, J. Neuefeind, K. Leinenweber, D. L. Price, and J. L. Yarger, Phys. Rev. Lett. 90, 115502 (2003). 10 P. Armand, M. Beno, A. J. G. Ellison, G. S. Knapp, D. L. Price, and M. L. Saboungi, Europhys. Lett. 29, 549 (1995). 11 D. L. Price, M. L. Saboungi, S. Susman, K. J. Volin, and A. C. Wright, J. Phys.: Condens. Matter 3, 9835 (1991). 12 K. Suzuya, D. L. Price, C. K. Loong, and S. W. Martin, J. NonCryst. Solids 234, 650 (1998). 13 D. D. Klug, C. A. Tulk, E. C. Svensson, and C. K. Loong, Phys. Rev. Lett. 83, 2584 (1999). 14 A. I. Kolesnikov, J. C. Li, S. F. Parker, R. S. Eccleston, and C. K. Loong, Phys. Rev. B 59, 3569 (1999). 15 A. I. Kolesnikov, J. C. Li, N. C. Ahmad, C. K. Loong, J. Nipko, D. Yocum, and S. F. Parker, Physica B 263, 650 (1999). 16 Y. Katayama, K. Usami, and T. Shimada, Philos. Mag. B 43, 283 (1981).
range correlations and the intermediate-range structure which is elucidated calculating the rings statistics and bond angles distributions. ACKNOWLEDGMENTS
This work was supported by NSF, DOE, AFRL, ARL, and USC-Berkeley-Princeton, DURINT. Two of us (J.P.R. and P.S.B.) also acknowledge partial support from FAPESP (Fundação de Amparo à Pesquisa do Estado de São Paulo, SP-Brazil) and CNPq (Conselho Nacional de Desenvolvimento Científico e Tecnológico – Brazil).
I. Rovira and F. Alvarez, Phys. Rev. B 55, 4426 (1997). Sproul, D. R. McKenzie, and D. J. H. Cockayne, Philos. Mag. B 54, 113 (1986). 19 A. E. Kaloyeros, R. B. Rizk, and J. B. Woodhouse, Phys. Rev. B 38, 13 099 (1988). 20 C. Meneghini, S. Pascarelli, F. Boscherini, S. Mobilio, and F. Evangelisti, J. Non-Cryst. Solids 137, 75 (1991). 21 C. Meneghini, F. Boscherini, F. Evangelisti, and S. Mobilio, Phys. Rev. B 50, 11 535 (1994). 22 S. Pascarelli, F. Boscherini, S. Mobilio, and F. Evangelisti, Phys. Rev. B 45, 1650 (1992). 23 P. C. Kelires, Europhys. Lett. 14, 43 (1991). 24 J. Tersoff, Phys. Rev. B 39, 5566 (1989). 25 P. C. Kelires, Phys. Rev. B 46, 10 048 (1992). 26 P. C. Kelires and P. J. H. Denteneer, Solid State Commun. 87, 851 (1993). 27 P. C. Kelires and P. J. H. Denteneer, J. Non-Cryst. Solids 231, 200 (1998). 28 F. Finocchi, G. Galli, M. Parrinello, and C. M. Bertoni, Phys. Rev. Lett. 68, 3044 (1992). 29 R. Car and M. Parrinello, Phys. Rev. Lett. 55, 2471 (1985). 30 J. Tersoff, Phys. Rev. B 49, 16 349 (1994). 31 D. Mura, L. Colombo, R. Bertoncini, and G. Mula, Phys. Rev. B 58, 10 357 (1998). 32 V. I. Ivashchenko, P. E. A. Turchi, V. I. Shevchenko, L. A. Ivashchenko, and G. V. Rusakov, Phys. Rev. B 66, 195201 (2002). 33 J. Seekamp and W. Bauhofer, J. Non-Cryst. Solids 230, 474 (1998). 34 M. Ishimaru, I. T. Bae, Y. Hirotsu, S. Matsumura, and K. E. Sickafus, Phys. Rev. Lett. 89, 055502 (2002). 35 F. Shimojo, I. Ebbsjo, R. K. Kalia, A. Nakano, J. P. Rino, and P. Vashishta, Phys. Rev. Lett. 84, 3338 (2000). 36 M. Catti, Phys. Rev. Lett. 87, 035504 (2001). 37 M. Catti, Phys. Rev. B 65, 224115 (2002). 38 G. R. Fisher and P. Barnes, Philos. Mag. B 61, 217 (1990). 39 M. W. Chase, C. A. Davies, J. R. Downey, D. J. Frurip, R. A. Mcdonald, and A. N. Syverud, J. Phys. Chem. Ref. Data 14, 1 (1985). 40 M. Yoshida, A. Onodera, M. Ueno, K. Takemura, and O. Shimomura, Phys. Rev. B 48, 10587 (1993). 41 T. Sekine and T. Kobayashi, Phys. Rev. B 55, 8034 (1997). 42 J. P. Perdew, K. Burke, and M. Ernzerhof, Phys. Rev. Lett. 77, 3865 (1996). 17 P.
18 A.
045207-10
PHYSICAL REVIEW B 70, 045207 (2004)
SHORT- AND INTERMEDIATE-RANGE STRUCTURAL… 43 F.
Shimojo, R. K. Kalia, A. Nakano, and P. Vashishta, Comput. Phys. Commun. 140, 303 (2001). 44 P. Hohenberg and W. Kohn, Phys. Rev. 136, B864 (1964). 45 M. L. Cohen, Science 261, 307 (1993). 46 D. Vanderbilt, Phys. Rev. B 41, 7892 (1990). 47 G. Kresse and J. Hafner, Phys. Rev. B 49, 14251 (1994). 48 M. Tuckerman, B. J. Berne, and G. J. Martyna, J. Chem. Phys. 97, 1990 (1992). 49 J. M. Williams, C. J. McHargue, and B. R. Appleton, Nucl. Instrum. Methods Phys. Res. 209, 317 (1983). 50 T. Hioki, A. Itoh, M. Ohkubo, S. Noda, H. Doi, J. Kawamoto, and
O. Kamigaito, J. Mater. Sci. 21, 1321 (1986). Heera, J. Stoemenos, R. Kogler, and W. Skorupa, J. Appl. Phys. 77, 2999 (1995). 52 V. Heera, F. Prokert, N. Schell, H. Seifarth, W. Fukarek, M. Voelskow, and W. Skorupa, Appl. Phys. Lett. 70, 3531 (1997). 53 J. P. Rino, I. Ebbsjo, R. K. Kalia, A. Nakano, and P. Vashishta, Phys. Rev. B 47, 3053 (1993). 54 I. Ebbsjo, R. K. Kalia, A. Nakano, J. P. Rino, and P. Vashishta, J. Appl. Phys. 87, 7708 (2000). 55 H. Iyetomi, P. Vashishta, and R. K. Kalia, J. Non-Cryst. Solids 262, 135 (2000). 51 V.
045207-11