May 8, 2002 - arXiv:cond-mat/0203278v2 [cond-mat.stat-mech] 8 May 2002 ... probability distribution function (pdf) of the distances may take various forms.
Shortest paths and load scaling in scale-free trees G´ abor Szab´ o,1, 2 Mikko Alava,1 and J´anos Kert´esz2
arXiv:cond-mat/0203278v2 [cond-mat.stat-mech] 8 May 2002
1
Helsinki University of Technology, Laboratory of Physics, P.O.Box 1100, FIN-02015 HUT, Finland 2 Budapest University of Technology, Department of Theoretical Physics, H-1111 Hungary (Dated: February 1, 2008) The average node-to-node distance of scale-free graphs depends logarithmically on N , the number of nodes, while the probability distribution function (pdf) of the distances may take various forms. Here we analyze these by considering mean-field arguments and by mapping the m = 1 case of the Barab´ asi-Albert model into a tree with a depth-dependent branching ratio. This shows the origins of the average distance scaling and allows a demonstration of why the distribution approaches a Gaussian in the limit of N large. The load, the number of shortest distance paths passing through any node, is discussed in the tree presentation. PACS numbers: 89.75.-k, 89.70.+c, 87.23.Ge, 05.70.Ln
I.
INTRODUCTION
Recently, many examples have been found of systems whose innate topology is not homogenous and can rather be described in terms of a scale-free, random structure. Examples range from the Internet to cellular metabolism networks. The interest of the physics community in this field stems from the fact that the behavior of many systems on such networks or graphs changes drastically and often attains characteristics close-to but not quite like the mean-field limit. A scale-free graph consists of a set of nodes or vertices V and bonds or edges E connecting the vertices to a structure. The essential measure of the scales or lack thereof is the connectivity or degree distribution of the nodes V : the probability of any node to have k edges (one may distinguish between directed and undirected graphs; in the former case the in-going and out-going pdf’s can differ). If this probability Pk follows a powerlaw behavior, a structure arises that does not have any intrinsic scale. The Internet is an example of such a Pk ∼ k −γ , and several models have been designed that fit the same description. Later on enhanced models have been devised to capture the characteristics of more elaborate phenomena, like the tendency of clustering [1, 2, 3, 4]. The models lead to evolving graphs which grow continuously in time by the addition of new nodes, with only a limited number of notable exceptions where the scalefree graph is generated by means of a Monte-Carlo algorithm [5]. The degree distribution Pk and average connectivity become stationary in the thermodynamic limit, save for the tail of the distribution which is subject to finite-size cutoff effects [6, 7]. A practically minded question in the same spirit is the growth mechanism of the Internet [8]. It is a common feature of growing networks that they spontaneously develop degree-degree correlations between adjacent nodes [9, 10]. This is a manifestation of the preferential attachment [11] principle, where more connected nodes are to attract a larger proportion of new links as the network grows. One recent study hints
that the correlation between neighboring node connectivities is the mechanism behind the logarithmic scaling of the network diameter or the average shortest distance between two randomly chosen vertices, with respect to the system size [12]. The support for the argument is empirical evidence from simulation results of a broader class of scale-free graph ensembles, where a power law growth of the diameter has been indeed identified. The question of viability of logarithmic scaling in real-world networks is particularly essential, since it has an impact on efficiency and percolation issues (communication over the Internet, spreading phenomena [13, 14], community structures [15, 16]). Until recently, less attention has been paid to the probability distribution of shortest path lengths or sometimes referred to as chemical distances in scale-free graphs, possibly owing to the fact that it has been implicitly assumed that the average diameter is an adequate measure of distance properties in the networks. The particular form of the distribution function may have bearings on the performance of search algorithms in scale-free graphs [17]. On the other hand, the distribution of shortest paths has been analytically calculated for the small-world model, employing the underlying lattice structure [18] and arriving at a Gaussian-like distribution for large system sizes. Likewise, a model for deterministic scale-free graphs has been proposed and analyzed lately [19], where a Gaussian is again obtained in the asymptotic limit. In this paper we focus on a subset of scale-free graphs described by the Barab´ asi-Albert model [11] that in addition are loopless rooted trees from a topological point of view, i.e. the m = 1 case where one connects new nodes by only one link to the existing structure. By removing the redundancy of interconnecting loops it is possible to consider the distance properties on a mean-field level, and also to analyze “load” or “betweenness” [20, 21], the number of any shortest paths passing through vertices. The essential fact here is that the hub of the tree, e.g. the node with the highest connectivity for simplicity, transmits connections between all the branches emanating from it. We show that a stochastic branching process rooted in the preferential attachment rule gives rise to
2 the logarithmic scaling of the diameter and that the pdf of the minimal paths approaches a Gaussian. Since throughout this text we are interested in tree structures, it is useful to overview their basic features. In the context of random networks, one often resorts to Ref. [22] and the derivation therein, which suggests that the diameter of graphs grows logarithmically. Although the calculations there are performed for random graphs containing loops, the result obtained closely resembles that for balanced Cayley trees with uniform coordination numbers (except for the coordination number of the central node, which is different). According to this, the number of nodes separated from node zero by k nonrecurring steps goes as z k where z is the coordination number for the Cayley tree. It then follows simply from the sum of a geometric series that both the longest distance between nodes and the average distance should behave as ¯l ∼ ln N . It is obvious that trees have unique shortest paths between any two nodes in the sense that without traversing the same edge twice it is not possible to find an alternate minimal route (unlike in unweighted graphs with loops, where there is usually more than one minimal path). We can then define one of the nodes as the root of the tree and unambiguously arrange all the other nodes into layers depending on their minimal distance to the root. Finding the shortest path between two chosen nodes is nothing but identifying the deepest common node along the paths leading from the root to the source and target vertices and then connecting the two nodes via this common fork. Notice that the choice of the root here is slightly arbitrary; one would prefer to use balanced trees. We study scale-free Barab´ asi-Albert trees [11], starting with a single vertex. In each time step then we add a new vertex with only one outgoing edge. The other end of the edge is connected to one of the nodes already present in the system with a connection probability proportional to the connectivity or degree of a particular node. All edges are thought of as bidirectional and having the same weight, namely 1. As a slight modification to the original model, the connection symmetry of the first two nodes is broken by introducing a “virtual” edge to the very first vertex which only gives preference for this node over the second one when it comes to the subsequent addition of further nodes. This way, we can automatically identify the most connected node in the network and call it its root. To have a balanced tree one needs every subtree of the root to have the same number of nodes in the configurational average. This is only attained when the root is the most connected node, since the BA model ensures that the order of the nodes in terms of connectivity does not change in the course of addition of new nodes and is fully determined by the time of introduction of a node.
II.
MEAN-FIELD APPROACH
To begin with, we will investigate the shortest path distribution in a mean-field model of a tree network, between the root of the tree and all the other nodes. This argument extends also to general graphs in the case that the new nodes added (e.g. m > 1 Barab´ asi-Albert networks) do not cause a significant amount of shortcuts between already existing nodes. Let us consider a uniform branching process for each of the layers in the tree so that every node on a certain layer has the same number of offsprings to produce the next layer beneath; it shall amount to b(l) for layer l for short. This way the original stochastic model is approximated by a deterministic graph [19, 23]. The number of nodes n(l) with a separation l from the root is then n(l) = n(l − 1) b(l − 1) with the condition that n(0) = 1. The actual form of b(l) can be obtained by making use of the preferential attachment rule for BA networks. According to this, the probability that a newly introduced node will connect to any given set of nodes is proportional to the cumulative connectivity of the set in question. Thus, the number of nodes on layer l + 1 changes according to the following rate equation, due to the addition of a new node: ∂n(l + 1) 1 = (b(l) + 1) n(l), ∂N 2N
(1)
since the right hand side describes the attachment probability to layer l, where N is the number of nodes in the system and 2N is the normalization factor for the connectivity. Writing n(l + 1) = n(l) b(l), expanding the derivation, and dividing by n(l) b(l) give � � 1 ∂b(l) 1 1 1 . (2) = − b(l) ∂N 2N b(l) b(l − 1) If we substitute B(N, l) = 1/b(l) by explicitly indicating the size dependence on N and assume that B(N, l) is a slowly varying function, −
∂ ln B(N, l) 1 ∂B(N, l) ≈ . ∂N 2N ∂l
(3)
It is straightforward to expect a solution in the decomposed form of B(N, l) = Bl (l)/BN (N ): ∂ ln BN (N ) 1 ∂Bl (l) 1 ≈ , ∂N 2N BN (N ) ∂l
(4)
and since the left hand side is a function of only N , Bl (l) = 2αl with a constant α. Finally, we get BN (N ) = α ln N and b(l) =
1 ln N . 2 l
(5)
This relation does not apply to the root (l = 0) for obvious reasons. Eq. (5) also implies that the number of nodes with a given distance to the root n(l) keeps growing
3 with l until b(l) drops below 1 and then starts to decrease, as the bottom of the tree is approached (n ≪ 1). This is in strong contrast to the formal prediction of a constant branching for any random graph [22], which would result in a monotonous exponential growth, as would be the case in usual Cayley trees.
140
10
130
10
f
−1
DISTANCE SCALING e
III.
10
120
10
−2
10
110
Using the recursion relation n(l) = n(l − 1) b(l − 1) for the number of nodes on a given level, we can give an estimate for the shortest path distribution function with the source of the paths at the root of the tree. Instead of Eq. (5) we take now the more general form of b(l) = (A/l)λ and approximate the sum with an integral in the following expression, which reads # " l−1 l−1 X Y b(i) ≈ b(i) = b(0) exp ln n(l) = n(0) i=1
i=0
λ(l−1)
≈ b(0)A b(0) = λ e
�
exp −λ
Ae l−1
�λ(l−1)
Z
1
l−1
!
ln x dx
.
= (6)
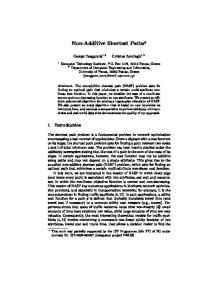
The result above for n(l) approaches a non-normalized Gaussian in the large-N limit as A ∼ ln N goes to infinity, which can be seen from Fig. 1 where a C corresponding to a very large network has been used. In order to draw further conclusions, we will determine the parameters of the Gaussian that give a best fit to n(l). For the sake of simplicity, let us now consider the function of the form f (x) = (C/x)λx : f (x) =
�
C x
�λx
� (x − µ)2 . ≈ R exp − 2σ 2 �
(7)
We first match the extremal point of f to the mean of the Gaussian, resulting in µ = C/e. The maximum value is thus R = exp(Cλ/e); the standard deviation σ can be obtained by the requirement that the derivative functions of f and the Gaussian bep the same in the vicinity of µ up to first order, giving σ = C/(λe). Using the parameters acquired this way, we can find a very good approximation to f (x), which is almost identical to that of a least-square fit. Furthermore, additional information can be gained if we look into the normalization conditions for n(l). Trivially, the sum of n(l) over all layers should return the total number of nodes in the system, N . Again, we approximate the sum with an integral: Z ∞ Z � �λx ∞ X b(0) ∞ Ae dx ≈ N = n(l) ≈ n(x)dx = λ e x 1 0 l=1 � � Z b(0) ∞ Aλ (x − A)2 ≈ dx ≈ e exp − eλ 0 2A/λ
10
−3
10
1
2
10
200
10
C
100
10
3
10
250
300
350
400
450
500
x FIG. 1: A Gaussian fit for the function f (x) = (C/x)x with C = 300 e. A few points of the Gaussian are represented by the dots. The difference is only noticeable at the tails of the functions. The inset shows how the quadratic error of the two functions (normalized for area) appears to be a decreasing power law with increasing C.
b(0) Aλ ≈ e eλ
r
2πA , λ
(8)
where we assumed that A is large enough so that we can neglect the correction of the error function to the Gaussian integral. We should also be aware that l has a finite cutoff because of the bounded depth of the tree— yet, the quickly vanishing n(l) makes it possible to take l to infinity. Finally, f (x) → 1 as x → 0 so that the integrand is bounded everywhere. Recall now that the degree of a node in BA networks grows with the power of N , b(0) ∼ N β [9]. Apart from b(0), the only term on the right hand side of Eq. (8) that Aλ may contribute to the overall linear √ growth in N is e , which increases much faster than A, so the latter can be taken a constant. The consistency condition with the left hand side requires that eAλ ∼ N 1−β should hold, and thus A=
1−β ln N + const. λ
(9)
Disregarding the constant, we end up with a very similar but more general expression than that of Eq. (5) for b(l): �λ � υ ln N , with β + υλ = 1. (10) b(l) = l This implies that if a scale-free tree is characterized by a branching process decaying as a power law as a function of the distance from a suitable root node with the highest connectivity, the relation (10) should necessarily be satisfied. Not surprisingly, it is true in the case of BA trees, where β = 1/2 and according to Eq. (5), υ = 1/2 and λ = 1. One should note that in the process
4
n(s) (l) =
l−1 Y
b(s + i).
(11)
i=0
Let now r(s) (l) be the number of all routes that go through or end at a particular node on level s and have a length of l,
0
10
−1
10
−2
10
b / ln N
2
10
−3
10
0
10
−4
b
of constructing the mapping we rely on the fact that the number of nodes in a layer depends only on the average branching ratio b(l); the fluctuations in the degrees of nodes is omitted. For this reason the degree distribution exponent −3 is not present in the tree representation. The node-to-node distances in the mean-field model are calculated as follows. We traverse each node of the tree and enumerate the routes with certain lengths that start at or go through this node and have both of their ends in the subtree of the node. Practically speaking, we can think of this node as the root for its subtree and perform the same calculations as we would do for the ’global root’ of the tree. If we by n(s) (l) denote the number of possible paths going out to the subtree of a node on level s that have length l and one end fixed at the node on level s,
10
−2
10
−4
10
−5
10
−6
10 −2 10
−1
0
10
10
1
10
l / ln N −6
10
0
10
1
10
2
10
l
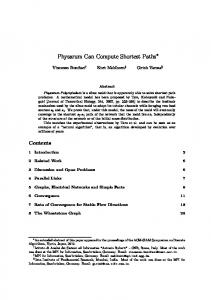
FIG. 2: The average number of branches per node normalized with the logarithm of the system size, represented versus the minimal distance of the nodes from the root with maximum connectivity for the BA model. A power-law fit has been performed in a window indicated by the heavy line, giving b(l)/ ln N ≃ 0.43 l−0.9995 . The exponent is very close to −1. The inset shows b(l) plotted against the normalized minimal distance. The systems range from 103 to 106 nodes in size with logarithmic increments. The number of iterations for the systems go from 105 to 100, depending on the size, N .
r(s) (l) = = n(s) (l) + Θ(b(s) − 1)
� l−1 � X b(s) n(s) (i) n(s) (l − i) i=1
2
b(s)
b(s)
=
l−1
=n
(s)
b(s) − 1 X (s) (l) + Θ(b(s) − 1) n (i) n(s) (l − i). (12) 2b(s) i=1
The second term in the sum has contribution to r(s) (l) only when there are branches left going out from a node, in average when b(s) ≥ 1. The number of paths with a specific length in the whole system is therefore
r(l) =
L X
r(s) (l) n(s),
(13)
s=0
where n(s) is defined as earlier in Eq. (6), the number of nodes on a given level s. The Barab´ asi-Albert model allows for more rigorous derivations of the relation for n(l). The mathematics community often refers to the tree interpretation of the model as recursive trees, and thus exact results have been obtained for both the distance distribution and the diameter of the trees [24, 25, 26]. Bollob´ as and Riordan give a general proof for the diameter scaling of scale-free BA graphs [27]. The mapping to Cayley trees also resembles the work of Krapivsky and Redner, who arrive at a closed recursive analytical form for n(l), in a more general context than that of scale-free trees [28]. It also resembles Cayley models of Internet traceroutes [29] by Caldarelli and co-workers.
IV.
COMPARISON WITH SIMULATIONS
Numerical simulations of BA scale-free trees fully confirm the inferences drawn in the preceding section. Most important of all, the average number of branches per node on a given level is shown in Fig. 2. The numerical parameters of the power-law fit conform with the mean-field values: the exponent of the decay is almost exactly −1, and the prefactor of the logarithm with 0.43 is also close to that of the predicted 1/2. It is also worth to note that if we rescale the distance variable by the logarithm of the system size, we can attain a data collapse with a very good accuracy. This means that for BA trees in practice b(l) can be approximated as � 0.43 ln N if l . L(N ) l b(l) = (14) ≈0 otherwise From the inset of Fig. 2 it is also apparent that the cutoff L(N ) is a little over the value of ln N , by a factor of about 1.3. On the other hand, the drop of b(l) at L(N ) is measured to be either an exponential or a power-law with a very large exponent. The mean-field prediction for the maximum of the shortest path length, L(N ), can be obtained by equating n(L) = 1 in Eq. (6) and using the Gaussian approximation of Eq. (7).√The solution up to first order in ln N is that L(N ) ≈ 1+2 2 ln N , which again is in reasonable agreement with the mean-field argument. The derived quantities n(l)/N and the node-to-node distance distribution is shown in Fig. 3 for two distinct cases:
5 0.18
1
0.15
/ ln N
P
0.12
0.09
0.75
0.06
0.03
0 0
0.5 5
10
15
20
25
30
35
0
1
2
l
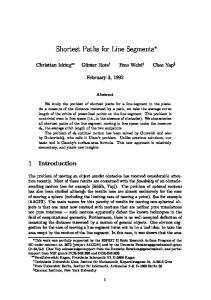
FIG. 3: Root-to-node (left) and node-to-node (right) distance distributions with circles (BA model) and their predicted values with squares. The prediction is based on Eqs. (11)–(13). Trees of 106 nodes are measured and averaged over 100 realizations. The dashed lines show the least-square fits with the function [C/(l − 1)] l−1 to the measured data points. The constant for root-to-node distances is Cr = 15.7 and for nodeto-node distances Cn = 33.2. Cr is in a very good correspondence with the analytical value of Cr = 0.43 e ln N = 16.2 and Cn ≈ 2Cr .
• the root-to-node and node-to-node shortest path distribution is measured in an ensemble of random BA trees using simulations. Instead of every possible pair, the node-to-node distances are measured only between a large but finite number of randomly selected vertex pairs, for practical reasons; • both distribution functions are estimated by utilizing the mean-field tree mapping, using the asymptotic form of Eq. (14) for b(l) with a cutoff at L = 1.2 ln N . It is to be seen that a very good correspondence is found between the root-node distribution functions, but the overall two-point pdf’s are sensibly close as well. While it has been relatively easy to derive analytical results for the root-node distances in the mean-field trees, Eq. (13) and the quantities it is constructed of turn out to be too complex to handle without numerics. The formulas (11)–(13) above are used to calculate the approximate values of the node-to-node path length distribution in the mean-field trees using the expression of Eq. (14) instead of the analytical form of Eq. (5), so as to better represent the random BA trees. It is reassuring that the generic form of the node-to-node distance pdf also follows a (C ′ /x)x function, only with a different C ′ constant from that of C for the root-node distances [Eq. (6)–(7)]; see Fig. 3. The diameter of the trees relative to the logarithm of the system size can be seen on Fig. 4. hli ≈ ln N or in other words twice the mean of root-to-node distances. This is somewhat expected as the main contribution to
3
4
N
5 5
x 10
FIG. 4: The diameter and mean depth of networks of different sizes, divided by the logarithm of their size. Circles represent the mean of node-to-node distances, while squares the mean root-to-node distances. Both are apparently proportional to ln N , and the prefactors of ∼ 0.5 and ∼ 1 are in very good agreement with their respective analytical values.
the node-to-node paths arises from passing through the root, for large graphs. It leads to a convolution-type distribution (from the two ’legs’). It can easily be seen that the diameter cannot exceed twice the depth of the tree, which gives rise to a logarithmic growth in any case.
V.
ON THE “LOAD” ON TREES
On a hierarchical structure the total number of minimum paths going through a node (the “load”) can be divided into two contributions. First, those paths that connect nodes in separate sub-branches of the node to each other, and, second, those that connect the nodes belonging to the branches to the rest of the tree. Call d(l) the number of the descendants of a node on level l. In other words, d(l) is the size of the subtree for the node. Then the load can be written simply as � �� �2 b(l) d(l) Λ(l) = + d(l) × (N − d(l)), 2 b(l)
(15)
where the last term counts the connections towards the hub. For the particular example we are concerned with, it is easy to see that the latter term dominates (N ≫ d(l)) and moreover that a good approximation is given by just simply Λ(l) ≈ d(l) N . Thus one may investigate the dependence of the load on the level (or depth) of the tree, l. For d(l) in the mean-field picture one has that d(l) =
PL
n(i) , n(l)
i=l+1
(16)
6 8
−11
10
10
−6
10
−8
10
7
P
−12
10
10
−10
10
−12
10
5
6
10
7
8
10
10
9
10
10
10
Λ
K
P
10
−13
10
6
10
5
−14
10
−15
10 0 10
10
4
10
10
10
11
12
10
10
13
10
14
10
FIG. 5: Load distribution for mean-field trees modeling BA networks. The probability P is proportional to n, the number of nodes on the levels of the tree. The load on the root has not been showed since it does not average. The inset shows the load distribution for a usual Cayley tree with a coordination number z = 2. The bold lines indicate power law fits, which give exponents of −0.99 and −1 for the BA and the Cayley trees, respectively. The mean-field tree is a mapping of a random BA tree with 1010 nodes.
and for the layer immediately below PL d(l)n(l) − n(l + 1) i=l+2 n(i) d(l + 1) = = = n(l + 1) n(l + 1) d(l) d(l) = −1≈ , (17) b(l) b(l) where we also used the recursion relation for n(l + 1). Finally, the load changes for the layer underneath as Λ(l) d(l) N= . b(l) b(l)
(18)
Since the load Λ(l) is the same for each of the nodes on a particular level l, the distance–load distribution is directly given by the normalized n–Λ function, thus hiding the implicit dependence on l. Considering that Λ(l) b(l) n(l + 1) = n(l) b(l),
Λ(l + 1) =
(19)
Λ(l + 1) n(l + 1) = Λ(l) n(l) = const. and therefore n=
const. . Λ
2
10
3
10
4
10
d
Λ
Λ(l + 1) = d(l + 1) N =
1
10
(20)
We then expect to see that the load is inversely proportional to the number of nodes on the levels, which is indeed the case according to Fig. 5. The same result holds for normal Cayley trees from Eq. (15). Note that we have to use mean-field trees which would correspond to random networks with a large number of
FIG. 6: Betweenness as a function of the descendants for every node in the network. Trees of size 104 are taken with 100 realizations. The root which descendants are defined down from is always the initial node. The prediction of Eq. (21) is represented by the solid line.
nodes so that the number of levels is of the order of 10. For the load distribution we consider only levels for which b(l) ≥ 1 because otherwise subtrees do not exist in the average sense. It is surprising that the load distribution exponent does not depend on the actual form of b(l), being universally −1 [Eq. (19)]. Indeed, the exponent of the distance–load pdf is independent of the choice of the node that all the distances are taken relative to. Another common way of defining the importance of the nodes in terms of shortest paths passing through them is the one called betweenness, favorable for its algorithmic feasibility and simplicity. Newman presents a breadth first search algorithm for efficient calculation of the betweenness of nodes on random graphs [21]. The only notable difference to Eq. (15) comes from the fact that the betweenness also accounts for paths that originate from the nodes themselves, which nevertheless amounts only to a constant system size. We will calculate the betweenness on the trees, now focusing as a goal on the probability distribution of the load. An estimation can be given for a node by considering the contributions to it, and by separating the network to a descendants part with d nodes in the branches and all the rest with N − 1 − d nodes. The node being the source, we have N shortest paths to any other node; if the source is among the descendants, we have d(N −1−d+1) ones going through; if the source is any other node from the network, we have (N − 1 − d)(d + 1). A fourth contribution, coming from paths passing through the node but having both ends in the descendant tree, has been neglected. They add up to an estimated betweenness K of K(d) ≈ 2N − 1 + 2(N − 1)d − 2d2 .
(21)
7 −4
8
10
10 0
10
−5
10
P
7
10
−5
10
−6
10
6
10
P
0
10 −7
2
4
10
10
K
−10
10
6
10
6
10
4
d
10
d
10
2
10
5
10
−8
10
0
10 0 10
−9
10
2
10
4
10
5
10
6
10
7
10
8
10
10 0 10
1
Here it is to be seen that for small d’s the linear term dominates, just as in our previous load calculation; Fig. 6 justifies our estimations. The betweenness probability distribution P (K) taken over all nodes in the network can then be concluded to asymptotically follow a power law decay with a universal exponent of −2. This is since K is linear in the number of descendants d and moreover that the pdf of d scales universally with an exponent of −2 for supercritical trees [30]. Strictly speaking, the conclusions here are only true for the supercritical part of the tree, i.e. where b(l) > 1. The subcritical leaves of the tree have an increasingly smaller number of descendants, though, which drop exponentially with each new layer, and it can be verified that the descendant pdf decay exponent is indeed above 2 if only this part of the tree is considered. Nevertheless, Fig. 7 shows that both the descendant pdf and the load pdf are accurately described by inverse square functions. A scaling of the load distribution has been experimentally found on other scale-free networks as well [20], only with a slightly different universal exponent of about 2.2. A further, practically more far-reaching observation is that the average betweenness as measured as a function of the locally known node degree grows as a power-law of the degree with an exponent of about 1.8 (Fig. 8). A mean-field approach can be used to estimate for the exponent, though, if we consider that the preferential attachment principle for large degrees gives rise to a 1 descendant–degree scaling of d ∼ k β (β = 1/2), which is the inverted relation for the time evolution of the degree of a parent node [9]. In this particular case, time is measured as the size of the node’s subtree. A substitution of the latter into the linear load equation would suggest an exponent of 2; the deviation from it may come from the rather restricted range of the degree that the relatively
2
10
K
FIG. 7: Betweenness pdf for a system of 104 nodes. The exponent of the power law shown is −1.99. The inset displays the logarithmically binned pdf of the descendants for systems with 106 nodes. Its power law exponent is −1.99 as well.
4
10
k
4
10
3
10
k
FIG. 8: Average betweenness for nodes with a particular degree, taken over 100 realizations of networks with 104 nodes. The fit of a power law indicates an exponent of about 1.78. The inset shows the average number of descendants versus the degree for systems with 106 nodes, for which a power-law fit gives d(k) ∼ k1.95 .
small system sizes allow.
VI.
CONCLUSIONS
In this paper we have mapped scale-free Barab´ asiAlbert trees to a deterministic model of a rooted tree with a uniform branching process on each layer of the tree. This idea resembles work on the Internet structure [29] and on the structure of branched cracks, where an inverse relation of the branching to distance has been observed [31]. Simulations show that the distribution of the number of branches on one particular layer of the tree follows a power-law function, but it turns out to be a good approximation to describe the branching only by its mean, b(l). In the simple case of BA trees it can be shown by means of this mapping that the diameter of the networks is bounded by the logarithm of the network size and the asymptotic form of the distance distribution functions follows immediately. In other words, we can examine the slow convergence of this function to the limiting Gaussian form for infinite system sizes. Given an effective description in terms of a tree plus a branching process, further information can be found, e.g. one may consider the scaling of the number of shortest-distance paths (load, or betweenness). Non-uniform critical trees could perhaps be constructed in a self-organized fashion, as is possible for the statistically uniform case [32]. One should note the close relation of the Cayley representation to minimal spanning trees (MST) on scale-free (random) networks; for the m = 1-networks these two coincide. This makes it an interesting prospect to study the load and distance properties of MST’s in other scale-free
8 networks. We thank B´alint T´ oth for useful discussions.
[1] P. Holme and B.J. Kim, cond-mat/0110452. [2] K. Klemm and V.M. Egu´ıluz, Phys. Rev. E 65, 036123 (2002); cond-mat/0107607. [3] S.N. Dorogovtsev and J.F.F. Mendes, Europhys. Lett. 52, 33 (2000). [4] S.N. Dorogovtsev, J.F.F. Mendes, and A.N. Samukhin, cond-mat/0011077. [5] Z. Burda, J.D. Correia, and A. Krzywicki, Phys. Rev. E 64, 046118 (2001). [6] S.N. Dorogovtsev, J.F.F. Mendes, and A.N. Samukhin, cond-mat/0011115; Phys. Rev. E 63, 062101 (2001). [7] S.N. Dorogovtsev and J.F.F. Mendes, Phys. Rev. E 63, 056125 (2001). [8] A. Vazquez, R. Pastor-Satorras, and A. Vespignani, cond-mat/0112400. [9] R. Albert and A.-L. Barab´ asi, cond-mat/0106096; Rev. Mod. Phys. 74, 47 (2002). [10] S.N. Dorogovtsev and J.F.F. Mendes, condmat/0106144. [11] A.-L. Barab´ asi and R. Albert, Science 286, 509 (1999). [12] A. Krzywicki, cond-mat/0110574 (2001). [13] R. Pastor-Satorras and A. Vespignani, Phys. Rev. Lett. 86, 3200 (2001). [14] R. Pastor-Satorras and A. Vespignani, condmat/0202298. [15] M. Girvan and M.E.J. Newman, cond-mat/0112110. [16] R. Albert and A.-L. Barab´ asi, Phys. Rev. Lett. 85, 5234 (2000).
This work has been supported by the Academy of Finland’s Centre of Excellence Programme and by OTKA T029985.
[17] B.J. Kim, C.N. Yoon, S.K. Han, and H. Jeong, condmat/0111232. [18] R.V. Kulkarni, E. Almaas, and D. Stroud, Phys. Rev. E 61, 4268 (2000). [19] S.N. Dorogovtsev, A.V. Goltsev, and A.N. Samukhin, cond-mat/0112143. [20] K.-I. Goh, B. Kahng, and D. Kim, cond-mat/0106565; Phys. Rev. Lett. 87, 278701 (2001). [21] M.E.J. Newman, Phys. Rev. E 64, 016132 (2001). [22] M.E.J. Newman, S.H. Strogatz, and D.J. Watts, Phys. Rev. E 64, 026118 (2001). [23] A.L. Barab´ asi, E. Ravasz, and T. Vicsek, condmat/0107419. [24] B. Pittel, Random Struct. Algorithms 5, 337 (1994). [25] R.P. Dobrow and R.T. Smythe, Random Struct. Algorithms 9, 79 (1996). [26] R.P. Dobrow, J. Appl. Probab. 33, 749 (1996). [27] B. Bollob´ as and O. Riordan, to be published. [28] P.L. Krapivsky and S. Redner, Phys. Rev. E 63, 066123 (2001). [29] G. Caldarelli, R. Marchetti, and L. Pietronero, Europhys. Lett. 52, 386 (2000). [30] P. De Los Rios, Europhys. Lett. 56, 898 (2001). [31] J.P. Bouchaud, E. Bouchaud, G. Lapasset, and J. Plan`es, Phys. Rev. Lett. 71, 2240 (1993). [32] S. Zapperi, K.B. Lauritsen, and H.E. Stanley, Phys. Rev. Lett. 75, 4071 (1995).