repair tools to produce valid repairs of defects. This paper ... At an early stage of running a repair tool, ... If an automated program repair technique is effective, the ...... [36] H. Seo and S. Kim, âPredicting recurring crash stacks,â in Proceedings.
Should Fixing These Failures be Delegated to Automated Program Repair? Xuan-Bach D. Le, Tien-Duy B. Le, and David Lo School of Information Systems Singapore Management University, Singapore {dxb.le.2013,btdle.2012,davidlo}@smu.edu.sg Abstract—Program repair constitutes one of the major components of software maintenance that usually incurs a significant cost in software production. Automated program repair is supposed to help in reducing the software maintenance cost by automatically fixing software defects. Despite the recent advances in automated software repair, it is still very costly to wait for repair tools to produce valid repairs of defects. This paper addresses the following question: “Will an automated program repair technique find a repair for a defect within a reasonable time?”. To answer this question, we build an oracle that can predict whether fixing a failure should be delegated to an automated repair technique. If the repair technique is predicted to take too long to produce a repair, the bug fixing process should rather be assigned to a developer or other appropriate techniques available. Our oracle is built for genetic-programming-based automated program repair approaches, which have recently received considerable attention due to their capability to automatically fix real-world bugs. These approaches search for a valid repair over a large number of variants that are syntactically mutated from the original program. At an early stage of running a repair tool, we extract a number of features that are potentially related to the effectiveness of the tool. Leveraging advances in machine learning, we process the values of these features to learn a discriminative model that is able to predict whether continuing a genetic programming search will lead to a repair within a desired time limit. We perform experiments to evaluate the ability of our approach to predict the effectiveness of GenProg, a wellknown genetic-programming-based automated program repair approach, in fixing 105 real bugs. Our experiments show that our approach can identify effective cases from ineffective ones (i.e., bugs for which GenProg cannot produce correct fixes after a long period of time) with a precision, recall, F-measure, and AUC of 72%, 74%, 73%, and 76% respectively. Keywords—Automated Program Repair, Effectiveness Prediction, Effective Feature Design, Classification Techniques
I.
I NTRODUCTION
In software development, bugs are prevalent. Even software systems which are maintained by large commercial entities and supported by thousands of developers and testers are plagued with hundreds or even thousands of bugs every year. Thus, fixing bugs is a crucial task to maintain software quality. Bug fixing is known to be difficult, time-consuming, and requires much manual effort. U.S. National Institute of Standards and Technology reported that software bugs were estimated to cost U.S. economy more than 50 billion dollars each year [39]. Therefore, there is a need to develop automated techniques that can help developers in the task of fixing bugs.
Recently, automated program repair is a new research direction that attracts attention in the software engineering research community. The purpose of automated program repair is to reduce the cost of manual labor by automatically generating patches for faulty programs. Several automated program repair techniques have been proposed [14], [23], [24], [30]. One promising family of automated repair techniques is search-based automated program repair (SAPR) which searches through a large set of repair candidates to find a suitable repair for a bug. GenProg is a well-known SAPR technique that employs genetic programming to guide repair candidate generation process. To generate a patch for a faulty program, GenProg first identifies a set of suspicious program locations that are likely to contain the bug. It then works in multiple iterations. In each iteration, it creates a population of repair candidates (aka. a generation of repair candidates) by modifying one or more statements in one of the suspicious program locations. Once repair candidates are generated, GenProg estimates fitness values of the candidates by executing them against a set of test cases. Fitness values are used to guide the process of generating repair candidates in the subsequent iterations. GenProg repeats the iteration until a valid program repair, which passes all test cases, is found or a time limit or maximum number of iterations is reached. If an automated program repair technique is effective, the technique should successfully repair input faulty programs with reasonable repair cost, measured in terms of computation time. Computation time is important since past studies showed that waiting time impacts usability of software [29]. It is interesting to note that the cost incurred by an SAPR technique to find successful repairs varies for different bugs and different programs [23]. Some bugs can automatically be fixed in seconds, while many others cannot be fixed in hours or even half a day. Developers will waste much time and resources if they need to wait for many hours and at the end, an SAPR technique cannot produce a correct repair. In this work, we aim to develop a technique that can help make automated program repair more practical for developers. Our technique will predict whether an SAPR technique can produce a correct fix given a time budget in the first few seconds after it is run. For bugs that an SAPR technique cannot fix in a reasonable amount of time, developers are better off to switch to traditional approaches (e.g., manual debugging) instead of waiting for the SAPR technique. In this work, we refer to repair instances for which an SAPR technique can produce correct fixes within a time budget as effective instances, and those that cannot produce correct fixes
within the time budget as ineffective instances. Our goal is to build an oracle that can differentiate effective from ineffective instances. To predict the effectiveness of a repair instance (i.e., an application of a SAPR technique on a bug), our approach extracts important features from the instance. The features are extracted a few seconds after the SAPR technique is run. They capture general characteristics of the faulty program and set of test cases, number and locality of program locations that are suspected by an SAPR technique to be buggy, and characteristics of the initial population of candidate fixes that is generated by the SAPR technique. The features are chosen based on a number of hypotheses, which include the following three: First, the size of the faulty program and the number of test cases are likely to determine the cost of checking the correctness and fitness score of a variant; Second, the number and locality of suspicious program locations are likely to determine the difficulty of the bug fixing process; Third, the diversity of the candidate fixes generated in the initial population impacts the likelihood of the SAPR technique to be successful in fixing the bug. Note that an SAPR technique can identify suspicious program locations, which are potentially buggy locations, and generate an initial population of candidate fixes in a short amount of time (i.e., a few seconds). After these features are extracted from a set of training data (i.e., historical bugs that are fixed by an SAPR technique), we build a discriminative model (i.e., a classifier) that can differentiate between effective and ineffective repair instances. We use the random forest classification algorithm to learn this model. This model is then used as an oracle to determine if future repair instances will be effective or not. We evaluate our approach on GenProg, a well-known SAPR technique [24]. In particular, we apply our approach to predict the effectiveness of GenProg when it is applied to a dataset containing 105 defects which were used to evaluate the effectiveness of GenProg. Our evaluation results show that our approach can achieve a precision, recall, F-measure, and AUC of 72%, 74%, 73%, and 76%, respectively. We also compare our approach with a baseline model which randomly predicts if a repair instance is effective or not (random model), and another baseline model that predicts all repair instances as effective (all-effective model). We find that our approach can outperforms the best performing baseline model (i.e., alleffective model) in terms of F-measure and AUC by 9% and 52%, respectively. The contributions of our work are as follows: 1) We propose a new research problem to make SAPR techniques more practical to developers by predicting repair instances for which these techniques are ineffective. A repair instance is deemed to be ineffective if a SAPR technique is unable to produce a successful repair patch after a long period of time. For such instances, developers are better off to switch to traditional approaches to fix the bug. 2) We propose a list of features extracted from the faulty program, test cases, locality of suspicious program points, and initial population of repair candidates that are generated by an SAPR technique after a few seconds of its operation. The extracted features are then input to a
machine learning algorithm to construct a discriminative model for predicting the effectiveness of repair instances. 3) We evaluate our approach to predict the effectiveness of a well-known SAPR technique (i.e., GenProg) on a dataset containing 105 real defects. The empirical results show that our approach can achieve a precision, recall, F-measure, and AUC of 72%, 74%, 73%, and 76% respectively. The structure of the remainder of the paper is as follows. Section II highlights background material on search-based program repair and the random forest classification algorithm. In Section III, we describe the overall framework of our approach. Section IV presents a list of features that our approach extracts to predict the effectiveness of an SAPR technique given a repair instance. Next, in Section V, we present the settings and results of our experiments which evaluate our proposed approach. Section VI describes some threats to the validity of our study. We highlight related work in Section VII. Finally, we conclude the paper and mention future work in Section VIII. II.
BACKGROUND
In this section, we highlight background materials on search-based automated program repair (SAPR) and random forest classification algorithm. A. Search-Based Automated Program Repair In the literature, a number of automated program repair tools have been proposed to help developers fix faulty programs automatically [30], [23], [24], [14]. Among these tools, GenProg is one of the popular ones. By leveraging genetic programming [16], GenProg demonstrates its capability in repairing real-world bugs [23]. GenProg uses genetic programming to guide the search for a valid repair of a buggy program. GenProg takes as input a buggy program along with a set of test cases. Each test case specifies a test input and an expected output. With this input, the repair process goes through two main phases: bug localization and valid patch finding. At the first phase, the input program is compiled and runs against the test cases to identify suspicious statements that may cause the program to fail. These suspicious statements then form suspicious areas which are targets for the second phase which generate repair candidates. In the second phase, GenProg applies genetic programming to generate a large number of repair candidates and search for a valid repair amongst the generated candidates. GenProg first uses mutation operators in genetic programming to syntactically modify the original program in the suspicious areas to create an initial population that contains a large number of mutants (i.e., repair candidates). The mutation operators used include append, replace, delete and swap operations, and they are applied on the suspicious statements of the original program. These operators either append or replace a suspicious statement with a statement taken from elsewhere in the program, delete a suspicious statement, or swap two suspicious statements. Each variant generated after a mutation carries along its edit history, i.e., the series of changes made to the original program to generate the mutant. GenProg also uses crossover operator that takes as input edit history records of
two arbitrary repair candidates and mixes the history records to create two new edit history records which are then applied to the original program to generate two new mutants. Mutants generated after the mutation and crossover operations form a population of repair candidates which may contain a valid repair. Next, to search for a valid repair, each of the mutants is compiled and run against the test cases to compute a fitness score which defines how good a repair candidate is. Better candidates, whose fitness scores are higher, are selected to form a new population of mutants (aka. a new generation). This process is repeated many times until a valid repair which passes all the test cases is found or when some limits are reached (i.e., a time limit or a maximum number of populations is reached).
Training Phase Faulty Programs
Search-based Automated Program Repair
Feature Extraction
Model Learning
Repair Candidates
Deployment Phase
B. Random Forest Random forest is a popular classification algorithm that has been widely applied to many problems and shown to outperform other algorithms [4]. It is an ensemble classification technique that employs many weaker classifiers (i.e., classification models) to construct a dominant classifier [3]. At first, random forest performs decision tree learning on sampled subsets of a training data in order to create many different classification models in the form of decision trees. A decision tree is a tree in which each leaf node corresponds to a class label (in our case: effective or ineffective), each internal node corresponds to a test on the value of a feature, and an edge corresponds to a result of a test. These decision trees are the weaker classifiers and they capture characteristics of the sampled data. Subsequently, random forest combines all of these weaker classifiers using a majority voting strategy, i.e., given an instance to be classified, it takes the class label that is output by the majority of the weaker classifiers as the final prediction output. In this work, we use the implementation of random forest in the Weka toolkit [8], and configure random forest with 300 weaker classifiers (i.e., decision trees). III.
Effectiveness Labels
OVERALL F RAMEWORK
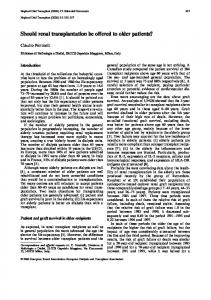
The goal of our framework is to build an oracle that is able to predict whether continuing a genetic programming search is likely to find a repair or not. Figure 1 depicts the overall framework of our approach. There are two main phases in our framework: training phase and deployment phase. The training phase is used to train a prediction model (or models) that is able to distinguish between effective and ineffective repair instances. The deployment phase then applies the model(s) generated by the training phase to a number of unknown repair instances. The output of the deployment phase indicates whether each of the repair instances is effective (i.e., it can successfully repair a bug within a time budget) or ineffective (i.e., it is unable to successfully repair a bug within a time budget). The following paragraphs describe the two phases of our framework. Training phase. This phase takes as input a training set of program repair instances and their associated effectiveness labels. Each instance in the training set is a faulty program that was processed by a SAPR technique. Each instance is associated with the following pieces information: 1) Source code of the corresponding faulty program.
Faulty Programs
Search-based Automated Program Repair
Prediction Model(s)
Feature Extraction
Prediction Output
Repair Candidates
Legend
Fig. 1.
Data
Effectiveness Prediction
Process
Model
Overall Framework
2) A set of test cases in which at least one of them fails. 3) A set of repair candidates (i.e., mutants) generated in the first iteration of a SAPR technique. 4) Effectiveness label (i.e., effective or ineffective) There are two major modules in the training phase: feature extraction and model learning. In the feature extraction module, which is described in detail in Section IV, we extract features that characterize program repair instances. In the model learning module, the extracted features and effectiveness labels of training instances are used to build a prediction model (or models) which is capable of differentiating effective instances from ineffective ones using a classification algorithm. Imbalanced data is an issue that we need to tackle during the training phase as there may be much more instances of one class label (in our case: effective or ineffective) than those of the other class label. Imbalanced data can adversely affect the effectiveness of a classification algorithm by biasing the learned prediction model to the class label that is supported by the majority of the data instances. To deal with this issue, we first check if the difference between the number of effective and ineffective instances in the training data is less than 10% of the total number of training instances. If the difference is less than 10%, we use the training instances to train one classification model. Otherwise, we perform an additional step to deal with the data imbalance problem. Rather than creating one prediction model, we create many (i.e., N ) prediction models where each of them is trained using a balanced training
dataset. Each balanced training dataset includes all instances of the minority class (i.e., class label that is supported by less training instances) and the same number of randomly selected instances of the majority class – we remove some instances of the majority class to balance the training dataset. These N prediction models are used collectively as a single composite model. By default, in our study, we use the random forest classification algorithm to train prediction model(s) (see Section II-B) and set the value of N to be 100. At the end of the training phase, the prediction model(s) are forwarded to the deployment phase. Deployment phase. This phase takes as input a set of program repair instances with unknown effectiveness labels. Similar to the training phase, feature extraction module is used to extract features that characterize the input program repair instances. Next, by utilizing the prediction model(s) constructed in the training phase and applying it to the extracted features, the deployment phase outputs predicted effectiveness labels of the input instances. If more than one prediction model is output by the training phase, majority voting is employed. Each of the models outputs a prediction (in our case: effective or ineffective), and the prediction that is supported by the majority of the models is output, i.e., an instance is deemed effective if more than N /2 models predict it as effective. In case of a tie (i.e., exactly N /2 models predict an instance as effective and the others predict it as ineffective), the label of an instance is randomly decided.
TABLE I. ID
Description
IP1 IP2 IP3 IP4 IP5
Size of program (statements count) Number of negative test cases Number of positive test cases IP2 + IP3
Input Program and Test Cases (6 Features)
IP6
F EATURE E XTRACTION
In our proposed framework, features are extracted from input program repair instances during the training and deployment phases. The training phase uses the features to learn a prediction model, and the deployment phase uses the features as input to the prediction model to predict effectiveness labels. In this section, we propose and describe a list of features that we extract from repair instances. We focus on features that we can extract from GenProg repair instances. Still, most of our features are generic enough and they can be extracted from repair instances of other SAPR techniques. We consider a total of 27 features to characterize a program repair instance, and these features are shown in Table I. These features are extracted from the faulty program, test cases, locality of suspicious program locations marked by GenProg, and initial population of repair candidates generated by GenProg. Since GenProg can identify suspicious program locations and generate the first set of repair candidates in little amount of time, the values of all the features can be extracted for a repair instance just a few seconds after GenProg is run. The features can be divided into three categories: input program and test cases, locality and number of suspicious areas, and initial repair candidates. We describe these three categories of features and their intuitions in the following paragraphs. Input Program and Test Cases: Six features, IP1 to IP6 , capture information about the inputs to GenProg. IP1 represents the size of the original program. Program size is likely to affect the amount of time needed to evaluate it. IP2 to IP4 capture the number of input test cases that are being used to evaluate the generated variants. The number of
IP2 IP4 IP3 IP4
Number and Locality of Suspicious Areas (3 Features) L1 L2 L3
Number of suspicious statements Number of files containing suspicious statements Number of functions containing suspicious statements
E1
Number of swap operations performed to create the compilable variants in the initial population Number of delete operations performed to create the compilable variants in the initial population Number of append operations performed to create the compilable variants in the initial population Number of replace operations performed to create the compilable variants in the initial population Total number of edit operations that create compilable variants in the initial population Ei E5 where i = 1 . . . 4 Sum of the numbers of return statements in functions that are mutated in the initial population Sum of the numbers of goto statements in functions that are mutated in the initial population Sum of the numbers of break statements in functions that are mutated in the initial population Sum of the numbers of continue statements in functions that are mutated in the initial population Sum of the numbers of conditional statements (i.e., if, else, else if) in functions that are mutated in the initial population Sum of the numbers of loop statements in functions that are mutated in the initial population Sum of the numbers of switch statements in functions that are mutated in the initial population Sum of the numbers of assignment statements in functions that are mutated in the initial population Sum of the numbers of function call statements in functions that are mutated in the initial population
Initial Repair Candidates (18 Features)
E2 E3 E4 E5 E5+i S1 S2 S3 S4
IV.
L IST OF FEATURES EXTRACTED FROM G EN P ROG INSTANCES (27 F EATURES )
S5 S6 S7 S8 S9
input test cases significantly impacts the cost of evaluating a variant. Since each test case has to be run on a variant, the more test cases are present, the more expensive it is to validate a variant. Since these features affect the time it takes to evaluate a variant, and time is the key factor that determines whether a repair instance is effective or not, we extract these features from repair instances. IP5 and IP6 are the ratio of the number of passing test cases and the number of failing test cases over the total number of test cases. More failing test cases might result in better identification of suspicious areas which translates to higher likelihood of producing a correct repair in a shorter amount of time. Number and Locality of Suspicious Areas: Three features, L1 to L3 , capture information about the number and locality of suspicious areas that are identified by GenProg. L1 indicates the number of suspicious statements that are targets to be modified. The probability of generating a correct repair is likely to be inversely proportional to the number of suspicious statements. A larger number of suspicious statements translates to more locations where GenProg has to perform mutations. Thus, if this feature has a higher value,
the search space to find a valid repair will be enlarged and the repair cost is likely to be increased. Thus, this feature is related to the effectiveness of GenProg. L2 and L3 indicate the number of files and functions that include the suspicious statements. These features are related to the complexity of a bug that needs to be fixed. For example, fixing a bug that involves modifications in multiple functions (or files) may incur much cost since a change at one function (or file) needs to be accompanied with corresponding changes in other functions (or files). Initial Repair Candidates: Eighteen features capture information about initial repair candidates (or variants) that are generated in the initial population. The first 9 features include E1 to E5 and E5+i where i = 1 . . . 4. Four features, E1 to E4 , capture information on the number of edits made using GenProg’s append, delete, swap and replace mutation operators that can create compilable variants. The next five features, E5 and E5+i where i = 1 . . . 4, correspond to the sum of the number of edits made using any one of the four mutation operators as well as the ratio of the number of edits made using each of the operators to the sum. The features indicate whether the variants generated in the first population are diverse (i.e., they are generated using various edit operators) or uniform (e.g., they are generated using only one or a few of the operators). A higher diversity may lead to a higher possibility of obtaining a valid repair. The extraction of these 9 features is done by calculating the number of times each edit operation (e.g., append, delete, swap or replace) is performed to create compilable variants in the initial population. The remaining 9 features, S1 to S9 , capture various information about the structure of the Abstract Syntax Tree (AST) of the functions mutated in the generated variants. Since GenProg is a syntactic search-based approach, which tries to change the AST of the original program to create new mutants, capturing the characteristics of the changed AST is crucial. The AST characteristics are related to the search space of possible variants in the subsequent iterations. For example, a function with a single loop can be mutated in more ways than a function with a single assignment statement. A smaller search space corresponds to a higher likelihood to find an edit that fixes a bug. We extract these 9 features by using CIL1 , an infrastructure for C program analysis and transformation. For each function that is mutated to create variants in the initial population, we traverse its corresponding AST using CIL and calculate the sums of the numbers of statements of various kinds (e.g., return, goto, etc) that appear in the mutated functions’ ASTs. V.
E XPERIMENTS & A NALYSIS
In this section, we first describe our dataset, followed by our evaluation metrics, research questions, results, and threats to validity. A. Dataset We apply our approach to predict the effectiveness of GenProg on a popular dataset for automated program repair, 1 http://kerneis.github.io/cil/
TABLE II.
DATASET D ESCRIPTION . “LOC” STANDS FOR NUMBER OF LINES OF CODE . “#T ESTS ” REPRESENTS THE NUMBER OF TEST CASES . “#D EFECTS ” IS THE NUMBER OF DEFECTS ( I . E ., BUGS ) Program fbc gmp gzip libtiff lighttpd php python wireshark Total
LOC 97,000 145,000 141,000 77,000 62,000 1046,000 407,000 2814,000 5319,000
#Tests 773 146 12 78 295 8471 355 63 10193
#Defects 3 2 5 24 9 44 11 7 105
which consists of 105 real defects from 8 different systems 2 . These defects have been utilized to evaluate the performance of search-based automated program repair techniques [23], [33]. Table II describes detailed information of our dataset. We apply GenProg to the 105 defects following the procedure described in [23]. We obtain the implementation of GenProg from its authors. For each defect, we run 10 GenProg trials in parallel. Each trial is terminated after 12 hours or 10 generations or whenever a successful repair is found by another trial. Each trial is assigned to one 3.4 GHz Intel Core i7-4770 CPU and 1 GB of memory. Among the 105 bugs, GenProg can successfully fix 53 of them.3 An application of GenProg to a defective program corresponds to a GenProg instance. We assign effectiveness labels to 105 GenProg instances corresponding to the 105 defects in our dataset. By default, we assign effective labels to 53 bugs that GenProg can fix and ineffective labels to the 52 bugs that GenProg cannot fix. For this default setting, an instance is deemed effective if a successful fix can be inferred within 12 hours using 10 parallel GenProg trials. In addition to this default setting, we also investigate other thresholds to decide for effective and ineffective instances (see RQ3 in Section V-C). In particular, we sort the 53 instances that GenProg can repair in ascending order of their repair time (i.e., time from GenProg starting to its termination). We then adjust a time budget threshold that divides these 53 instances to two parts, in which instances in the first part, which correspond to those that can be fixed in a time shorter than or equal to the threshold, are considered as effective, while instances in the second part and the 52 bugs that GenProg cannot fix are considered as ineffective. B. Evaluation Metrics and Experiment Settings We evaluate the effectiveness of our approach in terms of precision, recall, F-measure, and AUC. These are well-known metrics that have been frequently used to evaluate various prediction engines [9]. To calculate precision, recall, and Fmeasure, we need to first compute true positives (TP), false positives (FP), true negatives (TN) and false negatives (FN). Their definitions are as follows: 2 http://dijkstra.cs.virginia.edu/genprog/resources/genprog-icse2012benchmarks 3 In the experiment conducted by Le Goues et al. [23], GenProg can successfully fix 55 out of the 105 bugs. Due to randomness of the genetic programming algorithm that is used by GenProg and differences in the machines used to run the experiments, in our experiment, the number of bugs fixed is slightly reduced.
TP: FP: TN: FN:
Number of effective program repair instances that are predicted correctly. Number of ineffective program repair instances that are predicted incorrectly. Number of ineffective program repair instances that are predicted correctly. Number of effective program repair instances that are predicted incorrectly.
stratified 10-fold cross validation). By comparing the predicted labels (that our approach outputs) with the ground truth labels, we compute the precision, recall, F-measure, and AUC of our approach. RQ2 How effective is our approach in comparison to the baselines?
(2)
In this research question, we compare the performance of our approach with two baseline models, including an alleffective model and a random model. The all-effective model predicts all program repair instances as effective, while the random model randomly predicts the effectiveness of program repair instances. For the random model, we apply the model 100 times, and compare its average performance to our approach.
(3)
RQ3 How effective is our approach if the time budget threshold is varied?
Based on the true positives (TP), false positives (FP), true negatives (TN), and false negatives (FN), precision, recall and F-measure can be computed as follows: TP TP + FP TP Recall = TP + FN 2 × P recision × Recall F-measure = P recision + Recall
P recision =
(1)
A trade-off between precision and recall usually happens. In particular, a higher precision is often followed by a lower recall and vice versa. Thus, F-measure, which is the harmonic mean of precision and recall, is often used as a summary measure. AUC is the area under the Receiver Operating Characteristics (ROC) curve. A ROC curve for a label l (i.e., effective or ineffective) plots the true positive rates for l versus the false positive rates. This curve could be created by taking into account the likelihood of each data point (i.e., repair instance whose label is being predicted) that will be assigned label l. This likelihood is then considered as the classification threshold; allowing the rates of true positives and false positives to be computed for each repair instance. Thus, each instance contributes a point in a ROC curve. AUC is the area under this ROC curve. We use stratified ten-fold cross validation to estimate the performance of our approach in terms of precision, recall, Fmeasure, and AUC. Stratified ten-fold cross validation aims to assess the performance of a prediction model on an independent test data. To perform stratified ten-fold cross validation, we divide the dataset into ten groups with equal size. The proportion of positive instances over negative instances is maintained across groups. Out of these ten groups, nine groups are used for training and one group is used for testing. This process is repeated ten times to make sure that each of the ten groups is chosen as test group once. The final precision, recall, F-measure, and AUC are computed by aggregating results obtained from the ten iterations. C. Research Questions We answer the following research questions that assess and investigate different aspects of our approach. RQ1 How effective is our approach in predicting the effectiveness of GenProg instances? In this research question, we investigate the performance of our approach when predicting whether GenProg instances are effective or ineffective. To answer this research question, we apply our approach to predict effectiveness labels of 105 GenProg instances corresponding to the 105 defects (using
As described in Section V-A, by default, we define whether an instance to be effective or not depending on whether the bug can be successfully fixed by 10 trials of GenProg within 12 hours. In this research question, we investigate the effectiveness of our approach considering different time budget thresholds. The time budget threshold is the maximum time limit for an application of GenProg (i.e., a GenProg instance) to be considered as effective. When the time budget threshold increases, the number of effective instances increases. On the other hand, if the time budget threshold decreases, the number of ineffective instances increases. To answer this research question, we vary the time budget threshold between 2 hours and 11 hours – within the time limit for each repair trial. We compute the precision, recall, F-measure, and AUC of our approach for each time budget threshold. RQ4 Which of the proposed features best differentiate effective from ineffective program repair instances? In this research question, we investigate which of the proposed features (see Table I) are more dominant and thus more effective in helping our approach achieves better accuracy. In the machine learning community, Fisher score is often used to measure how dominant or discriminative a feature is [7], [6]. The Fisher score is computed as follows: P#class (class) xj −x ¯j )2 class=1 (¯ F S(j) = P#class Pnclass (class) (class) 2 1 −x ¯j ) ) class=1 ( nclass −1 i=1 (xi,j In the equation above, F S(j) denotes the Fisher score of the j th feature, nclass denotes the number of data points (in our setting: repair instances) with label class (in our case: effective or ineffective), x ¯j denotes the average value of the j th feature (class) of all data points, x ¯j denotes the average value of the j th (class) feature of class-labeled data points, and xi,j denotes the value of the j th feature of the ith class-labeled data point. It is worth noting that Fisher score takes a value ranging from 0 to 1. Features with higher Fisher scores are more discriminative, i.e., features with Fisher score of 1 are very discriminative while features with Fisher Score of 0 are not discriminative. RQ5 How do different classification techniques impact the effectiveness of our proposed approach?
There are various classification techniques proposed in the literature. By default, our approach uses random forest as the classification technique. In this research question, we investigate the effectiveness of our approach using different classification techniques. We consider four other classification techniques: Logistic Regression [22], Support Vector Machine (SMO) [32], [13], [10], KStar [5] and J48 [34]. We use the implementation of these classification techniques that are available in the Weka toolkit. RQ6 How does the amount of training data affect the effectiveness of our approach? Stratified ten-fold cross validation is used to evaluate our approach. In stratified ten-fold cross validation, 90% of the data is used for training, while the remaining 10% is used for testing. In this research question, we investigate if reducing the amount of training data would impact the effectiveness of our proposed approach. To answer this research question, we perform 100 trials. For each trial, we randomly sample 20% to 90% of our defect dataset to create 9 training datasets of various sizes, and evaluate our approach using the new training datasets. At the end of the 100 trials, for each training data size (i.e., 20% to 90% of the defect dataset), we report the average precision, recall, F-measure, and AUC across the 100 trials. Note that since we randomly resample 90% of the defects and perform 100 trials, the result for 90% training data differs from the result of the experiment performed to answer RQ1. RQ7 How does our proposed approach benefit from active learning? Active learning attempts to train a good classification model with minimal amount of labelled data [37]. Given a budget specifying how many repair instances we are willing to manually label, a subset of repair instances that are the most informative is selected and then labelled by developers. These manually labelled instances can be used to train a model to label other unlabelled repair instances. In this research question, we investigate if active learning can work well in predicting the effectiveness of GenProg with minimal amount of labelled training data. We use a Java library called JCLAL4 that supports active learning to conduct an experiment to answer this research question. We use three uncertainty sampling strategies to pick instances to label: entropy sampling, least confident sampling, and margin sampling [37]. These strategies pick instances that a classification model finds hard to label. We first build an initial random forest model using 10% of all instances that are randomly sampled from the original pool of instances (i.e., a pool of 105 instances). Using the initial model, the active learning process then starts to recommend new instances to label and it stops when the number of manually labelled instances reaches 20% of the total number of instances. We use stratified ten-fold cross validation to assess the performance of the three uncertainty sampling strategies, and report their precisions, recalls, F-measures, and AUCs. D. Results In this section, we describe the results of our experiments which answer our research questions. 4 http://sourceforge.net/projects/jclal/
RQ1: Overall Accuracy. Our approach can achieve precision, recall, F-measure and AUC of 72%, 74%, 73%, and 76%, respectively. The variances of precision, recall, F-measure, and AUC across the ten folds during the ten-fold cross validation are small (less than 0.04). This indicates that the performance of our approach is stable across folds. Comparing with other studies solving various prediction tasks in the software engineering research literature, e.g., [36], [38], [43], the F-measure and AUC that our approach can achieve is comparable or higher. RQ2: Comparison with Baseline Models. Table III compares the performance of baseline models, including the all-effective model and random model, with our approach in terms of precision, recall, F-measure and AUC. From the table, we can note that our approach performs the best among the three models. Particularly, our approach outperforms the best performing baseline – all-effective model, in terms of Fmeasure and AUC by 9% and 52%, respectively. TABLE III. Precision Recall F-measure AUC
O UR A PPROACH VS . BASELINE M ODELS
All-Effective Model 51% 100% 67% 50%
Random Model 51% 50% 50% 50%
Our Approach 72% 74% 73% 76%
RQ3: Varying Time Budget Threshold. Figure 2 and 3 show the precisions, recalls, F-measures, and AUCs of our approach for various time budget thresholds. From Figure 2, we can note that our approach achieves the highest F-measure of 80% and when the time threshold is set to five hours. When the time threshold is increased from five hours to 11 hours, the F-measure of our approach reduces to 70%. When we reduce the time threshold from five hours to two hours, there is also a degradation in the performance of our approach. The lowest Fmeasure of 65% is when the time threshold is set at two hours, for which the proportion of effective instances is around 36%. From Figure 3, we can note that the fluctuations of AUC across the time thresholds is similar to the fluctuations of F-measure. Overall, our approach works reasonably well (i.e., F-measure and AUC larger than 60% and 70%, respectively) for all time budget thresholds. For thresholds equal to 2, 3, and 4 hours, data imbalance problem exists and our data balancing strategy kicks in (i.e., by creating N prediction models learned from balanced training datasets instead of only one model). Without this data balancing strategy, the effectiveness of our approach is reduced. Figure 4 and 5 show the precisions, recalls, F-measures, and AUCs of our approach when the data balancing strategy is turned off. F-measure can be increased by up to 23% (for time threshold at 2 hours) while AUC remains more or less the same, when we employ the data balancing strategy. RQ4: Important Features. Table IV shows the list of the top10 most important features5 . We find that the top-10 features come from all three feature categories in Table I. Six out of the top-10 features belong to the initial repair candidates category. This highlights that the diversity of the initial repair candidates has an important role in determining whether a repair instance will be effective or not. Also, the AST characteristics 5 Please
refer to Table I for a detailed description of the features
90
80
80
Percentage (%)
Percentage (%)
90
70 60 50 40
70 60 50 40 30
30
20
20 2
3
4
5
6
7
8
9
10
2
11
3
4
Time Threshold (Hours) Precision
Recall
F-measure
Precision
Effective Instances/Total
Fig. 2. Precisions, Recalls, F-measures of Our Approach and Percentages of Effective Instances for Different Time Budget Thresholds
6
7
8
9
10
11
90
90
80
80
70 60 50 40 30
Recall
F-measure
Effective Instances/Total
Fig. 4. Precisions, Recalls, F-measures of Our Approach (Without Data Balancing) and Percentages of Effective Instances for Different Time Budget Thresholds
Percentage (%)
Percentange (%)
5
Time Threshold (Hours)
70 60 50 40 30
20 2
3
4
5
6
7
8
9
10
11
20 2
3
4
Time Threshold (Hours) AUC
5
6
7
8
9
10
11
Time Threshold (Hours)
Effective Instances/Total
AUC
Effective Instances/Total
Fig. 3. AUCs of Our Approach and Percentages of Effective Instances for Different Time Budget Thresholds
Fig. 5. AUCs of Our Approach (Without Data Balancing) and Percentages of Effective Instances for Different Time Budget Thresholds
which govern the space of possible repair candidates in the subsequent GenProg iterations are also important to predict the effectiveness of a repair instance. All features belonging to the number and locality of suspicious areas category are among the top-10 features. These features correspond to the size of the search space that GenProg needs to traverse to find a successful fix and the complexity of a defect. One of the top-10 features belongs to the input programs and test cases category. This feature is the number of negative test cases which influences the difficulty of finding a successful fix. The more negative test cases are available to characterize a defect, the more hints GenProg has to locate and fix the defect.
From the table, we can note that among the five classification algorithms, random forest, which is the default classification algorithm, is the best performer. The second best performer is KStar, followed by J48, Logistic Regression and SMO.
TABLE IV. Rank 1 2 3 4 5 6 7 8 9 10
Feature S4 IP2 S7 E5 L2 S3 S8 L1 L3 S2
TABLE V.
P RECISIONS , R ECALLS , F- MEASURES AND AUC S OF D IFFERENT C LASSIFIERS
Classification Algorithm Random Forest [Default] SMO Logistic Regression J48 KStar
Precision 72% 50% 52% 64% 67%
Recall 74% 64% 55% 72% 64%
F-measure 73% 56% 53% 68% 65%
AUC 76% 49% 53% 65% 73%
T OP -10 M OST D ISCRIMINATIVE F EATURES Short Description Number of continue statements in mutated functions Number of negative test cases Number of switch statements in mutated functions Total number of edit operations that create compilable variants Number of files containing suspicious statements Number of break statements in mutated functions Number of assignment statements in mutated functions Number of suspicious statements Number of functions containing suspicious statements Number of goto statements in mutated functions
RQ5: Effectiveness of Different Classification Algorithms. Table V shows precisions, recalls, F-measures, and AUCs of our approach when we use different classification algorithms.
RQ6: Varying Amount of Training Data. Table VI shows the precisions, recalls, F-measures, and AUCs of our approach for various amount of training data. From the table, we can note that in general the effectiveness of our approach is progressively increased (in terms of F-measure and AUC) when we increase the amount of training data from 20% to 90% of all instances. Overall, our approach performs reasonably well (F-measure and AUC of 60% or higher) when the amount of training data is at least 40% of all instances. RQ7: Active Learning. Table VII shows the precisions, recalls, F-measures, and AUCs of our approach when employing an active learning approach with different uncertainty sampling strategies. From the table, we can note that margin sampling is the best performer, followed by entropy sampling and least
TABLE VI.
P RECISIONS , R ECALLS , F- MEASURES , AND AUC S FOR D IFFERENT A MOUNT OF T RAINING DATA
Amount of Training Data 20% 30% 40% 50% 60% 70% 80% 90%
Precision 56% 58% 60% 63% 66% 69% 68% 71%
Recall 55% 57% 62% 64% 62% 62% 65% 71%
F-measure 55% 57% 60% 63% 63% 65% 65% 69%
AUC 56% 61% 65% 68% 70% 71% 72% 77%
confident sampling. It is interesting to note that with only 20% of all instances (21 out of 105 instances) manually labelled, active learning can achieve reasonable performance (i.e., Fmeasure of 62% and AUC of 65%). This result is better than when active learning is not employed – c.f., Table VI. TABLE VII.
ACTIVE L EARNING : P RECISIONS , R ECALLS , F- MEASURES AND AUC S .
Sampling Strategy Margin Sampling Entropy Sampling Least Confident Sampling
VI.
Precision 54% 58% 42%
Recall 74% 58% 51%
F-measure 62% 55% 44%
AUC 65% 61% 61%
T HREATS TO VALIDITY
We consider three kinds of threats to validity: internal, external and constructing validity. We describe each of threats to validity separately as follow Threats to Internal Validity. Threats to internal validity relate to errors in our implementation and experiments. We have rechecked our implementation and experiments and fixed errors that we have found. Still, there could be additional errors that we did not notice. Threats to External Validity. Threats to external validity correspond to the generalizability of our findings. In this study, we have analyzed 105 real bugs from 8 different C programs. These programs have been extensively used to evaluate past search-based automated program repair techniques, e.g., [23], [33]. Still, more programs with more real bugs can be analyzed to mitigate the threats further. Besides, more search-based program repair techniques can be used for our study as well. We plan to do this in our future work. Threats to Construct Validity. Threats to construct validity correspond to the suitability of our evaluation metrics. The standard metrics of precision, recall, F-measure, and AUC that we use are well-known metrics in data mining and machine learning. These metrics have been used as yardsticks to evaluate many past software engineering studies, e.g., [11], [21]. Another threat to construct validity is our definition of an effective repair instance. We consider an instance to be effective if a SARP technique can successfully produce a fix within a time budget threshold. Other definitions of an effective repair instance can be considered, e.g., number of patch candidates generated until a successful fix is found is less than a certain threshold, etc. We leave the consideration of other definitions of an effective repair instance to a future work.
VII.
R ELATED W ORK
In this section, we describe related research studies in automated program repair and application of classification algorithms for various software engineering tasks. A. Automated Program Repair Recently, automated program repair have received considerable attention in the software engineering research community. Several techniques have been proposed to automatically repair program defects [30], [23], [24], [14]. Le Goues et al. propose GenProg, the first search-based automated patch generator [23], [24]. By syntactically mutating a buggy program using genetic programming, GenProg generates a large number of variants that are possible patch candidates. GenProg favors variants that pass more test cases and select promising variants to produce new variants until one variant, which passes all the test cases, is found. A systematic evaluation of GenProg has shown GenProg’s capability to fix many real-world bugs [23]. Kim et al. propose a novel automated patch generation technique, named Pattern-based Automatic program Repair (PAR), which uses fix patterns learned from existing humanwritten patches [14]. Several common fix patterns are learned from more than 60,000 human-written patches, and divided into eight common fix patterns. Based on the common fix patterns, ten fix templates are manually created, which can be applied to generate patches at various fault locations of the buggy program. PAR uses genetic programming to help in applying the fix templates. The result of their experiment shows that PAR can automatically generate patches that are comparable to human-written patches. Qui et al. propose RSRepair, which repairs faulty program by using random search [33]. RSRepair uses the same mutation operators that are used by GenProg to create mutants as repair candidates. However, different from GenProg, RSRepair does not compute fitness scores of mutants to guide the mutant generation process. Rather, RSRepairs randomly generates mutants until a valid repair is found. Since RSRepair does not compute fitness scores of mutants, it can discard a repair candidate once one of the test cases fails. GenProg on the other hand needs to run all the test cases to compute the fitness score of a mutant. When the number of the test cases is large, the random search process of RSRepair saves significant cost in evaluating repair candidates. B. Applications of Classification Algorithms There have been several prior studies that employ classification algorithms to help automate various software engineering tasks. We highlight some of them below. Classification techniques have been applied to predict important information of issues opened in bug tracking systems. Menzies and Marcus, Lamkafi et al., and Tian et al. utilized classification algorithms to predict the severity of bug reports [28], [17], [18], [40]. Menzies and Marcus and Tian et al. predict fine-grained bug severity labels, while Lamkafi et al. predict coarse-grained bug severity labels. Tian et al. build a statistical model that considers multiple factors to predict the priority of bug reports [41]. Different from severity
which is assigned based on a user’s perspective, priority is assigned based on developers’ perspective considering other bugs that developers need to fix. Tian et al. consider temporal, textual, author, related-report, severity, and product features to predict the priority of bug reports. Antoniol et al. introduce a framework to predict whether an issue is a bug report or a feature request [1]. Kochhar et al. extend Antoniol et al. work by predicting fine-grained issue reclassifications [15]. In their work, an issue can be classified as a bug, request for improvement, documentation, refactoring, task, etc. Jalbert and Weimer and Tian et al. predict if a bug report is a duplicate bug report [12], [42]. Zhang et al. propose an approach that can predict if the time needed to resolve a bug report will be short or long [45]. Classification techniques have also been used to predict modules that are likely to contain bugs and vulnerabilities. Lu et al. propose approaches that utilize semi-supervised learning and active learning with dimensionality reduction to predict defect prone modules [27], [26]. Panichella et al. predict defect prone software entities by leveraging defect data from another project [31]. Zimmermann et al. use several classical metrics such as complexity, churn, coverage, dependency measures, and organizational structure of a company, to predict modules containing security vulnerabilities in Windows Vista [46]. Scandariato et al. propose a vulnerability prediction model learned from text features extracted from source code files to predict which components of a software system are likely to contain security vulnerabilities [35]. Classification techniques have also been applied to predict if a software behavior is normal or faulty. Lo et al. mine iterative patterns from execution traces, and use these mined patterns as features to train a classifier for failure detection [25]. An iterative pattern is a sequence of method calls that appear frequently in execution traces. These patterns form composite features that can be used as signatures to differentiate normal and faulty execution traces. Bowring et al. propose an active learning technique where a classifier is incrementally trained based on a series of training data points to classify software behaviors [2]. The proposed approach uses Markov models to capture regularities in program execution traces and clusters these Markov models to create an effective predictors to classify software behaviors. Different from the above mentioned studies, our work considers a different problem. We utilize a classification algorithm to recommend whether developers should continue to wait for an automatic software repair tool to finish fixing a faulty program or revert to other traditional approaches to fix the program. The closest to our work are studies which utilize classification algorithms to recommend whether developers should follow an output of an automatic debugging tool [19], [20], [21]. Le and Lo propose an approach to predict the effectiveness of a spectrum-based fault localization (SBFL) tool for a given set of program spectra [19], [20]. To predict the effectiveness of a SBFL tool on a program spectra, their proposed approach extracts many features from execution traces and suspiciousness scores outputted by the SBFL tool. Le et al. propose an approach to predict the effectiveness of an information retrieval (IR) based bug localization tool for a given bug report [21]. To predict the effectiveness of an IR-
based bug localization tool on a bug report, their proposed approach extracts many features from the textual contents of the bug report and suspiciousness scores outputted by the IR-based bug localization tool. In this work, we consider a different problem namely the prediction of the effectiveness of an automated program repair tool when fixing a faulty program. Since we are considering a new problem, we need to extract a new set of features that are related to the likelihood of a repair instance to be effective or not. Different from the work by Le and Lo, and Le et al., in this work, we extract features from the input program, number and locality of suspicious program locations marked by GenProg, and the first initial population of repair candidates generated by GenProg. VIII.
C ONCLUSION AND F UTURE W ORK
In this study, we build an oracle that can predict whether an automated program repair tool will find a repair for a defect within a desired time limit or not. We evaluate our solution based on a well-known genetic programming based program repair tool named GenProg. To build the oracle that can predict the effectiveness of GenProg, we propose 27 features that capture various characteristics of program repair instances (i.e., applications of GenProg to repair faulty programs). These features are extracted from the faulty program, test cases, number and locality of suspicious program locations marked by GenProg, and the first initial population of repair candidates generated by GenProg. Using a machine learning algorithm, we build a discriminative model based on features extracted from a training set of program repair instances. This model is then leveraged to predict if unknown program repair instances can be successfully fixed by GenProg in a given time budget. We have evaluated the ability of our approach to predict the effectiveness of GenProg in fixing 105 real bugs. The experiment results show that approach can achieve a precision, recall, F-measure, and AUC of 72%, 74%, 73%, and 76%, respectively. Furthermore, our approach outperforms the best baseline that predicts all repair instances as effective by 9% and 52% in terms of F-measure and AUC, respectively. As future work, we plan to further improve the precision, recall, F-measure, and AUC of our approach. To achieve this goal, we plan to design additional features that can help to differentiate effective from ineffective repair instances. We also plan to perform an in-depth analysis to explain the reason why our approach is less effective in some cases. Based on this analysis, we will design appropriate extensions to our approach. Furthermore, we plan to apply our solution to predict the effectiveness of other automated program repair techniques, e.g., [30], [14], [44]. Subsequently, we can build a general framework to recommend developers the best program repair technique that should be used to fix a particular bug. Additionally, rather than using a standard off-the-shelf classification algorithm, it will also be interesting to design a specialized classification algorithm that is optimized to predicting the effectiveness of program repair instances. ACKNOWLEDGMENT We would like to thank Claire Le Goues, ThanhVu Nguyen, Stephanie Forrest, and Westley Weimer for providing us the implementation of GenProg and the bugs that were used to assess the effectiveness of GenProg.
R EFERENCES [1]
[2] [3] [4] [5] [6] [7] [8] [9] [10] [11]
[12]
[13] [14] [15]
[16] [17] [18]
[19]
[20] [21] [22] [23]
[24]
G. Antoniol, K. Ayari, M. Di Penta, F. Khomh, and Y.-G. Gu´eh´eneuc, “Is it a bug or an enhancement?: a text-based approach to classify change requests,” in Proceedings of the 2008 conference of the center for advanced studies on collaborative research: meeting of minds. ACM, 2008, p. 23. J. F. Bowring, J. M. Rehg, and M. J. Harrold, “Active learning for automatic classification of software behavior,” in ACM SIGSOFT Software Engineering Notes, vol. 29, no. 4. ACM, 2004, pp. 195–205. L. Breiman, “Random forests,” Machine Learning, vol. 45, no. 1, pp. 5–32, 2001. R. Caruana and A. Niculescu-Mizil, “An empirical comparison of supervised learning algorithms,” in Proceedings of the 23rd international conference on Machine learning. ACM, 2006, pp. 161–168. J. G. Cleary and L. E. Trigg, “K*: An instance-based learner using an entropic distance measure,” in 12th International Conference on Machine Learning, 1995, pp. 108–114. R. O. Duda, P. E. Hart, and D. G. Stork, Pattern classification. John Wiley & Sons,, 1999. Q. Gu, Z. Li, and J. Han, “Generalized fisher score for feature selection,” arXiv preprint arXiv:1202.3725, 2012. M. Hall, E. Frank, G. Holmes, B. Pfahringer, P. Reutemann, and I. H. Witten, “The weka data mining software: an update,” ACM SIGKDD explorations newsletter, vol. 11, no. 1, pp. 10–18, 2009. J. Han, M. Kamber, and J. Pei, “Data mining: Concepts and techniques, (the morgan kaufmann series in data management systems),” 2006. T. Hastie, R. Tibshirani et al., “Classification by pairwise coupling,” The annals of statistics, vol. 26, no. 2, pp. 451–471, 1998. L. Huang, V. Ng, I. Persing, R. Geng, X. Bai, and J. Tian, “Autoodc: Automated generation of orthogonal defect classifications,” in 2011 26th IEEE/ACM International Conference on Automated Software Engineering (ASE). IEEE, 2011, pp. 412–415. N. Jalbert and W. Weimer, “Automated duplicate detection for bug tracking systems,” in IEEE International Conference on Dependable Systems and Networks With FTCS and DCC, 2008. IEEE, 2008, pp. 52–61. S. S. Keerthi, S. K. Shevade, C. Bhattacharyya, and K. R. K. Murthy, “Improvements to platt’s smo algorithm for svm classifier design,” Neural Computation, vol. 13, no. 3, pp. 637–649, 2001. D. Kim, J. Nam, J. Song, and S. Kim, “Automatic patch generation learned from human-written patches,” in 2013 35th International Conference on Software Engineering (ICSE), May 2013, pp. 802–811. P. S. Kochhar, F. Thung, and D. Lo, “Automatic fine-grained issue report reclassification,” in 2014 19th International Conference on Engineering of Complex Computer Systems, Tianjin, China, August 4-7, 2014, 2014, pp. 126–135. J. R. Koza, Genetic programming: on the programming of computers by means of natural selection. MIT press, 1992, vol. 1. A. Lamkanfi, S. Demeyer, E. Giger, and B. Goethals, “Predicting the severity of a reported bug,” in 7th IEEE Working Conference on Mining Software Repositories (MSR). IEEE, 2010, pp. 1–10. A. Lamkanfi, S. Demeyer, Q. D. Soetens, and T. Verdonck, “Comparing mining algorithms for predicting the severity of a reported bug,” in 15th European Conference on Software Maintenance and Reengineering (CSMR). IEEE, 2011, pp. 249–258. T.-D. B. Le and D. Lo, “Will fault localization work for these failures? an automated approach to predict effectiveness of fault localization tools,” in 29th IEEE International Conference on Software Maintenance (ICSM). IEEE, 2013, pp. 310–319. T.-D. B. Le, D. Lo, and F. Thung, “Should i follow this fault localization tool’s output? automated prediction of fault localization effectiveness,” Empirical Software Engineering, 2014. T.-D. B. Le, F. Thung, and D. Lo, “Predicting effectiveness of ir-based bug localization techniques,” in 25th IEEE International Symposium on Software Reliability Engineering (ISSRE), 2014. S. le Cessie and J. van Houwelingen, “Ridge estimators in logistic regression,” Applied Statistics, vol. 41, no. 1, pp. 191–201, 1992. C. Le Goues, M. Dewey-Vogt, S. Forrest, and W. Weimer, “A systematic study of automated program repair: Fixing 55 out of 105 bugs for 8 each,” in Software Engineering (ICSE), 2012 34th International Conference on. IEEE, 2012, pp. 3–13. C. Le Goues, T. Nguyen, S. Forrest, and W. Weimer, “Genprog: A generic method for automatic software repair,” IEEE Transactions on Software Engineering, vol. 38, no. 1, pp. 54–72, 2012.
[25]
[26]
[27]
[28] [29] [30] [31]
[32] [33] [34] [35] [36] [37] [38]
[39] [40]
[41]
[42]
[43]
[44]
[45]
[46]
D. Lo, H. Cheng, J. Han, S.-C. Khoo, and C. Sun, “Classification of software behaviors for failure detection: a discriminative pattern mining approach,” in Proceedings of the 15th ACM SIGKDD international conference on Knowledge discovery and data mining. ACM, 2009, pp. 557–566. H. Lu, B. Cukic, and M. Culp, “Software defect prediction using semi-supervised learning with dimension reduction,” in Automated Software Engineering (ASE), 2012 Proceedings of the 27th IEEE/ACM International Conference on. IEEE, 2012, pp. 314–317. H. Lu, E. Kocaguneli, and B. Cukic, “Defect prediction between software versions with active learning and dimensionality reduction,” in 25th IEEE International Symposium on Software Reliability Engineering (ISSRE), 2014. T. Menzies and A. Marcus, “Automated severity assessment of software defect reports,” in IEEE International Conference on Software Maintenance (ICSM 2008). IEEE, 2008, pp. 346–355. F. F.-H. Nah, “A study on tolerable waiting time: how long are web users willing to wait?” Behaviour & Information Technology, vol. 23, no. 3, pp. 153–163, 2004. H. D. T. Nguyen, D. Qi, A. Roychoudhury, and S. Chandra, “Semfix: Program repair via semantic analysis,” in 2013 35th International Conference on Software Engineering (ICSE), May 2013, pp. 772–781. A. Panichella, R. Oliveto, and A. D. Lucia, “Cross-project defect prediction models: L’union fait la force,” in 2014 Software Evolution Week - IEEE Conference on Software Maintenance, Reengineering, and Reverse Engineering, CSMR-WCRE 2014, Antwerp, Belgium, February 3-6, 2014, 2014, pp. 164–173. J. Platt et al., “Sequential minimal optimization: A fast algorithm for training support vector machines,” 1998. Y. Qi, X. Mao, Y. Lei, Z. Dai, and C. Wang, “The strength of random search on automated program repair.” in ICSE, 2014, pp. 254–265. R. Quinlan, C4.5: Programs for Machine Learning. San Mateo, CA: Morgan Kaufmann Publishers, 1993. R. Scandariato, J. Walden, A. Hovsepyan, and W. Joosen, “Predicting vulnerable software components via text mining,” 2014. H. Seo and S. Kim, “Predicting recurring crash stacks,” in Proceedings of the 27th IEEE/ACM International Conference on Automated Software Engineering. ACM, 2012, pp. 180–189. B. Settles, “Active learning literature survey,” University of Wisconsin, Madison, vol. 52, no. 55-66, p. 11, 2010. E. Shihab, A. Ihara, Y. Kamei, W. M. Ibrahim, M. Ohira, B. Adams, A. E. Hassan, and K.-i. Matsumoto, “Studying re-opened bugs in open source software,” Empirical Software Engineering, vol. 18, no. 5, pp. 1005–1042, 2013. G. Tassey, “The economic impacts of inadequate infrastructure for software testing.” National Institute of Standards and Technology. Planning Report 02-3.2002, 2002. Y. Tian, D. Lo, and C. Sun, “Information retrieval based nearest neighbor classification for fine-grained bug severity prediction,” in 19th Working Conference on Reverse Engineering (WCRE), 2012. IEEE, 2012, pp. 215–224. ——, “DRONE: predicting priority of reported bugs by multi-factor analysis,” in 2013 IEEE International Conference on Software Maintenance, Eindhoven, The Netherlands, September 22-28, 2013, 2013, pp. 200–209. Y. Tian, C. Sun, and D. Lo, “Improved duplicate bug report identification,” in 16th European Conference on Software Maintenance and Reengineering, CSMR 2012, Szeged, Hungary, March 27-30, 2012, 2012, pp. 385–390. J. Walden, J. Stuckman, and R. Scandariato, “Predicting vulnerable components: Software metrics vs text mining,” in Software Reliability Engineering (ISSRE), 2014 IEEE 25th International Symposium on. IEEE, 2014, pp. 23–33. W. Weimer, Z. Fry, and S. Forrest, “Leveraging program equivalence for adaptive program repair: Models and first results,” in 2013 IEEE/ACM 28th International Conference on Automated Software Engineering (ASE), Nov 2013, pp. 356–366. H. Zhang, L. Gong, and S. Versteeg, “Predicting bug-fixing time: an empirical study of commercial software projects,” in 35th International Conference on Software Engineering, ICSE ’13, San Francisco, CA, USA, May 18-26, 2013, 2013, pp. 1042–1051. T. Zimmermann, N. Nagappan, and L. Williams, “Searching for a needle in a haystack: Predicting security vulnerabilities for windows vista,” in Software Testing, Verification and Validation (ICST), 2010 Third International Conference on. IEEE, 2010, pp. 421–428.