Show Me What You Mean! Exploiting Domain Semantics in Ontology Visualization Ravi Pavagada1, Christopher Thomas1, Amit Sheth1, William S. York2 1
Large-scale Distributed Information Systems Laboratory,
Dept. of Computer Science, University of Georgia, Athens, GA, USA 2
Complex Carbohydrate Research,
Dept. of Biochemistry and Molecular Biology, University of Georgia, Athens, GA, USA 1
{pavagada, cthomas, amit}@cs.uga.edu,
[email protected]
ABSTRACT Ontologies build the backbone for many life-sciences applications. These ontologies, however, are represented in XMLbased languages that are meant for machine-consumption and hence are difficult for humans to comprehend. For a meaningful visualization of these ontologies, it is important that the display of entities and relationships captures the cognitive representation of the domain as perceived by the domain experts. In this paper we present OntoVista, an ontology visualization tool that is adaptable to the needs of different domains, especially in the life sciences. While keeping the graph structures as the predominant model, we provide a semantically enhanced graph display that gives users a more intuitive way of interpreting nodes and their relationships. Additionally, OntoVista provides comfortable interfaces for searching, semantic edge filtering and quick-browsing of ontologies. To this end, we extended the Jambalaya plugin for Protégé to allow for customization and integration of different layouts. As a use case, we demonstrate how the ontology-encoding of complex carbohydrate structures is transformed into a standard graphical representation of carbohydrates familiar to biochemists
1
INTRODUCTION
As more and more information is presented to us, we need better ways to organize and visualize it. While most of the information we see is in form of text, audio and video, the underlying structure that connects the different pieces of information can be seen as a network or a graph, which can either be described as physical graph as in the case of different servers that store different nodes of information, or as a conceptual graph which are in the form of hyperlinks, relational tables or more palpable graph formalisms represented in Resource Description Framework or RDF. RDF [8] is a framework for defining metadata (data about data) and is a key component of the Semantic Web. The Semantic web is an extension of the current web and can be seen as network of interconnected information that can be readily processed by machines. The Semantic Web aims at making the web contents machine processable by adding metadata to the current web. This meta-data can be represented in
RDF. RDF can be used to formalize and share knowledge of a domain. RDF is comprised of triples or statements made up of subject, predicate and object. These triples can be visualized as a directed graph where predicate or edges emanate from subjects and incident on objects. The RDF serialization of ontologies is hard to comprehend for a human viewer and thus a good visualization needs to present the information in a way that is easily understandable. Most visualization tools visualize RDF in the form of a graph represented as triples. Visualization of such graphs doesn’t capture the cognitive representation of a domain, as perceived by the domain experts. A visualization tool that helps the user to comprehend the area of interest more quickly should be able to show the connections of the graph that are most useful for the viewer. More than that, it should as much as possible present the information in a “meaningful” manner. The definition of a meaningful display of information varies from domain to domain A symbol that makes sense to e.g. a chemist might be meaningless to a mathematician or even have a different meaning in the field of mathematics. Different groups in the same fields of science might also use different representation. Ontology can be described as specification of conceptualization of a domain. Ontologies represented in RDF are meant to unambiguously formalize knowledge. Visualization however, should convert this description back to the domain-specific view of the knowledge. In analogy to the definition of ontologies in computer science, Semantic Visualization can be defined as a “visualization that provides a shared view of a conceptualization”. Semantic Visualization basically consists of nodes and edges that are labelled, color-coded, assigned different shapes and arranged such that some of the connected nodes are closer to each other than others, indicating that these nodes are semantically closer. It (Our implementation?) also captures extended graph display that allows nesting of sub-graphs with in nodes. This representation suggests some kind of containment relationship between the enclosing node and the enclosed subgraph, which is one of many different ways things can be related. This multitude of relationships however, can be seen as a hierarchy starting with a root relationship that broadly defines a particular type of relationship. The relationship hierarchy is defined by specifying more specific types of relationships, which are subsumed by more general relationships. The most common relationships in an ontology include subclass_of (inheritance), instance_of
(instantiation) and part_of (aggregation), all of which can be conceptually or physically viewed as different types of containment relationships.
Suppose B and A are both classes, and if Class B related to Class A by is_a relationhip, then all things that are described by A will be contained in the set of things that are described by B. Suppose A is a class and a is an instance, thus if a is_intsance_of A, then a is contained in the set that is the extension of that class. Suppose a and b are both instances, thus if b is_part_of a, then b is contained in the aggregate set which defines a.
Other concepts and relationships have conventional symbols that are domain dependent. For example, a chemical reaction is commonly shown as an arrow between the reactant and product involved in the reaction. In an ontology, however, a chemical reaction will require a much more complicated representation that is meaningful to a machine, but not necessarily to the human observer. Thus, a visualization tool should be able to translate this machine-centric representation into a human discernible format. To take a more obvious example, the visualization of a geometry ontology can show entities in simple shapes such as squares, circles, triangles etc. More specifically, in the domain of lifesciences there are standard symbolic representations of entities that are commonly used by domain experts to visualize these entities in a graph. Entities in a chemical ontology describing simple molecules could be visualized showing an abstraction of their molecular structure instead of a simple shape. In this paper we present OntoVista, a semantic visualization tool with unique capabilities related to complex (representationally rich) biological and biochemical ontologies. OntoVista was developed by extending Jambalaya [19], an existing ontology visualization plugin for the Protégé [15] ontology editor. We propose a custom layout which can generate domain specific views that are familiar to domain experts. The information describing how to visualize contents of an ontology does not belong in the ontology itself. Rather, for this purpose we use layout settings provided by the domain experts to display a view that is meaningful to the users. Custom Layout was initially designed to display complex carbohydrates in a way that domain experts are used to; the so-called Cartoonist [4] representation. However, the layout is customizable and can generate domain specific views for any ontology. We have also refined searching and filtering in Jambalaya. Taking advantage of a hierarchical representation of the relationships (i.e. properties and their sub-properties) in the ontology, Semantic Arc Filter was developed to help user to quickly visualize the nodes connected through particular sets of relationships such as partonomy/containment, chemical interaction/ reaction etc. Thus, Semantic Arc Filter allows users to show/hide all partonomy relationships such as part_of and its sub-properties or chemical interaction relationships such as interacts_with and its subproperties at once. We have enhanced the basic search capabilities that are there in Jambalaya by adding advanced searches such as relationship search, description or comment search, domain-range search, triple search and semantic search. Additionally, OntoVista provides a Quick Ontology Browser for easy access of class, subclasses, properties and sub-properties which can be later used in queries while performing searches.
The rest of the paper is organized as follows. Section 2 gives a brief introduction to Jambalaya and GlycO [7] which is a complex bio-chemical ontology. In Section 3, we describe OntoVista’s custom layout, Semantic Arc Filter, Ontology Browser and advanced Searches. Section 4 talks about the related work in the area of ontology visualization. 2
BACKGROUND
2.1. Jambalaya Jambalaya [19] is a protégé plugin, designed for visualization of large complex ontologies. Jambalaya uses SHriMP [14] visualization techniques i.e. nested graph view, combined with pan, zoom and fisheye-view for interactive navigation. It provides various layouts such as Radial Layout, Spring Layout, horizontal Tree Layout and vertical Tree Layout, to meet different user’s preferences. The Query View interface in Jambalaya can display query results in form of a graph. Using Query View, users can search for a specific class or an instance and can display neighbourhood for a specified number of hops. However, the layouts provided by Jambalaya are not customizable and cannot display views that capture the cognitive representations of the domain as perceived by the domain experts. This was the main motivation behind the development of our customizable layout. The search interface in Jambalaya only provides either class or instance search. Users are able to navigate to the selected class or instance after selecting them from the search result. While using Jambalaya extensively for the design of ontologies, we found that the searches provided in Jambalaya are not powerful enough for analysis and navigation of complex ontologies. We found a need for advanced search capabilities such as description search, relationship search, triple search, domain-range search and Semantic search while visualizing complex ontologies such as GlycO [7]. Hence our goal was to design a search interface in OntoVista that implements some of the capabilities of ontologyquery languages such as SPARQL [REF] without requiring the user to learn their rather complex syntax. Jambalaya provides Arc Filter that can be used to filter and un-filter edges from the graph view of the ontology. This Arc Filter however does not take advantage of the property hierarchy. Most ontologies have relationships such as “part_of” which represent partonomy relationships. In Glyco, for example, the property “part_of” has sub-properties like “has_carbohydrate_residue”, “has_glycan_root_residue”, and “has_carbohydrate_moiety”. Thus, we felt the need for a semantic arc filter that can help user visualize such relationships. Most complex and well structured ontologies have property hierarchies that can be exploited for this purpose. 2. 2 GlycO The field of glycobiology deals with the structures, chemistry, biosynthesis, and biological functions of complex carbohydrates, so-called glycans. The structures of glycans are more complicated than those of genes and proteins, which are linear chains composed of nucleotide and amino acid residues, respectively. Moreover, all of the residues in these biopolymers are connected via a single type of linkage. Conversely, glycans have a branched tree structure rather than a linear chain, and the connection between carbohydrate residues shows significant structural heterogeneity, varying, for example, in position and anomeric configuration. Thus, modeling of primary structural
features is considerably more difficult for glycans than for genes and proteins. GlycO is a highly specialized ontology for the glycobiology domain. It contains formalized descriptions of glycan structures, enzyme functions and biosynthetic pathway information. The individual glycans are modelled as collections of monosaccharide residues. The relation between connected residues is called "is_linked_to." This relation has a defined direction, which provides the structure of the glycan model as a directed graph, or more specifically, a tree. All residues which instantiate the relation "is_linked_to" must also instantiate the property "is_linked_via." When residue-A is_linked_to residue-B, the property "is_linked_via" specifies the precise atomic attachment point on residue-B where residue-A attaches, and the property "has_linking_atom" specifies the site on residue-A that is attached to residue-B. Both the local and remote binding sites are indexed using a standard chemical numbering system. Within the configuration property file, this number is called the LinkType and is used by OntoVista to configure the visualization layout of residues in a way that preserves a standard graphical representation format used by glycobiologists to visualize glycans and the residues they contain. Thus, OntoVista is capable of presenting glycans in a format similar to the cartoon representation commonly found within textbooks and current research papers. The ubiquity and usefulness of this representation for glycol-biologists was a key motivator behind the creation of the custom layout in OntoVista. 3
ONTOVISTA
OntoVista is a semantic visualization tool developed by extending the Protégé plugin Jambalaya. The key feature of OntoVista is its ability to display domain specific views familiar to domain experts. A visualization environment needs to provide the ability to display the domain of interest in a meaningful way. The burden of deciding what is meaningful in the domain however is placed on the domain experts. Hence the ontology designers can create layout settings that reflect their conceptualization of the domain. Our custom layout uses the information in the ontology as described by the domain experts along with the settings to generate a view that is meaningful to the user. The view generated is very much dependent on the user configuration settings. The user can also change the settings to generate views that are of user’s interest. Additionally, OntoVista provides Semantic Arc Filtering and advanced searches which are discussed in the later sub sections. 3.1. Custom Layout One of the shortcomings we found in the Jambalaya visualization tool was that the choices of node shapes and colors were limited to meta-properties of the nodes. All types of instances have the same shape and color, the shapes and colors for classes depends on formal properties of the class, not on its possible reference. Layouts in Jambalaya are designed to capture only the graph structure. They place nodes using standard layouts such as Radial Layout, Spring Layout, horizontal Tree Layout and vertical Tree Layout which cannot dynamically position the nodes. In order to create domain specific views, layouts should not only be able to change the shape and color of the nodes, but also be able to adjust the physical locations of nodes based on a conceptual location.
Custom layout creates containers or nested views using the containment relationships such as “part_of” or “has_component”. The layout is then applied to all the instances of the root classes. Root classes are the names of the classes whose instances are to be visualized. Visualization of these instances/nodes will give a domain specific view of the ontology as perceived by domain experts. These nodes may have internal nodes (which they somehow contain) and the layout is applied on the internal nodes. Custom layout is derived from Tree layout. Custom layout lays the internal nodes from right to left starting from the root node. It stops positioning of internal nodes once it reaches the leaf of the tree. The Color and shape of a specific node are determined using the layout settings. The position of each internal node in the layout is based on information in ontology. Each of the internal nodes can be can have positions such as “Left”, “Down”, “Diagonal up” and “Diagonal down” relative to the position of the previous internal node. Custom layout is different from other layouts as it can generate domain specific views based using the position information from the ontology and can set shapes and colors for each of the internal nodes based on the layout settings. Custom layout uses the following layout properties to generate views. 1. Containment relationship layout property is used to specify the relationships upon which layout can cluster to create containers or nested views of nodes. 2. Root class layout property is used to specify the names of the classes whose instances are to be visualized. The layout can only be applied to instances of the classes specified in this property. 3. Class layout property is used when the user wants to visualize a set of instances of a class in a particular shape and color. 4. Class name layout property must be specified for each of the individual class names mentioned in the Class layout property. The desired shape and color of the instances of a particular class must be specified using this layout property. This helps to set specific shape and color for each of the internal nodes of the layout. 5. Link relationship layout property is the relationship in the ontology that specifies the position of the node. This property allows the layout to access the position of the nodes from the ontology. 6. Connection relationship layout property is the relationship in the ontology that connects the internal nodes in the layout. 7. Link type layout property can be used to specify the possible positions of the nodes based on physical linkage sites (e.g, atom 2, 3, 4, or 6). 8. Positions layout property is used to explicitly specify the actual meaning for each of the positions in the link types property. For example, link position value of 4 means that the node is to be placed to the “Left”, link position value of 6 means that the node is to be placed “Diagonally up”, link position value of 3 means that the node is to be placed “Diagonally down”, link position value of 2 means that the node is to placed directly “Below” the previous node.
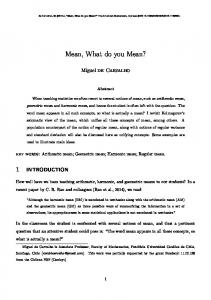
Figure 1 shows an image of a glycan generated using Custom Layout.
Figure 3. shows the image of an Car engine displayed according to the configuration settings.
Figure 2 shows the standard cartoonist representation of the glycan shown in Figure 1.
The car ontology describes some internal components of cars, such as engine, transmission, brakes, headlight etc. We will be using engines of different cars to demonstrate our custom layout. The internal components of the engine are connected to each other by an is_connected_to relationship. A domain specific view of an engine of the car ontology should display various spark plugs in the engine along with other components such as engine block, crank, and piston. Figure 3, shows an image of a Chevy cavalier car engine that comprises of engine block, spark plugs, crank and piston. This is based on the layout settings. The above figure shows the champion plugs in yellow squares and Chevy engine block in green circle. These settings are specified in the layout configuration. 3.2. Semantic Filtering
We will demonstrate the custom layout using GlycO and a car ontology which was specially designed for testing. Initially, we will show how we can generate the cartoonist representation of glycans using the custom layout. The GlycO ontology is initially loaded in OntoVista along with the layout configuration settings. The custom layout then generates images of glycans using the layout settings and link information (connection that exists between the residues) in the GlycO ontology. Depending on the type of residue, the layout can display instances of carbohydrate residues in various shapes such as squares, diamond, circles, or triangles in different colors. The key feature of Custom layout is that it can generate different images for different glycans at runtime as shown in Figure 1. The corresponding cartoonist representation of the glycan is shown in Figure 2.
Relationships in the can be classified in a similar fashion as classes. The semantic arc filter was developed to help users to quickly visualize the nodes connected through particular sets of relationships such as partonomy/containment, chemical interaction/ reaction etc. Semantic Arc Filter can be used to filter or un-filter the properties and their respective sub properties. With few mouse clicks the user can thus change the focus of ontology from parthood relationships to chemical reactions. Without the hierarchical arc filter, this process would require tedious selection of every relationship involved in partonomy and chemical reactions respectively. In Glyco, for example, the property part_of has sub-properties, as described in Section 2.1. By selecting part_of in Semantic Arc Filter, all its sub-properties are also selected. This holds analogously for de-selection of a property. In general selections are recursively applied to the full branch of the tree that has been selected. Additionally, of course, the user can select or deselect individual sub-properties. Each selected OWL property can be of three types, namely schema property, instance property, or restricted properties. Using the
semantic Arc Filter, the user can also visualize specific subproperties and its associated types such as property restriction, schema property and instance property. Figure 3 Semantic Arc Filter
visualize only specific type of property such as restricted, schema or individual/instance. 3.3. Ontology Browser The ontology browser can be used for faster access of the information in the ontology, such as classes, sub- classes, properties, sub proprieties, and instances. Users can select a set of classes, properties, or instances from the Ontology Browser and later use them to create queries while performing searches.
Initially a list of all classes in the ontology will be displayed. Upon selection of a class, Ontology Browser displays all its properties, instances, sub-classes, and super-classes. Users can then see super and sub properties upon selection of a particular property. Users can use Left mouse click for dynamic navigation. Right click in ontology browser brings up a popup. The user can then select the type of selection from the popup menu. Ontology Browser is linked to search interface. Thus, as the user selects the classes, properties, and instances from the Ontology Browser, it’s simultaneously added to the respective list fields in the search interface.
Figure 4. Ontology Browser
Figure 4 shows the property hierarchy of the GlycO ontology using Semantic Arc Filter. As mentioned earlier, GlycO ontology has partonomy relationships such as has_part. Property has_part has sub-properties property, has_integral_property, has_improper_part and has_proper_part,etc. In turn, Property has_integral_property has sub-properties such as has_carbohydrate_moiety, has_non-carbohydrate_moiety, has_carbohydrate_residue etc. Semantic Arc Filter allows users to visualize all partonomy relationships or only the specific ones. Further, Semantic Arc Filter gives flexibility for the users to
Ontology Browser can display classes, sub-classes, super-classes, properties, sub-properties, super-properties and instances of a given ontology. Figure 4, shows the ontological view of the GlycO ontology using OntoVista’s Ontology Browser. 3.4 Searches
OntoVista provides advanced search capabilities such as class search, instance search, relationship search, RDF comment or description search, triple search, domain-range search and semantic search. OntoVista provides pattern based searches based on patterns entered by the user. By default, searches in OntoVista are pattern based searches. This is as far as I got. OntoVista’s search interface is closely linked to its Ontology Browser, which helps in providing an ease of use search interface that does not require users to type in names of classes, instances or properties. That is, the user can select a class, instance or a property from the dropdown list of the respective list field and can use them in queries. OntoVista has a very simple search interface based on the RDF triple model. In RDF, triples are represented by subject, predicate and object. RDF schema has triples of the form domain, property and range. Figure 5 shows the view of the search interface in OntoVista. The search interface is divided into three columns. The first column allows the subject class or instance to be specified; the second column allows the predicate to be specified; the third column allows the object class or instance to be specified. The number of search fields that are filled in by the user depends on the type of search to be performed. For a class search, instance search, description search and relationship search, only one field is filled in, and the classes and instances that match the pattern are returned. For a triple search, domainrange search and semantic search, two fields (one in each column) are filled in by the user, and the search returns the classes, instances and properties, as appropriate, that complete RDF triples containing the two search fields. This search interface was designed for biochemist who had no knowledge of ontology or the query language. Thus, we gave prime importance to ease of use.
that define, restrict or instantiate the relationship. The user can then navigate to the specific class/instance by selecting the class/instance from the search result. An example in GlycO would be to find all glycans and its class types that has relationship “has_carbohydrate_residue”. 3.4.2.
Triple Search and Domain-Range Search
Triples are comprised of subject, predicate and object. Triple search can be used to search for either the subject or object instance, given a subject instance and a property or an object instance and a property. The user can either enter these query terms or select them from the list fields. The results of the triple search are object/subject instances and its respective classes. An example of a triple search in GlycO would be to find all glycan instances that have relationship “has_carbohydrate_residue” with residue instance “N-glycan_b-D-GlcpNAc_14”. The output of a domain-range search is dependent on the input. Given a domain and a property, the search returns the range classes and their respective instances. Similarly while searching for a domain, given a range class and a property, it finds all the possible domain classes and their respective instances. 3.4.3.
Semantic Search
Semantic search can be used for analysis of the ontology. The user enters a subject class or instance and an object class to determine whether some hypothesis about the knowledge in the ontology is true. For example, a user may want to know if the glycans in the GlycO ontology are comprised of residues. Semantic search on the above query would return all the glycans that have some relationship with residues Semantic search can also be used to disambiguate instances and reduce the number of entries in the search result. For example, there could be multiple classifications of instances in the ontology. Ontology might consist of a different people of the same name, for example Michael Jordan. One MJ is an Entrepreneur and the other MJ is a Basketball player. Using semantic search the users can actually find the desired instance. Thus, by specifying the object class “Entrepreneur”, Semantic search will return Michael Jordon who is an Entrepreneur.
Figure 5. Search Interface
3.4.1.
Relationship search and Description search
Descriptions are comments in the RDF or OWL ontology. The user can enter the description text in the search pattern list box. Description search returns all the classes and instances that contain the entered description pattern. The user can also navigate to the specific class/instance by selecting the class/instance from the search result. Relationship searches can be used to when users are interested in finding classes and instances that contain the queried relationship. The users can either enter the relationship in the property list field of the search interface or select a property from the dropdown after adding the properties using the Ontology Browser. Relationship search returns all the classes and instance
4.
RELATED WORK
To date, no literature has been published that directly describes Semantic Visualization. However, many visualization tools/applications that, like OntoVista, can visualize ontology have been described. Ontology visualization tools can be classified based on the techniques they use to visualize ontology. Among them, three most common techniques are ClusterMap technique, nested view techniques as in Jambalaya and graph based visualization. ClusterMap [1] technique groups nodes in to clusters to reduce the visual complexity and focuses on visualizing populated instances and their classification based on concepts in the ontology. It visualizes ontologies through classes and hierarchical relationships, and by grouping instances in clusters. There are many applications developed using the ClusterMap technique.
One such application is Spectacle [21] which displays classes by means of hierarchical relations, while hiding any relations at the instance level. DOPE Browser [10] is another tool that uses the ClusterMap technique for visualization of large document sets. It provides support for thesaurus-based search using Elsevier's EMTREE thesaurus and makes extensive use of Cluster Maps for both visualizing and exploring query results. Ontologies represented in RDF or OWL are often visualized as graphs. Most visualization tools allow users to navigate to different portions of the ontology and provide basic search capabilities such as instance or a class search. Protégé-2000 [15] developed at Stanford University, is a knowledge-modelling tool that helps users to build domain specific knowledge acquisition systems. It allows ontologies and knowledge-bases to be edited and browsed interactively. OntoViz, Jambalaya, TGVizTab, and OWLViz are some of the visualization tools developed as protégé plugins. OntoViz [18] supports visualization of several disconnected graphs at once. The users can select a set of classes or instances to visualize. OntoViz generates graphs that are static and noninteractive which makes it less suitable for the visualization of large ontologies. Searches in OntoViz are restricted to classes. Jambalaya [20], described in section 2.1, is another protégé plugin, designed for visualization of large complex ontologies. OWLViz is designed to be used as a Protege plugin to visualize the schema hierarchy, based only on the subclass relationship. In OWLViz, searches are restricted to classes. TouchGraph (www.touchgraph.com) uses a springembedding algorithm to display the graph. Some users find TouchGraph difficult to use as it keeps re-adjusting the graph to create a layout that is best suitable for display. There are many applications that are built using TouchGraph. TGVizTab [2] is a protégé plugin that uses TouchGraph. It provides incremental graph navigation of ontology. Using TGVizTab, users can search for classes or instances. OI-Modeler [13] is a tool specifically designed for creation and maintenance of ontologies. It uses TouchGraph for graphical display.
[3]
[4]
[5]
[6]
[7] [8]
[9]
[10]
[11]
[12]
[13]
[14]
5. CONCLUSION In this paper we have demonstrated how OntoVista can generate domain specific views familiar to domain experts. We have done this using two ontologies namely GlycO and Car ontology. We have also shown how Ontology Browser in OntoVista can be used to create queries. We demonstrated OntoVista’s Semantic Arc Filter using GlycO ontology. We showed how OntoVista’s Semantic Filtering can be used in visualizing relationships such as partonomy. Finally, we described the searches in OntoVista and explained how these searches can be used in analysis of a complex ontology such as GlycO.
[15]
[16]
[17]
6. ACKNOWLEDGEMENTS [18]
7.
REFERERNCE
[1]
Aduna Cluster Map Library version 2005.1 (Integration Guide), 2005. Alani, H., TGVizTab: An Ontology Visualisation Extension for Protégé. In Proceedings of Knowledge Capture (K-Cap'03), Workshop on Visualization Information in Knowledge Engineering , Sanibel Island, Florida, USA.
[2]
[19]
[20]
Contreras, J., Benjamins, V.R., Prieto, J.A., Patón, D., Losada, S., González, D.: Duontology: an Approach to Semantic Portals based on a Domain and Visualisation Ontology. KTWeb,2003 http://www.drecommerce.com/doc/Benjamins-Duontology-a.pdf David Goldberg, Mark Sutton-Smith, James Paulson, Anne Dell, Automatic annotation of matrix-assisted laser desorption/ionization N-glycan spectra, PROTEOMICS (2005) 5(4): 865-875 David J. Duke, K. W. Brodlie, D. A. Duce. "Building an Ontology of Visualization," vis, p. 7p, 15th IEEE Visualization 2004 (VIS'04), 2004. http://doi.ieeecomputersociety.org/10.1109/VISUAL.2004.10 David J. Duke, Ken W. Brodlie, David A. Duce, Ivan Herman. "Do You See What I Mean?," IEEE Computer Graphics and Applications, vol. 25, no. 3, pp. 6-9, May/June, 2005 http://doi.ieeecomputersociety.org/10.1109/MCG.2005.55 Glyco-Ontology. http://lsdis.cs.uga.edu/Projects/Glycomics. Graham Klyne, Jeremy Carroll: Resource Description Framework (RDF): Concepts and abstract syntax. http://www.w3.org/TR/2004/REC-rdf-concepts-20040210/ (2004) H. Alani, “Tgviztab: An ontology visualisation extension for protege,” in Knowledge Capture 03 - Workshop on Visualizing Information in Knowledge Engineering. Sanibel Island, FL: ACM, 2003. H. Stuckenschmidt, F. van Harmelen, A. de Waard, T. Scerri, R. Bhogal, J. van Buel, I. Crowlesmith, C. Fluit, A. Kampman, J. Broekstra, and E. van Mulligen, "Exploring large document repositories with RDF technology: the DOPE project", Intelligent Systems, IEEE, vol. 19, no. 3, 2004, pp. 34- 40. Harmelen, F. van, Broekstra, J., Fluit, C., Horst, H., Kampman, A., van der Meer, J., Sabou, M.: Ontology-based Information Visualisation. Workshop on Visualisation of the Semantic Web, London, 2001. Ian Horrocks, Peter Patel-Schneider, Frank van Harmelen. From SHIQ and RDF to OWL: The Making of a Web Ontology Language. Journal of Web Semantics, 1(1), 2003. Maedche, A., Motik, B., Stojanovic, L., Studer, R., Volz, R.: An Infrastructure for Searching, Reusing and Evolving Distributed Ontologies. Proc. 12th Int. World Wide Web Conference (WWW'03), Budapest, Hungary, ACM, 439-448, 2003. Margaret-Anne Storey. "SHriMP Views: An Interactive Environment for Exploring Java Programs," Proceedings of the International Conference on Software Engineering: Workshop on Software Visualization, Toronto, 13-14 May 2001 Musen, M.A., Fergerson, R.W., Grosso, W.E., Noy, N.F., Grubezy, M.Y., Gennari, J.H.: Component-based support for building knowledge-acquisition systems. Proc. Intelligent Information Processing (IIP 2000) Conf. Int. Federation for Processing (IFIP), World Computer Congress (WCC'2000), Beijing, China. pp 18-22, 2000. Neil A. Ernst and Margaret-Anne D. Storey. A preliminary analysis of visualization requirements in knowledge engineering tools. Technical report, CHISEL Technical Report, University of Victoria, August 2003. http://www.neilernst.net/docs/pubs/ernst-kcap03.pdf Noy, F.N., Sintek, M., Decker, S., Crubézy, M., Fergerson, R.W., and Musen, M.A. Creating Semantic Web contents with Protégé2000. IEEE Intelligent Systems, 16(2):60–71, 2001. OntoViz, Intelligence, Agents, Multimedia Electronics and Computer Science Dept. University of Southampton, http://www.ecs.soton.ac.uk/~ha/TGVizTab/TGVizTab.htm, 7-62004. Roxborough, T., Sen, A.: Graph Clustering Using Multiway Ratio Cut. Proceedings of Symposium on Graph Drawing (GD'97), Berlin, Germany, LNCS, vol. 1353, Springer-Verlag, pp 291-296, 1997 Storey, M.A., Musen, M., Silva, J., Best, C., Ernst, N., Fergerson, R., Noy, N.: Jambalaya: Interactive visualisation to enhance ontology authoring and knowledge acquisition in Protégé. Workshop on
Interactive Tools for Knowledge Capture, K-CAP-2001, Victoria, B.C. Canada, 2001. [21] Fluit, C., Sabou, M., van Harmelen, F.: Ontology-based Information Visualisation. In Geroimenko, V., ed.: Visualising the Semantic Web. Springer Verlag (2002) [22] Borst 1997 W. N. Borst. Construction of Engineering Ontologies. PhD thesis, University of Twente, Enschede, 1997. Berners-Lee et al 2001 Tim Berners-Lee, James Hendler, Ora Lassila. The Semantic Web. Scientific American 284(5):34-43 (May 2001)