Practical Least-Squares for Computer Graphics, Fred Pighin and J.P. Lewis. 2 .... could not within these notes do justice to all related papers. 1.2 History.
Siggraph 2007 course notes Practical Least-Squares for Computer Graphics Fred Pighin Industrial Light and Magic J.P. Lewis Stanford University
Abstract. The course presents an overview of the least-squares technique and its variants. A wide range of problems in computer graphics can be solved using the leastsquares technique (LS). Many graphics problems can be seen as finding the best set of parameters for a model given some data. For instance, a surface can be determined using data and smoothness penalties, a trajectory can be predicted using previous information, joint angles can be determined from end effector positions, etc. All these problems and many others can be formulated as minimizing the sum of squares of the residuals between some features in the model and the data. Despite this apparent versatility, solving problems in the least-squares sense can produce poor results. This occurs when the nature of the problem error does not match the assumptions of the least-squares method. The course explains these assumptions and show how to circumvent some of them to apply LS to a wider range of problem. The focus of the course is to provide a practical understanding of the techniques. Each technique will be explained using the simple example of fitting a line through data, and then illustrated through its use in one or more computer graphics papers. Prerequisites. The attendee is expected to have had an introductory course to computer graphics and some basic knowledge in linear algebra at the level of OpenGL transforms. Updates and Slides. The latest version of these notes and the associated slides are located at http://graphics.stanford.edu/∼jplewis/lscourse. Please download the version from that directory – it may have fixes and other improvements.
1
Practical Least-Squares for Computer Graphics, Fred Pighin and J.P. Lewis
2
Contents 1 Introduction
5
1.1
Motivation . . . . . . . . . . . . . . . . . . . . . . . . . . . . . . . .
5
1.2
History . . . . . . . . . . . . . . . . . . . . . . . . . . . . . . . . .
5
1.3
Outline . . . . . . . . . . . . . . . . . . . . . . . . . . . . . . . . .
6
1.4
Notations . . . . . . . . . . . . . . . . . . . . . . . . . . . . . . . .
7
2 Ordinary least-squares
8
2.1
Linear regression . . . . . . . . . . . . . . . . . . . . . . . . . . . .
8
2.2
Geometry of ordinary least-squares and the normal equation . . . . .
10
2.3
Ordinary least-squares and system of equations . . . . . . . . . . . .
12
2.4
Examples . . . . . . . . . . . . . . . . . . . . . . . . . . . . . . . .
13
2.4.1
Example: mesh reconstruction and optimization . . . . . . . .
13
2.4.2
Example: computation of harmonic maps . . . . . . . . . . .
14
3 Least-squares and optimality 3.1
16
The Gauss-Markov theorem . . . . . . . . . . . . . . . . . . . . . .
16
3.1.1
Assumptions . . . . . . . . . . . . . . . . . . . . . . . . . .
17
3.1.2
Conclusion . . . . . . . . . . . . . . . . . . . . . . . . . . .
17
3.2
What can go wrong? . . . . . . . . . . . . . . . . . . . . . . . . . .
18
3.3
Other estimators . . . . . . . . . . . . . . . . . . . . . . . . . . . . .
19
3.3.1
Maximum likelihood estimate . . . . . . . . . . . . . . . . .
19
3.3.2
Maximum a posteriori . . . . . . . . . . . . . . . . . . . . .
20
Measuring goodness of fit . . . . . . . . . . . . . . . . . . . . . . . .
21
3.4
4 Least-squares with generalized errors
23
4.1
Weighted least-squares . . . . . . . . . . . . . . . . . . . . . . . . .
23
4.2
Total least-squares . . . . . . . . . . . . . . . . . . . . . . . . . . . .
24
5 Robust least squares
27
Practical Least-Squares for Computer Graphics, Fred Pighin and J.P. Lewis
3
5.1
Redescending estimators . . . . . . . . . . . . . . . . . . . . . . . .
27
5.2
Iteratively reweighted least-squares . . . . . . . . . . . . . . . . . . .
30
5.3
RANSAC . . . . . . . . . . . . . . . . . . . . . . . . . . . . . . . .
31
5.4
Least Median of Squares, Forward Search . . . . . . . . . . . . . . .
32
5.4.1
33
Example: detecting kinematic constraints in motion data . . .
6 Constrained Least Squares 6.1
34
Lagrange Multipliers . . . . . . . . . . . . . . . . . . . . . . . . . .
34
6.1.1
Example: closest point on a sphere. . . . . . . . . . . . . . .
35
6.1.2
Example: inverse kinematics . . . . . . . . . . . . . . . . . .
36
6.1.3
Other Applications . . . . . . . . . . . . . . . . . . . . . . .
38
6.2
Convex Weights . . . . . . . . . . . . . . . . . . . . . . . . . . . . .
38
6.3
Inequality constraints . . . . . . . . . . . . . . . . . . . . . . . . . .
38
6.3.1
39
Example: illuminant estimation . . . . . . . . . . . . . . . .
7 Regularized least-squares 7.1
7.2
7.3
40
Truncated SVD . . . . . . . . . . . . . . . . . . . . . . . . . . . . .
41
7.1.1
Example: skin weights computation from examples . . . . . .
42
Damped least-squares and Tikhonov regularization . . . . . . . . . .
44
7.2.1
Example: inverse kinematics. . . . . . . . . . . . . . . . . .
45
7.2.2
Example: surface correspondences. . . . . . . . . . . . . . .
45
7.2.3
Example: image registration. . . . . . . . . . . . . . . . . . .
46
Quadratic constraints . . . . . . . . . . . . . . . . . . . . . . . . . .
47
8 Non-linear least squares
48
8.1
Characterization and uniqueness of a solution . . . . . . . . . . . . .
48
8.2
Iterative descent algorithms . . . . . . . . . . . . . . . . . . . . . . .
49
8.3
Steepest descent . . . . . . . . . . . . . . . . . . . . . . . . . . . . .
49
8.4
Newton’s method . . . . . . . . . . . . . . . . . . . . . . . . . . . .
50
8.5
Gauss-Newton method . . . . . . . . . . . . . . . . . . . . . . . . .
50
Practical Least-Squares for Computer Graphics, Fred Pighin and J.P. Lewis
8.6
Levenberg-Marquardt . . . . . . . . . . . . . . . . . . . . . . . . . .
4
51
9 Conclusion
53
A The Singular Value Decomposition
57
B Errata
59
Practical Least-Squares for Computer Graphics, Fred Pighin and J.P. Lewis
5
1 Introduction 1.1 Motivation The course presents an overview of the least-squares technique and its variants. A wide range of problems in computer graphics can be solved using the least-squares technique (LS). Many graphics problems can be seen as finding the best set of parameters for a model given some data. For instance, a surface can be determined using data and smoothness penalties, a trajectory can be predicted using previous information, joint angles can be determined from end effector positions, etc. All these problems and many others can be formulated as minimizing the sum of squares of the residuals between some features in the model and the data. Despite this apparent versatility, solving in the least-squares sense sometime produce unwanted or disappointing results. This is often due to a misunderstanding of the assumption underlying LS. These assumptions are stated in the Gauss-Markov theorem. The course will explain these assumptions and show how to circumvent some of them to apply LS to a wider range of problems. For instance, outliers within the data can severely bias a least-squares estimate but robust techniques, such as least-median-ofsquares, can give more reliable results while still minimizing a least-squares criterion. We will show that better results can often be obtained by slightly modifying the error function. We will also discuss the techniques used to minimize these errors and their computational cost. The goal of these notes is to provide a practical understanding of LS techniques. Rather than limiting ourselves to mathematical descriptions, we provide mathematical justifications but also describe their practical domain of application and properties with examples specifically drawn from the computer graphics literature. We will show and justify the choice of technique appropriate for each class of problem. These notes are not meant to be complete or precise presentation of the least-squares techniques. For mathematical references on least-squares technique and linear algebra, we recommend the book by Trefethen and Bau [35] as well as the one by Ake Bj¨orck [2]. Finally, in choosing the papers to illustrate the various techniques, our goal was to touch as many fields as possible (animation, modeling, image processing, etc). We could not within these notes do justice to all related papers.
1.2 History The least-squares method was first invented and developed by three of the foremost mathematicians of the eighteenth and nineteenth centuries: Johann Carl Friedrich Gauss (1777 - 1855), Adrien Marie Legendre (1752 - 1833), and Pierre Simon Laplace (1749 - 1827).
Practical Least-Squares for Computer Graphics, Fred Pighin and J.P. Lewis
6
The technique was first applied to predict the motion of comets. In 1801 an Italian astronomer, Giuseppe Piazzi, discovered an asteroid and tracked its movement for a period of 40 days. A number of scientists attempted to predict its subsequent movement based on this data. Of these, only Gauss’ least-squares based calculation was precise enough to allow another astronomer to re-locate the asteroid later in the year. Gauss’s basic least-squares approach had already been worked out in 1795 at the age of 18. He did not publish the least-squares method until 1809 however, in his book on celestial mechanics. The French Adrien Marie Legendre independently developed the same method in 1805 and published it in 1806. Legendre and Gauss both claimed priority and engaged in a bitter dispute. Neither Gauss nor Legendre gave any proof of the technique, although Gauss did state that least-squares is preferred if errors are distributed “normally” (i.e., with a Gaussian distribution). Laplace first provided a proof in terms of minimizing the expectation of the error in 1812. In 1829 Gauss produced an early version of the Gauss-Markov theorem. The theorem says that the best linear unbiased estimator is the least-squares estimate (this statement will be explained below). In the mid to late 1800’s, Francis Galton used the technique to study the heritability of size. His work laid down the foundation of correlation and regression analysis.
1.3 Outline Following this introduction, we have broken these notes into several sections. In Section 2, we introduce the linear least-squares technique using linear regression. We also discuss the basic algebra and geometry associated with least-squares. In Section 3, we discuss the optimality of ordinary least-squares technique using estimation theory and statistics. Then Sections 4 to 8 describe the variants of the linear least-squares technique. First, in Section 4, we study different ways to adapt ordinary least-squares to more general error distributions. Then, in Section 5, we cover techniques that are robust to samples with large errors (i.e. outliers). Following, we describe several techniques for constraining the solution to some subset. In Section 4, we present various techniques for handling ill-conditioned problems. Finally, we finish this overview by describing some of the most common technique for solving non-linear least-squares problems in Section 8.
Practical Least-Squares for Computer Graphics, Fred Pighin and J.P. Lewis
1.4 Notations In these notes we have used the following notations: ai, j b A f˜ xˆ
scalars vectors matrices approximation of f estimate of x
7
Practical Least-Squares for Computer Graphics, Fred Pighin and J.P. Lewis
8
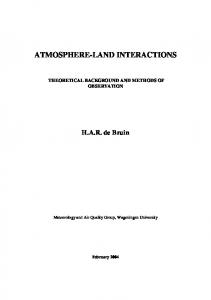
Figure 1: A one-dimensional regression. The observations are displayed as a 2dimensional scatter plot.
2 Ordinary least-squares 2.1 Linear regression There are many ways to justify and explain the concept of the linear least-squares solution. We’ll start from one of the simplest problems, that of one-dimensional line fitting, and later move on to more general situations. The 1-dimensional case. Imagine we are trying to find a relationship between two variables a and b (e.g. the temperature and pressure of a gas). We assume that there exists a linear relationship between the two such that: b = xa. That is to say we would like to predict the value of b given a value of a (perhaps because it is much easier to measure a than b). Since there is a notion of dependency between a and b, a is called the independent variable and b the dependent variable. Also, since the previous relationship might not be exact for all pairs of values, we prefer to write: bˆ = xa, where bˆ (pronounced “b hat”) is the prediction of b given a. It is a prediction in the sense that bˆ is a view of b that depends on the (linear) model “xa” that we defined.
Practical Least-Squares for Computer Graphics, Fred Pighin and J.P. Lewis
9
Now given a set of observations {ai , bi } (e.g. measurements of temperature and pressure of a gas in a lab), we can estimate a linear relationship between the variables a and b. One way to look for this relationship is to require that our linear model matches (as best as possible) the observations. To do this, it seems natural to wish that the discrepancy, or residual, between the model and the data be as small as possible. The questions is then: how do we measure this discrepancy? The least-squares criteria measures the discrepancy by adding the squared residual at each observation, i.e.: n
n
i=1
i=1
e = ∑ (bi − bˆ i )2 = ∑ (bi − xai )2 , where n is the number of observations and bi − xai is the residual for observation i. Thus we are looking for the value of x that minimizes the summed squared residuals, e. This problem is often specified by the minimum of the error function: n
min ∑ (bi − xai )2 , a
i=1
or the value of x that minimizes n
arg min ∑ (bi − xai )2 . x
i=1
Using the following notations: b1 b = ... and a = bn
a1 .. , . an
we can rewrite the error function using linear algebra as: e = (b − xa)t (b − xa) = kb − xak22 , where the subscript 2 refers to the Euclidian or 2-norm kvk2 =
q ∑i v2i .
Figure 1 illustrates the concept of a one-dimensional linear regression. The result of the regression is a line in the a − b plane that goes through the origin. The multi-dimensional case. Let us now imagine the slightly more complicated case where b depends on m independent variables {a j }. In a similar way, we would like to find a linear relationship between b and the {a j } such that: bˆ = x1 a1 + . . . + xm am . or bˆ =
m
∑ x ja j.
j=1
Practical Least-Squares for Computer Graphics, Fred Pighin and J.P. Lewis
10
As previously, if we dispose from set of observations {bi , {ai, j }} we can look for the linear relationship that minimizes the sum of squared residuals: n
n
m
i=1
i=1
j=1
e = ∑ (bi − bˆ i )2 = ∑ (bi − ∑ x j ai, j )2 . We can rewrite this using matrix notation as: m
e = kb − ∑ a j x j k22 = kb − Axk22 . j=1
In the first step we replace the outer sum by the squared norm of the vector b − ∑mj=1 a j x j , where the vector a j has for coordinates ai, j . The second step replaces the inner sum by a matrix multiplication where A is the matrix whose column vectors are {a j }.
2.2 Geometry of ordinary least-squares and the normal equation As discussed in the previous section, we are looking for the least squares solution; in other words we are looking for the value of x that minimizes e(x) = kb − Axk22 . From algebra we recall that a minimum occurs when the first derivative is zero and the second derivative is positive (which is a mathematical way of saying that the function should “look like” a convex bowl at the minima). An analogous statement holds in the multidimensional case, where the first derivative of a function f (x) is the gradient, ∇ f (x), a row vector, and the second derivative, the Hessian, is a matrix that we will denote as H f (x). A simple statement of a multidimensional minimum, at x, is then ∇ f (x) = 0 and H f (x) is positive semidefinite. To discuss this, let us find the second order derivative of the error function: e(x) = kb − Axk22 = (b − Ax)T (b − Ax) = xT AT Ax − xT AT b − bT Ax + bT b. Differentiating1 with respect to x gives ∇e(x) = 2AT Ax − 2AT b. 1 We
here use the matrix differentiation formulas:
d d T T T d p (p q) = d p (q p) = q .
d d p (Mp)
= M,
d d p (pT Mp)
= pT (MT + M), and
Practical Least-Squares for Computer Graphics, Fred Pighin and J.P. Lewis
11
And differentiating once more gives He (x) = 2AT A. Let us examine the second property first. For a matrix M to be positive semi-definite the product xT Mx needs to be non-negative for all x. By construction the product xT AT Ax involving the matrix M = AT A is always non-negative. To see this notice that xT AT Ax = (Ax)2 and this is just kAxk22 , which is a length, which is non-negative by definition. The first condition above yields the equation AT Ax = AT b. This is the normal equation. Much of what can be done at this stage depends on the properties of the matrix AT A. If AT A is invertible (or non-singular) then the normal equation gives a single solution. If however it is not invertible then there is a subspace of solutions. A square matrix is invertible if it has full rank, in other words its column and row vectors form linearly independent systems of vectors. For a square matrix like AT A, we have the following relationships: rank (AT A) = rank (A) ≤ min(n, m). In case of a regression, n is the number of independent variables and m is the number of observations. For AT A to have full rank (i.e. rank (AT A) = n), requires having a number of independent (in the linear sense) observations that is greater or equal than the number of independent variables. This just tells us that we need at least as many observations as there are variables describing the observed system or, from a different perspective, that we need at least as many constraints as there are degrees of freedom in the model. Let us examine these two scenarios in more detail. AT A is non-singular. In this case the least-squares solution is unique and is x = (AT A)−1 AT b (the matrix (AT A)−1 AT is called a pseudo-inverse of A). As we noted before the solution x are the coordinates of b in the column space of A. In the original basis the coordinates of this vector are A(AT A)−1 AT b. The matrix P = A(AT A)−1 AT is important. There are two notable things about this matrix, first it is symmetric (i.e. PT = P), second it is idempotent (i.e. PP = P). In linear algebra idempotent matrices represent projection operators, and when the matrix is also symmetric it represents an orthogonal projection. Given our previous discussion, it is clear that P represents nothing other than the orthogonal projector onto the column space of A. Another way to see this is to notice that the projection Pb (= Ax) is orthogonal to the residual r = b − Pb for all x. Figure 2 illustrates this least-squares geometry. The least-squares projector P decomposes b into two orthogonal vectors Pb and b − Pb.
Practical Least-Squares for Computer Graphics, Fred Pighin and J.P. Lewis
12
Figure 2: The least-squares geometry. The least-squares solution is the coordinates of the projection of b on to the range of A. The residual r = b − Pb is always orthogonal to the projection. A reverse argument can be made to provide a geometric justification for the leastsquares solution. We can start from constraining the residual to be orthogonal to range(A) and end up with the normal equation: ⇔ ⇔ ⇔ ⇔
r orthogonal to range(A) aTi r = 0, for all i AT r = 0 AT (b − Ax) = 0 AT Ax = AT b
AT A is singular. If AT A is singular then there exists a “null space” of vectors z for which AT Az = 0 (also called the kernel of AT A). This means that for a solution x, x + z is also a solution since AT A(x + z) = AT Ax + AT Az = AT Ax = b. We will see later that it is possible to add constraints to in order to get a unique solution.
2.3 Ordinary least-squares and system of equations Solving linear system of equations and the ordinary least-squares method are closely related techniques. It is also important to remember that they are different. Following our notations, a linear system of equations can be represented as: Ax = b, where A (an m × n matrix) and b (an m-dimensional vector) are given and x (an ndimensional vector) is the unknown vector. By writing Ax = b, we specify x as being
Practical Least-Squares for Computer Graphics, Fred Pighin and J.P. Lewis
13
the coordinates of b in the system defined by the column vectors of A. To see this notice that we can rewrite it as: a1,1 . . . a1,m a1,1 a1,m m .. x = .. x + . . . + .. x = Ax = ... a j x j = b, m 1 ∑ . . . an,1
...
an,m
an,1
an,m
j=1
where the ai are the column vectors of the matrix A. Another way to express this is to say that the vector Ax belongs to range(A), where range(A) is the vector space spanned by the colum vectors of the matrix A. In the case where A is square and has full rank then A is invertible and its columns form a basis of ℜm . In this case, the decomposition of b onto the column space of A is unique and is A−1 b. By solving the system, we just performed a change of basis. If however A is not square or singular, we need a criteria to define how b gets decomposed (or projected) onto the column space of A. If we use the least-squares criteria, minx kb − Axk22 , then indeed we are solving a least-squares problem. However, one could use a different criteria (e.g. minx kb − Axk1 ) that would require a different technique.
2.4 Examples 2.4.1 Example: mesh reconstruction and optimization Least-squares problems with quadratic constraint arise in the field of mesh reconstruction (i.e. construction of a mesh from a set of samples) and mesh optimization (i.e. improving a mesh for a better distribution of its vertices). The Least-squares meshes technique [34] reconstructs a mesh based on a sparse set of control points and a given planar mesh. The smoothness of the reconstructed mesh at a vertex vi is enforced by the condition: d i vi =
∑
v j,
(i, j)∈E
where di is the valence of vertex i and E is the set of edges. We can aggregate these conditions using a matrix representation. Let us call x, y, and z the vectors representing the coordinates of all vertices, and define the matrix L = (Li, j ) such that: 1 if i = j − d1i if (i, j) ∈ E Li, j = 0 otherwise.
then the smoothness constraints can be written as:
Lx = 0, Ly = 0, Lz = 0.
Practical Least-Squares for Computer Graphics, Fred Pighin and J.P. Lewis
(a)
14
(b)
Figure 3: Harmonic map computation. The mesh (b) is mapped onto a 2-d patch (b) using a least-squares computation (borrowed from [9] . The control vertices impose another set of constraints on the resulting mesh. If C is the set of indices of the constrained vertices and, for s ∈ C, v′s = (x′s , y′s , z′s ) is the desired position of vertex vs = (xs , ys , zs ) then the the x-coordinate of the vertices solution is: min kLxk2 + ∑ (xs − x′s )2 x s∈C The y and z coordinates are found similarly. The above problem is a linear least-squares problem. It is sparse and its matrix has full rank. The goal of the Laplacian mesh optimization [29] technique is to improve or optimize the quality of a mesh by relocating its vertices. This can be formulated in a way that is very similar to the previous problem. Additional terms can be introduced for instance to limit the motion in directions perpendicular to the mesh. Also sharp features can be preserved by reducing the weight of the Laplacian constraint of high curvature vertices. 2.4.2 Example: computation of harmonic maps The technique of harmonic maps has found applications in computer graphics such as texture-mapping [19], remeshing [9] and surface mapping [38]. It is used to compute mapping between 3-dimensional meshes and 2-dimensional patches. By definition an harmonic map φ : M → N between two manifolds M and N is the minimum of the energy function: E(φ ) =
Z
e(φ )dM,
M
where e(φ ) is the energy density of the map φ at a point. In computer graphics E(φ ) is discretized as: ˜ φ) = 1 E( ∑ ki, j kφ (vi ) − φ (v j )k2, 2 (i, j)∈Edges
Practical Least-Squares for Computer Graphics, Fred Pighin and J.P. Lewis
15
where vi and v j are two vertices on a edge and the {ki, j } are spring constants defined in [9] as: ki, j = (L2i,k1 + L2j,k1 − L2i, j )/Ai, j,k1 + (L2i,k2 + L2j,k2 − L2i, j )/Ai, j,k2 where the symbols L and A are used for edge length and triangle area respectively and ˜ φ ) with (i, j, k1 ) and (i, j, k2 ) are the triangles that share the edge (i, j). Minimizing E( a set of boundary conditions is solved as a linear least-squares problem. Figure 3 illustrates an harmonic map computed with this technique. Note that the open base of the 3-d mesh was mapped onto the boundary of the 2-d polygons and used as constraints.
Practical Least-Squares for Computer Graphics, Fred Pighin and J.P. Lewis
16
3 Least-squares and optimality Generally speaking, the goal of the least-squares technique is to estimate an unknown quantity given some data. In the case of the linear least-squares, it is assumed that the relationship between the unknown and the data is linear and that we measure error/loss by summing the squares of the error for each data point. So, in using least-squares, we are playing the following guessing game: given some data that we could gather, what is the value of the unknown quantity that we want to know? But before starting to guess, it would be useful to know how much we can rely on our guessing procedure. This can be learned from probability and estimation theory. In what follows, we formalize these notions with a theoretical detour to gain an understanding of the properties of the least-squares guess. In the context of estimation theory, the least-squares technique is called an estimaˆ that takes measured/sampled data, b, as input and tor. An estimator is a function, X, ˆ produces an estimate of the parameters, X(b). Estimators are designed to exhibit optimality. Simply put, an estimator is optimal if it extracts all available information in the sampled data. From a probabilistic point of view, both the data and the parameters are random variables. This can reflect two different things. If the problem involves measured data, then it reflects that our knowledge of these quantities is uncertain (e.g. noise in the measurements). However, quite often in computer graphics, the data is known precisely. In such context, the data is not a set of observations but rather a set of constraints that we want to fit our model to. The variance on the data can then be interpreted as how tight we want each constraint to be. In this case, the use of probabilities might seem inappropriate. Without getting into a philosophical discussion, we will take the bayesian stance of using probabilities as coherence constraints on a given assumption (linearity). More specifically for least-squares, we make the assumption that the error at each data point, ei , is a random variable. Recall that: ei = bi − ai,1 x1 − . . . − ai,n xn or equivalently using a matrix notation: E = b − Ax with A = (ai, j ).
3.1 The Gauss-Markov theorem The main properties of the least-squares estimate, XˆLSE , are described in the GaussMarkov theorem. We first state the theorem and then discuss its assumptions and conclusion.
Practical Least-Squares for Computer Graphics, Fred Pighin and J.P. Lewis
17
If {bi }m and {x j }n are two sets of random variables such that ei = bi − ai,1 x1 − . . . − ai,n xn and A1: A2: A3: A4:
{ai, j } are not random variables, E(ei ) = 0, for all i, var(ei ) = σ 2 , for all i, and cov(ei , e j ) = 0, for all i and j,
then the least-squares estimator, XˆLSE (b1 , . . . , bm ) = arg min ∑ e2i , x
i
is the best unbiased linear estimator. 3.1.1 Assumptions Assumption A1 states that the independent variables are deterministic. In particular no error is made while measuring them. Assumption A2, A3, and A4 describe the statistical properties of the errors. Each error has a zero mean (A2) and all the errors have the same variance (A3). Moreover, the errors are assumed uncorrelated (A4) (i.e. there is no linear dependency between any two errors). Hypothesis A2 implies that the linear model is correct up to some unknown parameters since E(E) = E(b − Ax) = 0 3.1.2 Conclusion Let us examine what it means to be the best unbiased linear estimator. Form a trivial point of view it means that the estimator is the best in the category of unbiased linear estimators. Let us examine first what an unbiased estimator is and then how goodness is measured. Unbiased estimators. XˆLSE is linear in the sense that is is a linear function of B. XˆLSE is also unbiased which means that its expected value is equal to the true value of E(XˆLSE (B)) = X. In other words, if we could do multiple experiments, we would notice that the distribution of E(XˆLSE (B)) is centered at the true value of X. This is a good property for an estimator since a biased estimator would seem to make systematic error, but it is not the only criteria. We should not be only concerned about the center of the distribution of the estimator but also about its spread or variance. If the estimator exhibit a lot of variance, it might give the correct answer on average (or in the limit) but provide an arbitrary bad estimate for a given set of observation. Unbiasedness does not
Practical Least-Squares for Computer Graphics, Fred Pighin and J.P. Lewis
18
guarantee that the estimate must be close to the true value of the parameter. In fact, an unbiased estimator can provide arbitrarily bad estimates. [23] presents some sobering examples of unbiased estimators. Comparing estimators. According to the Gauss-Markov estimate XˆLSE is the best unbiased linear estimator. A good estimator is one that is efficient. In term of statistic, for a general (not necessarily unbiased) estimator the comparison is based on the mean squares criteria, E((Xˆ − X)(Xˆ − X)T ). For unbiased estimator, it can be shown that it is equivalent to minimum variance. So to recap, among all the linear estimator of X, XˆLSE (B), is the estimator that has the lowest variance. This variance is equal to: var(XˆLSE ) = σ 2 (AT A)−1 . In other words it means that as a random variable, the estimate is on average equal to its true value and the estimator is one that has the least spread/variance.
3.2 What can go wrong? Each of the assumption in the Gauss-Markov theorem carries the seed . In what follows we examine each assumption in turn. • A1 is in general unrealistic: if we treat dependent variables as random, it does not make much sense to treat independent variables differently. In the case of a linear regression, it means that errors are only taken into account along one of the dimension. • A2 requires that the linear assumption be correct up to some unknown parameters. It is quite possible that the dependency between b and x is actually nonlinear. In this case fitting a linear model could give unexpected results. • A3 requires that the error or the importance of each data sample be the same. This is often not the case for practical applications where the accuracy of the sensor might vary as a function or space and or time, or where • A4 requires that the errors on the data be uncorrelated. This is not always the case. Need an example. To summarize, the three main breaking points of Gauss-Markov theorem and the ordinary least squares technique are the presence of errors in the dependent variables, non-identically distributed samples, and non-linearity. In the rest of this note, we Errors in the dependent variables. The total least-squares technique (section 4) is meant to handle errors in all (dependent and independent) variables.
Practical Least-Squares for Computer Graphics, Fred Pighin and J.P. Lewis
19
Non-identically distributed errors. The case of non-identically distributed errors can be handled in different ways. For small errors, weighted least-squares , total-least squares, and generalized total-squares allow the specification of increasing general data errors (section 4). For large errors, it might be best to leave out some of the data out of the estimation. These data samples are called outliers and the technique are qualified as robust (section 5. Another alternative is to make the model itself robust to errors using regularization (section 7). Regularization penalizes models to prevent overfitting. Non-linearity. If the samples data does not fit a linear model (section 8), using a nonlinear model might be the only sensible approach. A least-squares criteria can always be used to fit the model but the techniques are widely different from the linear case. Although, there are many techniques that can address the shortcomings of ordinary least-squares, they often involve higher computational cost and sometime elusive solutions (e.g. non-linear least squares).
3.3 Other estimators To shine further light on the theoretical roots of the least-squares estimate, we delve deeper in estimation theory to explore two general classes of estimator: the maximum likelihood and the maximum a posteriori. 3.3.1 Maximum likelihood estimate If we assume a particular value for our parameter X, we can measure the probability of observing some data, B, using the probability distribution fB|X 2 . However, the data vector B is the measured value not the parameters X. What we need is to find the probability density for X that is most likely to have produced the data. This inverse problem can be solved by reversing the role of the parameter and the data using the likelihood function, L, defined such that: LX|B = fB|X . It is important to keep in mind that these two functions are defined on different domains. fB|X is defined on the domain of the data (with the parameters fixed) whereas LX|B is defined in the domain of the parameters (with the data fixed). The maximum likelihood estimator is the value of the parameter that maximizes the likelihood function: XˆMLE (b) = max LX|B (x) x
Note also that the identification of the likelihood of the parameters with the probability of the data given the parameters is purely based on intuition and has no formal mathematical basis. In particular the likelihood is a function of the parameter not a probability 2 The sign ”|” denotes a conditional probability. f B|X is the probability density of B given X. Here we are interested in which way the knowing X informs us on B.
Practical Least-Squares for Computer Graphics, Fred Pighin and J.P. Lewis
20
distribution over it. It remains that maximum likelihood estimators are more general than least-squares estimators and have good mathematical properties. Going back to our least-squares topic, we can show that if the errors on the data follow independent and identically distributed gaussian distributions then the least-squares estimate is the maximum likelihood estimate. To briefly derive this result, assume that the error Ei follows: � 2� −ei 1 exp fEi (ei ) = p 2σ 2 σ (2π ) � � −(bi − xai )2 1 exp LX|B (x) = fB|X (b1 , . . . , bn ) = ∏ √ 2σ 2 2πσ 2 i Since log is a non-decreasing function, minimizing log(LX|B ) is the same as minimizing LX|B . −(bi − xai )2 log(LX|B (x)) = ∑ + const. 2σ 2 i This last equations shows that maximizing the likelihood is equivalent to minimizing the sum of squares ∑i (bi − xai )2 . Note that requiring that the errors follow the same gaussian distribution, N(0, σ 2 ), is stronger requirement than assumptions A2-4. We can extend this result to the case where the errors follow different gaussian distributions. With, Ei , following N(0, σi ), the MLE estimate is the minimum of :
∑ i
(bi − xai )2 σi2
This is a weighted least-squares problem where the weights are the inverse of the variance of the errors. A similar approach can be taken for arbitrary error distributions. However, depending on the distribution, the maximum likelihood estimate might not exist nor be unique. 3.3.2 Maximum a posteriori Using the maximum likelihood estimate, we do not make any assumption on the parameter X. If we do know something about the distribution of X, we cannot take advantage of it. The maximum a posteriori (or MAP) criteria addresses this shortcoming by treating X as a random variable. In this case, we have two sources of information for our parameter, a prior distribution, gB , that tells us what are the likely values of the parameters before considering any data, and, fB|X , that tells us the probabilty if the data given the parameters. Following Bayes rule, we can derive a posterior density for the parameter: fB|X (x)gX (x) Pr(b)
Practical Least-Squares for Computer Graphics, Fred Pighin and J.P. Lewis
21
The maximum a posterior estimate is then defined as the value of the parameter that maximizes the posterior distribution: XˆMAP (b) = max x
fB|X (x)gX (x) = max fB|X (x)gX (x) x Pr(b)
The denominator of the posterior distribution does not depend on X and therefore plays no role in the optimization. Observe that the MAP estimate of X coincides with the ML estimate when the prior gX is uniform (that is, a constant function).
3.4 Measuring goodness of fit After fitting a linear model to some sample data, one might wonder how well one did. Goodness of fit can be measured by the sum of squared residuals. Unfortunately this metric is not invariant with respect to the measurement units used to describe the data and as such is not good for model comparison. What we really need is a relative measure for evaluating the fit. To begin recall that the geometry of least-squares guarantee that the residual and the solution are orthogonal: xˆ T r = 0, from which we derive bT b = (Aˆx)T Aˆx + rT r + 2ˆxT r = (Aˆx)T Aˆx + rT r This equation can be used to define the coefficient of determination R2 =
rT r (Aˆx)T Aˆx = 1 − bT b bT b
In other words, R2 is the proportion of the squares variations in the data that can be explained by the regression hyperplane. Clearly, R2 ∈ [0, 1] and the large R2 is the better the fit. Geometrically, R2 is the square of the cosine between the two vectors b and Aˆx. One of the issue with the R2 is that it is sensitive to the addition of a constant. The Centered R2 removes this sensitivity: Centered R2 = 1 − where V¯B = ∑ni=1 bi .
rT r 2 bT b − nb¯
The two criteria presented so far suffer from yet another problem, they are both nondecreasing function of the number of parameters. This means that using these criteria a more complex model would be prefered. The criteria R¯ 2 corrects this problem: R¯ 2 = 1 −
rr r/(n − m) m−1 (1 − R2) = R2 − 2 T n−m (b b − mb¯ )/(n − 1)
Practical Least-Squares for Computer Graphics, Fred Pighin and J.P. Lewis
22
R¯ 2 is the Centered R2 with a penalty term that depends on model complexity. As m, the number of parameters (i.e. complexity of the model) increases, the scalar m−1 n−m increases but 1 − R2 decreases. Thus, R¯ 2 need not be increasing with the number of parameters.
Practical Least-Squares for Computer Graphics, Fred Pighin and J.P. Lewis
23
4 Least-squares with generalized errors As we have reviewed in the previous section, the Gauss-Markov theorem under rather strict hypothesis: the error on the data samples have to be centered, have the same variance, and be uncorrelated. This section presents how to adapt the ordinary least squares algorithm when the errors follow more complex distributions. Although these methods are more general than ordinary least-squares, keep in mind that they require that the error distribution is known. If we have no knowledge of these distributions, the best guess is the least-squares estimate. Much of the remainder of these course notes covers methods for dealing with alternate error distributions.
4.1 Weighted least-squares The weighted least-squares method extend the least-squares procedure to the case where the data samples have different variance. In other words some samples have more error or less influence than others. Assuming that var(ei ) = σi2 , if this is assumption is the only departure from the Gauss-Markov theorem assumption the best linear unbiased estimate for the parameters is: n
argmin ∑ x i=1
(bi − ∑mj=1 x j ai, j )2
σi2
.
If we call W = Var(e)−1 = diag( σ12 , . . . , σ12 ), we can rewrite the previous formula in matrix form as
1
n
arg min(W(b − Ax))T (W(b − Ax)), x from which we can derive the modified normal equation: AT W T WAx = AT W T Wb, and the weighted least-squares estimate: xˆ W LSE = (AT W T WA)−1 AT W T Wb. One of the difficulties with the previous method is to estimate the variance in the errors. We can use the sample variance using repeated measurements. However if the data is deterministic, this is irrelevant. Still even in this case, we might want to weight the different samples. The weights can be chosen arbitrarily to reflect the importance of each sample. For instance, we could weight the sample according to a sampling density to counter-act the effect of sample clusters. Another technique is to use the square residuals as weights.
Practical Least-Squares for Computer Graphics, Fred Pighin and J.P. Lewis
24
4.2 Total least-squares Line fitting For 1D lines one typically uses the one-dimensional y=f(x) parameterization. Fitting a line using this representation is easy, but it only works well when the line slope is shallow (Figure 4). When the slope is steep the error used in the fit is not between the data point and the closest point on the line (as would be desired), rather it is between the data point and and the point on the line that is vertically above or below it. In total least squares the fit is measured as the sum squared distance between the data and their closest points on the line. This approach generalizes to fitting hyperplanes. Total least squares is one example where an initial least squares formulation of the problem results in an eigenvalue problem rather than the usual linear system. The standard line representation is y = ax + c. Rewrite this as 1 · y − a · x = c, or (1, −a)T (y, x) = c; call this aT x = c (a hyperplane). Now minimize the squared distances from the points xk to the line min ∑(c − aT xk )2 subject to kak = 1. aT x − c is the distance to the line (aT x + c might look more familiar, it would be the distance if we had used the hyperplane equation aT x + c = 0.) Note that a and c can be scaled without changing the plane, so scale so that the normal vector a has length 1 to eliminate this freedom.
argmina,c
calling d =0 da d =0 dc substitute c
∑(c − aT xk )2 + λ (aT a − 1) = ∑ aT xk xTk a − 2 ∑ caT xk + ∑ c2 + λ (aT a − 1) = aT (∑ xk xTk )a − 2caT ∑ xk + ∑ c2 + λ (aT a − 1) X ≡ ∑ xk xTk and xˆ ≡ ∑ xk then = aT Xa − 2caT xˆ + Nc2 + λ (aT a − 1) = 2Xa − 2cˆx + 2λ a = 2aT xˆ + 2Nc = 0 ⇒ c = aT xˆ /N 2Xa − 2(aT xˆ )ˆx/N + 2λ a = 0
= Xa − xˆ (aT xˆ )/N + λ a = 0 = Xa − xˆ (ˆxT a)/N + λ a = 0
Practical Least-Squares for Computer Graphics, Fred Pighin and J.P. Lewis
= (X −
25
1 T xˆ xˆ )a + λ a = 0 N
which is an eigenvalue problem, and the minimum eigenvalue minimizes the original problem, with the corresponding eigenvector being the desired coefficient (normal) vector a. Total least squares are more commonly used in computer vision than computer graphics, but they are mentioned for example in [1] (which in turn references M. Pauly’s 2003 thesis).
Practical Least-Squares for Computer Graphics, Fred Pighin and J.P. Lewis
26
Figure 4: Fitting a y = ax line by minimizing the squared errors between y and ax makes sense when the line slope is shallow (top), but not when the slope is large (bottom left). In both cases it is preferable to minimize the actual distance between the points and the line (bottom right) rather than measuring only the y component of the error. This is accomplished by total least squares.
Practical Least-Squares for Computer Graphics, Fred Pighin and J.P. Lewis
27
Figure 5: A high kurtosis density (heavy line) has both more data close to the mean, and more outliers, than a Gaussian distribution (light line).
5 Robust least squares As described earlier in this course, least squares assumes that the errors in the data have a Gaussian distribution. This is the case, sometimes. For example, the sum of a number of separate error terms, regardless of their individual distributions, rapidly approaches a Gaussian. The Gaussian assumption is incorrect in many other cases. These distributions can be divided according to their kurtosis. Figure 5 illustrates this concept. A higher kurtosis density (heavy line) has both more data close to the mean, and more outliers, than a Gaussian distribution of identical variance. The distribution of differences between adjacent image pixels is one example of a high kurtosis distribution: most differences are small, but there are a significant number of large differences at occlusions. The least squares estimate can be degraded arbitrarily by even a single outlying point (Figure. 6). Intuitively, note that because least squares is minimizing the sum of the squared error, the largest errors dominate the result. Noise from a heavy tailed distribution can thus be expected to cause degraded fits if Gaussian noise is assumed, because there are more outliers than would be expected under the Gaussian distribution. Robust methods address this problem, in essence, by attempting to identify and ignore or de-weight these outlying points.
5.1 Redescending estimators In the standard least squares approach, the square of the error is (obviously) what is being minimized. One class of robust estimators replace the error function with something other than the square. First, consider estimating the mean of some data using least squares: The mean estimate is 1 ¯2 arg min (∑ xk − x) x¯ N
Practical Least-Squares for Computer Graphics, Fred Pighin and J.P. Lewis
28
Figure 6: Even a single outlying point (red point) can destroy a least squares estimate.
Practical Least-Squares for Computer Graphics, Fred Pighin and J.P. Lewis
29
1
0.9
0.8
0.7
0.6
0.5
0.4
0.3
0.2
0.1
0 −1
−0.8
−0.6
−0.4
−0.2
0
0.2
0.4
� Figure 7: The redescending estimator function log 1 + 21
dard quadratic error
y = x2
(blue).
0.6
� � x 2
σ
0.8
1
(red) versus the stan-
The x¯ that minimizes this is found by setting the derivative to zero, 2 ( xk − x) ¯ =0 N ∑ From this, it can be seen that any single xk linearly effects the estimate. Next, consider using the first power (the absolute value) rather than the square: The mean estimate is 1 arg min | ∑ xk − x| ¯1 x¯ N Here, after taking the derivative, any particular xk only affects the estimate by a constant amount. Redescending estimators take this one step further. In these functions, the derivative goes to zero with increasing error (although the error itself continues to rise). Thus, large errors are completely ignored. An example of such an estimator, discussed in [3] (see Figure 7), is � � 1 � x �2 log 1 + 2 σ with derivative
2x 2 σ 2 + x2
Practical Least-Squares for Computer Graphics, Fred Pighin and J.P. Lewis
30
Figure 8: A simple approach to robust least squares fitting is to first do an ordinary least squares fit, then identify the k data points with the largest residuals, omit these, perform the fit on the remaining data.
5.2 Iteratively reweighted least-squares In concept the goal of robust least squares fitting is to identify outlying points and discard them. One simple way to approach this is to first fit the data using ordinary least squares, then identify the k points with the largest residuals, discard these, and fit the remaining data (Figure 8. This approach has been called trimmed least squares. A drawback of this approach is that it requires manual tuning of the number of expected outliers, k. It also assumes that the data can be neatly divided into good data and outliers – which may or may not be the case. Iteratively Reweighted Least Squares (IRLS) addresses this by minimizing kb − Axk p where kk p is the “l p ” norm, i.e., kxk p =
�1/p
∑ xkp )
The usual least squares minimizes kk p for p = 2. As noted above, minimizing the squared errors causes the largest errors to be fit at the expense of disregarding small errors. This is the wrong approach. if the largest errors are due to outliers. Reducing p reduces this emphasis of the largest errors; with p = 1 all errors are treated equally (so the sum of the absolute values of the errors is what is minimized). The key to doing this is to note that an error |e| p can be restated as |e| p = |e| p−2 e2 Then, interpret the |e| p−2 factor as a weight, and minimize e2 using weighted least squares.
Practical Least-Squares for Computer Graphics, Fred Pighin and J.P. Lewis
31
The residuals ek are not known of course. IRLS approaches this by an iterative scheme in which the residuals are found from a fit using the existing weights, and these residuals then form the weights for the next iteration: W=I iterate for i = 1 . . . ei = W(b − Axi )
W = diag(|ei | p−2 /2) solve xk+1 = argminkW(b − Axk )k2
Note that the division by two in eip−2 /2 is because in solving kW(b − Axk )k2 the weights W are squared. This algorithm converges for 1 < p < 3, although it requires many iterations as p approaches 1. IRLS is used in [25] in a texture synthesis context order to robustly compare pixel values between corresponding regions of the reference texture and the texture being synthesized.
5.3 RANSAC RANSAC [12] is a simple and general procedure for fitting models to data that has clearly separated outliers. The acronym stands for RANdom SAmple Consensus. Although RANSAC itself is not directly connected to least squares, it forms the bases for procedures such as Least Median of Squares (described below). The starting point for RANSAC is the idea that it is possible to select a smaller subset of k samples from the N data points that contains no outliers. Of course there is no automatic way to know which data points are outliers – if this were not the case, this information could be used to just remove the outliers from the data. Instead RANSAC iterates the following steps: 1. randomly select k points 2. fit the model to these points 3. evaluate the quality of this fit on the remaining points The subset that has the best fit the remaining data is retained – it is assumed that this subset contains no outliers. Finally, the model is re-fit to all the data that are “sufficiently close” to the model initially fit from the k points. Instead RANSAC repeatedly makes a random selection of the k points, fits the model to these data, and then evaluates the fit on the remaining data. The subset that has
Practical Least-Squares for Computer Graphics, Fred Pighin and J.P. Lewis
32
the best fit the remaining data is retained – it is assumed that this subset contains no outliers. Finally, the model is re-fit to all the data that are “sufficiently close” to the model initially fit from the k points. The previous paragraph describes the general RANSAC strategy. To give a more specific example, consider the case of fitting a line to data with 50% outliers. In this case, in choosing a single point, there is a 50% chance of choosing a “good” point rather than an outlier. A single point is not sufficient to fit a line, so instead pick k = 2. There is a 25% chance of selecting a subset of 2 points that contains no outliers. A line is fit to each of a number of randomly chosen subsets of two points. If the subset contains two good points, then it will be the case that the resulting line lies close to all the remaining good data, whereas if the subset contains one or two outliers, then very few other points will like close to the line. Thus, the RANSAC fitting procedure can easily identify a set of good data. If a sufficient number of subsets are evaluated, one of them will contain good data with high probability – see a description of RANSAC for more details [14] (or you can easily work out the probabilities).
5.4 Least Median of Squares, Forward Search Least Median of Squares (sometimes abbreviated LMedS) is a RANSAC-like scheme in which the median error is used to evaluate RANSAC step 3, the fit of the remaining points to the model. The median is a well known example of a robust estimator: it can produce a reasonable estimate in data corrupted by nearly 50% outliers. For example, consider the following data, 0.3 0.2 99 99 0.5 0.8 99
Here the valid values are 0.3, 0.2, etc., and 99 is an outlier. The sorted set of values is 0.2 0.3 0.5 0.8 99 99 99
and the median value is 0.8 – which is clearly not representative of the mean value of the inlying data, but at least it is an inlying data sample. In the robust statistics terminology, the median is said to have a breakdown point of 50%. The breakdown point is the maximum percentage of data points to which an arbitrarily large error can be added without causing the estimator to change arbitrarily. Figure 9 shows an example of data fit with LMedS and ordinary least squares. Forward Search is another variation on these ideas. In this procedure, a subset of inlying points is first identified (e.g., using RANSAC, or perhaps manually), and then this set is grown by iterating the following steps: 1. add the data point with the lowest residual to the currently fit model
Practical Least-Squares for Computer Graphics, Fred Pighin and J.P. Lewis
33
Figure 9: Successful application of Least Median of Squares fitting: The LMedS line (blue) lies close to the model line (black) from which the inliers were generated. The ordinary least squares fit (red line) is influenced by the two outliers. 2. re-fit the model to the new set of points. The iteration is terminated when the lowest residual is larger than some threshold reflecting an outlier. Forward search is used to achieve surface fitting to noisy data, while avoiding smoothing of edges, in a Siggraph 2005 paper [13]. In this paper, Fleishman et al. realized that points on the other side of a crease can be regarded as outliers. They are thus able to apply forward search to grow the set of points up to but not across creases, thus producing smoothed but crease-preserving models from noisy scan data. 5.4.1 Example: detecting kinematic constraints in motion data Robustness issues often arise when processing recorded data like motion capture data. In [6] full-body motion capture data is analyzed to detect kinematic constraints such as foot plant contacts. For a given joint, the technique assumes that between frames i and i + 1 a rigid motion Di occurred. Instantaneous constraints are defined as the set of points remaining stationary under a transformation Di . With Di = (Ri |ti ), a point p is stationary if and only if: (R − I)p = −t. Note that the previous equation has a solution only if the translation t does not have a component along the axis of r. The existence of stationary points can be hidden by noise in the data. A test can be designed using the residual k(R − I)p − tk (to determine the existence of a solution) and the singular values of R − I (to determine the number of dimensions of the constraint). Both tests must be robust to noisy data to avoid selecting incorrect frames. “Inlier” frames are detected using a least-median of squares approach.
Practical Least-Squares for Computer Graphics, Fred Pighin and J.P. Lewis
34
6 Constrained Least Squares 6.1 Lagrange Multipliers Lagrange multipliers are a general approach to adding equality constraints for many types of equations, not just linear systems formulated using least squares. Lagrange multipliers have been used to add constraints to linear systems to solve problems such as inverse kinematics, camera control, and constraint problems in physical simulation. We will describe an inverse kinematics solution below. A example of an equality constraint is: find the minimum value of x2 + y2 subject to x being constrained to the equality x = 1. In this simple case Lagrange multipliers are not needed – the solution can be found by substituting the value of x for the variable in the equation, resulting in an equation in the one variable y whose solution is easy. This approach might be termed “substitute and simplify”. Lagrange multipliers are helpful in more complicated situations where the “substitute and simplify” approach cannot be easily applied. In the case of linear systems, the Lagrange multiplier approach often leads to a block matrix system, which we will see below. First, let’s work through a Lagrange multiplier example for a non-matrix case: find the maximum value of f (x, y) = x subject to x, y lying on the unit circle, i.e., x2 + y2 = 1. This function is a linear “ramp” increasing in the x direction, and the point of maximum x on the unit circle will clearly turn out to be x = 1, y = 0. The steps involved in using Lagrange multipliers are: 1. Identify the constraint, x2 + y2 = 1 in this case. 2. Reformulate the constraint as “something = 0”. In the example, x2 + y2 = 1 becomes x2 + y2 − 1 = 0. 3. Multiply the “something” by λ . So λ (x2 + y2 − 1). 4. Add this to the original equation. In the example, x + λ (x2 + y2 − 1) 5. Lastly, try to find the maximum or minimum of this new equation by the standard calculus approach of setting the derivative with respect to the variables to zero, and solving. The λ is one of these variables. � d � x + λ (x2 + y2 − 1) = dx
1 + 2λ x = 0
Practical Least-Squares for Computer Graphics, Fred Pighin and J.P. Lewis � d � x + λ (x2 + y2 − 1) = dy � d � x + λ (x2 + y2 − 1) = dλ
35
2λ y = 0 (x2 + y2 − 1) = 0
If possible, solve for λ and substitute into the other equation(s). In this case, from the first equation, solve for λ = −1/2x. Then substitute this into the second equation, obtaining y/x = 0. Considering this and the third equation then, the solution is evidently x = 1, y = 0. This technique might seem a bit weird at first – what is this new variable “λ ”? Because of this it may be easiest to first practice using it and see that it works, and then work on the intuition behind it. The intuition behind it is not that hard, either. Consider minimizing f (x, y) constrained by g(x, y) = 0. The proposed solution can only move perpendicular to the gradient of g, otherwise it is violating the constraint. A minimum along the path g(x, y) = 0 is found at a place where moving along g locally will not change f . This means that the gradient of f is locally parallel to the gradient of g, and so is a linear multiple of it, which is expressed by the Lagrange multiplier setup ∇ f (x, y) + λ ∇g(x, y) = 0 6.1.1 Example: closest point on a sphere. As a slightly more relevant example, let’s take the problem of finding the point on a sphere that is closest to a given point. We could imagine this sort of problem coming up in a graphics context (though of course the solution to this particular problem can be seen immediately without going through the math). The sphere will be at the origin and unit size for simplicity, though the technique works the same for an arbitrary placement and size. The constraint that a point p is on a unit-sized sphere can be written pT p = 1. The point p on the unit sphere that is closest to a given point q can then be written using a Lagrange multiplier as (p − q)T (p − q) + λ (pT p − 1) or pT p − 2pT q + qT q + λ (pT p − 1) Now, first take the derivative with respect to p and set to zero, and then solve for p: d = 2p − 2q + 2λ p = 0 dp p(1 + λ ) = q 1 p= q 1+λ
Practical Least-Squares for Computer Graphics, Fred Pighin and J.P. Lewis
36
Next take the derivative with respect to λ , recovering the constraint equation pT p = 1, and substitute this expression for p into this: qT q =1 (1 + λ )2 p qT q = 1 + λ p λ = qT q − 1 Lastly, substitute this expression for λ back into the expression for p: q 1 q= p= p T kqk q q
In other words, the solution is to just take the vector to q and normalize its length (as we already knew in this case). 6.1.2 Example: inverse kinematics We will use inverse kinematics as an example of using the Lagrange multiplier technique in a least squares and graphics context. Define p as the 2d position of an end-effector, controlled by the mouse. Define q as a “state” vector, such as the vector of n joint angles of a limb. Then p is a nonlinear function of q, p = f (q) In inverse kinematics, we want to find q given a new position of p. This is usually underconstrained since the number n of joint angles (usually 3 for each joint) is greater than the number of known values – the two (x,y) components of the mouse location. The problem is also complicated because f () is nonlinear. In several papers Gleicher and Witkin used the idea of solving this by first locally linearizing by taking the derivative with respect to time [15, 16]: dp d f dq = dt dq dt Let’s denote J ≡ ddqf , so
p˙ = Jq˙
where p˙ denotes the derivative of the mouse position (or end effector) with respect to time, and similarly for q˙ . Now the system is linear, but still underconstrained – the mouse has two degrees of freedom, but the skeleton typically has more. This can be fixed by adding an additional
Practical Least-Squares for Computer Graphics, Fred Pighin and J.P. Lewis
37
goal. Gleicher suggested that the change in state be as small as possible, thus the squared difference of the change in each joint angle from zero n
k˙qk2 = ∑(˙qi − 0)2 i
is minimized. Minimizing this alone would result in no movement to the limb, so instead constrain it so that the result of the joint angle change, Jq˙ , matches the change in the mouse position / end effector, p˙ . Combining these gives the goal 1 argmin q˙ T q˙ + λ (˙p − J˙q) q 2 (The 12 is included to cancel the factor 2 that always appears when taking the derivative.) Taking the derivatives with respect to all the variables q˙ , λ , d ˙ dq
= 0 = q˙ − JT λ
d dλ
= 0 = p˙ − JT q˙
As mentioned earlier, simultaneous linear equations such as these can sometimes be solved by first solving for one unknown such as the λ and substituting the resulting expression into the other equation(s), as was done in the previous example in this section. However, a numerical solution is also possible and does not require any further algebra. The numerical solution uses a block matrix form, � �� � � � J 0 p˙ q˙ = 0 λ I −JT where (because this is a block matrix system) the variables themselves represent vector/matrix quantities rather than individual numbers (“scalars”). In our example, p˙ is a 2 × 1 column vector, q˙ is a n × 1 vector, J is the 2 × n matrix of derivatives, I is an n × n identity matrix, and 0 denotes a zero vector of length n. Schematically, the dimensions are � �� � � � 2×n 2×1 n×1 2×1 = n×n n×2 2×1 n×1 A correct block matrix system can be symbolically manipulated as if the individual components were ordinary scalars. You should try multiplying out the left hand side of the block matrix equation above to see that it does represent the original pair of equations.
Practical Least-Squares for Computer Graphics, Fred Pighin and J.P. Lewis
38
6.1.3 Other Applications
6.2 Convex Weights In applications such as skinning and blendshapes it is desirable that the weights (for example the skinning weights on the various joints) sum to one. With this constraint, the weights are no longer independent degrees of freedom. One approach to this problem would be to remove one degree of freedom. In a skinning paper in Siggraph 2005, James and Twigg [24] took the alternate approach of explicitly adding the sum-to-one constraint to the system: � � � � A b [x] = 1...1 1 (Some other techniques in this paper are discussed in Section 7).
6.3 Inequality constraints It is also often desirable that weights (such as blendshape weights) be non-negative, in addition to summing to one. Although the set of blendshape bases will be designed with this in mind, negative weights can arise, for example, when attempting to fit marker motion that lies outside the range of the blendshapes (this may result from either noise in the marker motion, or from positions that are simply not part of the range of motion achievable using the blendshapes). Chuang and Bregler discussed this problem in [8]. Unfortunately achieving inequality constraints such as non-negative weights cannot be achieved with standard matrix tools such as the SVD. We will mention the type of routine needed in this section. The constraint of non-negative weights can be accomplished using non-negative least squares (nnls). A routine for this purpose was described in [26], and C code is available on the web (search for nnls.c). This routine was used in [24] to find non-negative vertex-joint weights for skinning. Quadratic programming solves least squares problems subject to both general inequality constraints Cx ≤ d and equality constraints Ex = f There are quite a few C/C++ quadratic programming libraries available on the web, and Matlab’s optimization toolbox has includes QP. In Bregler et al. ’s cartoon capture paper [4] quadratic programming was used to simultaneously cause weights to sum to one and to lie in the range [−0.5, 1.5].
Practical Least-Squares for Computer Graphics, Fred Pighin and J.P. Lewis
39
6.3.1 Example: illuminant estimation The problem of illuminant estimation can be described as estimating the light from an image of a scene. The gamut mapping solution of this problem consists in determining a set of mappings that take the image data onto a gamut of reference colors under a known light. Gamut Constrained illuminant estimation [11] is a variant that allows the use of a set of plausible lights. This is solved as a classification problem where each plausible light is represented by its gamut and is tested again the image data. For a given light, the fit is evaluated for each color sample by measuring how far it is from the illuminant’s gamut. Let’s call bk a color sample, ai, j a color of gamut Gi , and CH(Gi ) the convex hull of Gi . The error for sample bk is ei (bk ) = kbk − ∑ x j ai, j k2. ai, j ∈CH(Gi ) Solving for min ∑ eik , with x j ≥ 0 for all j {x j } k
gives a measure of fit between the data and the ith illuminant. Since, this measures how well the image samples fit within the gamut, the unknown weights, {x j }, are constrained to be non-negative.
Practical Least-Squares for Computer Graphics, Fred Pighin and J.P. Lewis
40
7 Regularized least-squares Numerical techniques such as least-squares can be adversely affected by ill-conditioning. Ill-conditioning manifests itself by an acute sensitivity to the data – a slight perturbation in the data can produce a widely different solution to the problem. Ill-conditioning is usually bad news since it is not possible to completely avoid noise or numerical imprecision. Regularization refers to a set of techniques whose goal is to improve conditioning. For a linear-least squares problem, Ax = b, ill-conditioning (and inversely conditioning) can be measured using the condition number, κ (A), of the matrix A. κ (A) is computed using: σmax , κ (A) = σmin where σmax and σmin are respectively the largest and smallest singular value of A. If κ (A) is large (e.g. κ (A) ≫ 1) then the problem is ill-conditioned. Considering the SVD a linear system Ax = b can show how poor conditioning can result in large changes to the solution when the problem changes only slightly. The SVD representation is UDV T x = b (see appendix A). First pre-multiply the system by UT , obtaining DV T x = UT b, and then define some new variables y ≡ V T x and c ≡ UT b. This gives the related system Dy = c. Here y is not the original solution, but it has the same norm as the original solution because multiplication by the orthogonal matrix V T does not change the norm. If the last singular value is a small value like 0.0001, the last row of this related system will look like 0.0001d1 = c1 so a change c1 → c1 + ε in the last element of c will result in the last element of the solution, d1 , changing by an amount 10000ε . The actual solution x is obtained from c by application of the orthogonal matrix V, so this large change is distributed unpredictably among all the elements of the solution. Example of ill-conditioned problem. Scattered data interpolation is a popular technique in computer graphics. Its goal is to approximate a smooth function given a limited set of (scattered) samples. For instance, in [7] and [36], it is used to model implicit surfaces from sample points. In [30] and [32], it is used for interpolating a sparse displacement field to animate or deform a facial model. In all these examples, we are given a set of 3-dimensional point or data sites {pi } and at each of these points, we know the values, {f (pi )}, of a function f we are trying to approximate. Using radial basis functions we can compute an approximation, f˜ , such that: n f˜ (p) = ∑ λi φ (kp − pi k), i=1
where φ is a kernel function (for instance the thin-plate or biharmonic kernel φ (p) = kpk2 log(kpk)) (in the 2D case) and the λi are a set of weight vectors (they have as
Practical Least-Squares for Computer Graphics, Fred Pighin and J.P. Lewis
41
many dimensions as the function f ). The weights can be estimated by solving the least-squares problem: n
n
n
min ∑ kf (p j ) − f˜ (p j )k2 = min ∑ kf (p j ) − ∑ λi φ (kp j − pi k)k2 . {λi } j=1
{λi } j=1
This yields the square linear system of equations: φ (kp1 − p1 k) . . . φ (kp1 − pn k) .. .. . .
φ (kpn − p1 k) . . . φ (kpn − pn k)
i=1
λ1 f (p1 ) .. = .. . . f (pn ) λn
If we examine the matrix in the system above, we quickly realize that things can turn sour if two data sites pi0 and pi1 are very close spatially since two rows of the matrix are nearly the same and the matrix is then ill-conditioned or rank deficient. In the limit adding an extra row in the matrix should not be problematic per say but if the values f (pi0 ) and f (pi1 ) differ because of noise then finding a solution to the system becomes difficult. On one hand we are looking for an approximation in a space of smooth functions, on the other hand the data indicates that the function is not smooth. This contradiction needs to be resolved. In particular, since the data is corrupted with error, it is not necessary for the approximation to interpolate the data. Since errors in the data can flood their solutions, ill-conditioned problems are bad news. In what follows, we examine different regularization for improving least-squares problem conditioning. The Gauss-Markov theorem (Section 3) tells us that the least-squares estimator is the unbiased linear estimator with minimum variance. When A is ill-conditioned, this variance is still large. The variance can be reduced if the estimator is allowed to be biased. This is the approach taken by regularization techniques: accept some bias to reduce the variance. Note that all these techniques requires choosing regularization or damping parameters. There are published techniques that can guide us in this choice. Many of them require some knowledge or assumptions of the noise distribution. Often it may be best to experiment with several approaches. In what follows we briefly mention some of these techniques.
7.1 Truncated SVD One simple way to improve conditioning is to lower the condition number of the matrix by manipulating its Singular Value Decomposition. The SVD of A (see Appendix A) is: A = UDV T , where U and V are orthogonal matrices and D is the diagonal matrix of singular values (D = diag(σ1 . . . . , σ2 )). We can rewrite this equation using the columns vectors of U
Practical Least-Squares for Computer Graphics, Fred Pighin and J.P. Lewis
and V (ui and vi respectively): UDV T = u1
From which we derive:
...
un
σ1 .. . 0
... .. . ...
0 .. v 1 . σn
42
T
. . . vn
n
A = ∑ σi ui vTi . i=1
In other words, the SVD allows the reconstruction of the matrix A as a weighted sum of rank 1 matrices (ui vTi ). If we assume that the singular values are sorted in nonincreasing order (i.e. σ1 ≥ . . . ≥ σn ), we can truncate the reconstruction at index k and approximate A by the matrix Ak : k
A ≃ ∑ σi ui vTi . i=1
Ak is the best rank k approximation of the matrix A. In other words, Ak is the minimum min kA − MkF , with rank(M) = k, M q where k.kF denotes the Frobenius norm (kMkF = ∑i, j m2i, j ). The condition number (A) and since σk (A) ≥ σmax (A) then κ (Ak ) ≤ κ (A), so using Ak of Ak is κ (Ak ) = σσmax(A ) k yields a better conditioned system. Choosing the truncation value. Choosing the optimal value for k can be challenging. For instance, using the concept of the numerical rank of a matrix and techniques from perturbation analysis [18] define a very complex criteria for k. A more simple criteria [20] is to pick k such that it is the smallest integer such that: n
kb − Aˆxk =
∑
(U T b)2i < n.
i=k+1
The number n in the above formula arise from the expectation of the Chi-squared distribution with n degrees of freedom. This distribution governs the sum of squared residuals under a normal (i.e. Gaussian) error distribution assumption. The truncated SVD technique is useful for addressing ill-conditioning but provides little choice for controlling how the solution is determined. The techniques presented next offer much more opportunities for tweaking. 7.1.1 Example: skin weights computation from examples The goal of skinning is to deform a surface (e.g. a human body) according to the motion of its skeleton. Traditionally, the skeleton is a collection of bones represented
Practical Least-Squares for Computer Graphics, Fred Pighin and J.P. Lewis
NNLS
43
TSVD
Figure 10: Example of regularization from James and Twigg [24]. Visualization of skin weights on a camel model. On the right the weights were computed using truncated SVD, on the left they were computed by solving a non-negative least-squares problem. by (usually rigid) transformations, {Tb } and each vertex vi is associated with a set of bones indexes Bi . The animated position of a vertex, vi (t), is computed by linearly blending the influence of each bone: vi (t) =
∑ wi,b Tb (t)vi , b∈B
where wi,b (called skin weight) is a scalar that tells how much influence bone b as on vertex i. The skin weights are traditionnaly specified using a paint program. An alternative is to derive or learn the skin weights from a set of deformed meshes associated to specific skeleton configuration. This is the approach taken by [27, 24]. To see how this problem is set up, let us call vsi the position of vertex i in example mesh s and similarly, T sb , the transform associated with bone b in the configuration of mesh s. The problem is to find weights, {wi,b } that are solutions of: min ∑ k ∑ wi,b T sb vi − vsi k2
{wi,b } s
b∈B
For each vertex i, its skin weights, wi , are thus determined as the solution of a leastsquares problem, Ai wi = vi . Ill-conditioning can easily creep in this problem. In particular, it will be the case if we introduce , in the example set, meshes that are quite different but are associated with similar skeleton poses. To remedy this problem, [24] uses two strategies. The first strategy is to use a truncated SVD (with a singular value threshold of 10−5kAi k2 3 ). The second strategy is to impose a non-negative constraint on each weight. Figure 10 provides a visualization of the weights estimated with these two techniques. 3 Note
k2 that for a matrix M, kMk2 = maxx6=0 kMx = σmin kxk 2
Practical Least-Squares for Computer Graphics, Fred Pighin and J.P. Lewis
44
7.2 Damped least-squares and Tikhonov regularization The basic idea behind damping is to add terms to the penalty function to avoid certain solutions. For instance, because ill conditioning causes large values in the solution, we might want to add a preference that the solution be small using a modified least-squares criterion such as: min(kb − Axk2 + λ kxk2 ), x where λ is a scalar. This type of technique is called damped least-squares or Tikhonov regularization. It use a penalty function of the general form: min(kb − Axk2 + λ kLxk2 ), x where L is a matrix that allows control over the damping. The minimization problem yields the system of equations: (AT A + λ LT L)x = AT b. For instance, if we choose λ = 1 and L = diag(l1 , . . . , ln ) to selectively damp each parameter in the solution, the solution can computed using the SVD decomposition: n
σi uT bvi , 2 + l2 i σ i=1 i i
xˆ = ∑
Another choice is to use a bi-diagonal matrix L that approximates the first derivative operator: −1 1 .. .. L= . . −1 1
This formulation is sometime used in image processing for enforcing smoothness in the solution by limiting the magnitude of the spatial derivatives (a Laplacian term can also be used).
Choosing the damping parameters. Several techniques have been proposed for selecting a damping parameter. Some of these assume that the variance of the noise is known, such as the discrepancy principle [22]. Other techniques such as generalized cross-validation [17] and L-curve [21] are applicable with less knowledge of the noise. Generalized cross-validation defines the optimal damping parameter as the minimum of a the function kAx − bk2 /do f 2 , where do f is the effective number of degrees of freedom. The L-curve technique is based on plotting the norm of the solution, kˆxk, against the norm of the residual, kAx − bk. The parameter λ is then selected at the point of maximum curvature. That corner corresponds to a change in behavior of the system. Finally and more recently, [31] proposes a selection criteria based on minimizing an approximation of the error between the regularized solution and the (unknown) true solution.
Practical Least-Squares for Computer Graphics, Fred Pighin and J.P. Lewis
45
7.2.1 Example: inverse kinematics. Ill-conditioning arises naturally in problem like inverse kinematics where we are try to specify the joint angles along a kinematic chain (e.g. an arm) using the target position of an end effector (e.g. a hand). Following the notations of [5], if p is the position of ∂p the target, q is the vector of joint angles, and J is the matrix of partial derivatives ( ∂ q i , j then applying the chain rule yields: p˙ = Jq˙ , with p˙ and q˙ being respectively the derivatives of p and q with respect to time. The previous equation is a linearized approximation of the true inverse problem, p = f (q). It can be solved once at every frame, in such case the end effector only approximately follows the target, or iteratively until the end effector is close enough to the target. The least squares solution is: qˆ˙ LSE = (JT J)−1 JT q˙ . Unfortunately this problem is in general under underconstrained (e.g. specifying the position of the hand does not constrain the elbow) and small changed in the target position can result in large changes along the cinematic chain. To address this problem [37, 28] damp the system to penalize large angle variations in the error function and minimize: min kJq˙ − p˙ k2 + λ k˙qk2 . q˙ 7.2.2 Example: surface correspondences. We saw that ill-conditioning arises in sparse data interpolation problems. [30] uses sparse interpolation to derive a dense mapping between two meshes from a sparse set of correspondences. First, the corrrespondances are interpolated using Radial Basis Functions. The interpolated function is used to warp the source mesh toward the target mesh. Finally the warped source mesh is cylindrically projected onto the target mesh. Given a set of samples, {pi , di }, the interpolating warping function d˜ is expressed as: n
˜ d(p) = ∑ wi φi (kp − pi k), i=1
where φi is an adaptive kernel of the form: q φi (h) = h2 + s2i .
The parameter si is used to tune the influence of the kernel to the density of the sample data. It is chosen as the distance to the closest neighboring data site (i.e. si = mini6= j kpi − p j k).
Practical Least-Squares for Computer Graphics, Fred Pighin and J.P. Lewis
46
Fitting the RBF model is then done by solving the minimization problem: n
˜ j ) − d j k2 + λ kw j k2 ) min ∑ (kd(p {wi } j=1 n
n
=
min ∑ (k ∑ wi φi (kp j − pi k) − d j k2 + λ kw j k2 ) {wi } j=1 i=1
The regularization parameter λ is estimated by minimizing the Generalized CrossValidation function: ˜ j ) − d j k2 ∑nj=1 kd(p GCV (λ ) = , (n − γ )2
where n is the number of correspondences and γ is the effective number of parameters (γ = n − λ tr(A−1 )). Since {wi } and λ depends on each other, the estimation proceeds iteratively by alternatively estimating the two quantities. 7.2.3 Example: image registration. Many image processing problems are ill-posed and need to be regularized. This can be done by imposing a roughness penalty on the solution. For instance, in super-resolution reconstruction [10] the goal is to produce high-resolution images from a set of lower resolution images. The difficulty is to register the lower resolution images. This is usually done assuming a linear motion. Let us assume, n low resolution images {yi } that we would like to fuse into a high-res image x. If we represent the images as column vectors sorted in lexicographic order then we can represent linear operators on images as matrices operating on these vectors. In particular, we will assume that the relationship between yi and x is linear: yi = Di Hi Fi x + vi where Fi is the geometric motion operator from x to yi , Hi is a blur matrix, Di is a downsampling matrix (or decimator operator), and vi is a noise vector. The unknown high-res image can be estimated as the solution of the least squares problem: n
min ∑ kyi − Di Hi Fi xk2 + λ kLxk2 x i=1 where the regularization matrix L is built by replication of the Laplacian kernel: 1 1 1 Lkernel = 1 −8 1 1 1 1
The regularization term enforces spatial smoothness since it penalizes solutions that have large Laplacians.
Practical Least-Squares for Computer Graphics, Fred Pighin and J.P. Lewis
47
7.3 Quadratic constraints The regularization methods introduced in the previous subsection are formulated by adding a penalty term of the form λ kLxk2 . Another approach is to use a similar expression to define a bounded problem: min kb − Axk2 subject to kLxk ≤ γ , x where γ is a scalar defining a region of acceptable solutions. The constraint kLxk ≤ γ defines a feasible set among which we must choose the solution. This problem is quite different from the penalty approach described in the previous subsection. The quadratic expression defines a hard constraint whereas the penalty does not. From a mathematical point of view, this is an instance of a least-squares with quadratic inequality constraint (LSQI) problem whose general form is: min kb − Axk2 subject to kLx − dk ≤ γ . x Clearly the problem only has a solution if minx kLx − dk ≤ γ . If the previous condition holds, then there are two cases: either the solution xint = minx kAx − bk is within the feasible set (i.e. kLxint − dk ≤ γ and xint is the solution, or it is not and we have to look for a solution at the boundary of the set: min kb − Axk2 subject to kLx − dk = γ . x This type of problem can be analyzed using Lagrange multipliers (see Section 6). The resulting normal equation is: (AT A + λ LT L)x = AT b + λ Lt d, where λ is the Lagrange multiplier determined by the constraint: kLx − dk = γ
Practical Least-Squares for Computer Graphics, Fred Pighin and J.P. Lewis
48
8 Non-linear least squares So far, we have focused on problems of the form: min kb − Axk2 = min ∑(bk − aTk x)2 , x x k where A is a matrix with row vectors {ak }. From a model fitting perspective the linear least squares formulation assumes a linear model, x, and fits it to the data points {(ak , bk )}. The linear assumption, albeit convenient, is often not practical and we often found ourselves considering non-linear models. Let f be such non-linear model. Keeping consistent with our notation, f is a non-linear function from ℜn to ℜ. Also call x a vector of parameters and {(ak , bk )} a set of inputs and outputs such that f (ak , x) = bk for all k. Fitting this non-linear model to the data can be formulated as: min ∑(bk − f (ak , x))2 . x k We can thus write the non-linear error function as E(x) = ∑k (bk − f (ak , x))2 and the solution as xˆ LSE = minx E(x). We will call the jth residual r j = b j − f (a j , x) and the vector of residuals r = (r1 , . . . , rm ). Since we will be using derivatives, we can express the first and second order derivatives h i dr of E as a function of the derivatives of r and in particular its Jacobian matrix, J = dxij . Using the chain rule, derive: m
∇E
=
∑ r j ∇r j ,
j=1
=
JT ∇r
=
∑ ∇r j ∇rTj + ∑ r j Hr j ,
m
m
HE
j=1
j=1
m
=
JT J + ∑ r j Hr j j=1
8.1 Characterization and uniqueness of a solution In general a local minima, xmin of E is characterized by the two conditions: ∇E(xmin ) = 0 T
h HE (xmin )h
≥ 0, for all h ∈ N(xmin )
where HE is the Hessian matrix of E (e.g. HE = ( ∂ x∂i ∂Ex j )) and N(xmin ) an open neighborhood of xmin . Looking at the second order Taylor series expansion of E at x gives
Practical Least-Squares for Computer Graphics, Fred Pighin and J.P. Lewis
49
us some insights on these conditions: E(xmin + h) ≈ ≈
1 E(xmin ) + ∇E(xmin )h + hT HE (xmin )h 2 1 T E(xmin ) + h HE (xmin )h 2
In other words, locally around xmin the function E looks like an inverted bowl centered at xmin . For smooth functions, these conditions define local minima. They also define a global minimum if the function, E, is convex. The first two algorithms we cover, steepest descent and Newton’s method, are not specific to least-squares problems but rather they can be applied to general minimization problems. They are not often employed in practice, however, they are often used to define or measure other algorithms.
8.2 Iterative descent algorithms When the function f is non linear, in most cases we cannot solve directly for a solution. Instead, most non-linear minimization technique are iterative and proceed by computing a sequence x0 , x1 , . . . , xl such that f (x0 ) ≥ f (x1 ) ≥ . . . ≥ f (xl ). The idea is that the algorithms progress toward the solution by doing a local search that bring them closer at each iteration. At the end of each iteration, the conditions for a local minimum are used as stopping criteria. The local search is often done by selecting a descent direction h and choosing xk+1 = xk + α h. A vector h is a descent direction if there is a scalar α such that f (xk + α h) < f (xk ). The descent directions can also be characterized by the condition: hT ∇ f (xk ) < 0. Non-linear least-squares algorithm are usually characterized by their convergence rate which is a measure of how fast it converges toward the solution as a function of the number of iterations. Also keep in mind that choosing a ”good” starting point, x0 , that is to say one that is close to the solution can significantly speed up finding a solution.
8.3 Steepest descent The iteration of the steepest descent algorithm is based on following the direction of ∇E(xk ) steepest descent, − k∇E( x )k , such that the iteration is: k
xk+1 = xk − α ∇E(xk ), where α is a scalar chosen so that E(xk+1 ) is as small as possible (finding such value is in general far from trivial and is the object of line search algorithms. The convergence rate of the steepest descent algorithm is linear and often very slow.
Practical Least-Squares for Computer Graphics, Fred Pighin and J.P. Lewis
50
Figure 11: Geometry of Newton’s method. The next step xk+1 is obtained by minimizing a quadratic approximation of the error function at xk .
8.4 Newton’s method Newton’s method iterates by using a second order approximation of the error function, ˜ E: ˜ k + h) = E(xk ) + ∇E(xk )h + 1 hT HE (xk )h E(x 2 Minimizing this expression with respect to h, yields: ˜ k + h) d E(x = ∇E(xk ) + HE (xk )h = 0, dh from which we derive h = HE (xk )−1 ∇E(xk ). Now, we would like to choose xk+1 = xk + h since it seems that in this case xk+1 would minimize a local second order approximation of E(x). Unfortunately, xk + h is a minima of the approximation only if the curvature at this point is positive or in other words if HE (xk ) is positive semi-definite. If the function is convex over the domain we are minimizing over, then it is always true; if not, we cannot guarantee that h is a descent direction. For this reason and also because each step requires solving a system of equations, quasi-Newton’s methods, that replace the Hessian matrix by a positive definite approximation, are often preferred. Newton’s method has a quadratic convergence rate.
8.5 Gauss-Newton method The Gauss-Newton method is a simplification of Newton’s algorithm with line search. Recall that in Newton’s method iterations are computed using a step vector h that is
Practical Least-Squares for Computer Graphics, Fred Pighin and J.P. Lewis
51
solution of the system of equations: HE (xk )h = ∇E(xk ), using the derivatives of r we obtain: m
(J T (xk )J(xk ) + ∑ r j (xk )Hr j (xk ))h = JT (xk )∇r(xk ), j=1
finally if we neglect the terms with second order derivatives, ∑mj=1 r j (xk )Hr j (xk ), the previous expression becomes: JT (xk )J(xk )h = JT (xk )∇r(xk ) In practice, in many cases the term JT J dominates the Hessian, so that the GaussNewton method exhibits performances similar to Newton’s method. Notice also that the approximation is justified when the residuals are small which is the case near the minimum for many problems (interestingly adding a constant to the residual would alter this property but not change the position of the minimum xˆ ). The advantages of this simplification are two-folds. First, second-order derivatives are not required. Second, if J has full-rank and ∇E is non-zero, then h is a descent direction and as such is a suitable direction for a line search.
8.6 Levenberg-Marquardt Levenberg-Marquardt generalizes least squares fitting to non-linear models. As with ordinary least squares, a sum of squares is to be minimized, and the errors are assumed to be Gaussian: � � bk − f (ak , x) 2 arg min ∑ p σk where f (ak , x) is a non-linear function of parameters x evaluated at location ak , σk is the assumed noise variance at location ak , and bk is the measured data value at this location. The popular Numerical Recipes book [33] has a good description of this method, but we will give an intuitive description of the basic idea here. The Levenberg-Marquardt procedure is based on the idea a quadratic is a good approximation sufficiently close to the minimum, but may be a bad approximation far from the minimum. Thus, it “blends” between gradient descent and Newton approaches based on how well the Newton approach is performing. More specifically, it uses a step size defined by (H + λ I)δ = ∇ f where I is the identity matrix and λ is a scalar. When λ is small, obviously the behavior is guided by the Newton approach. When λ is large, the step size becomes
Practical Least-Squares for Computer Graphics, Fred Pighin and J.P. Lewis
52
more proportional to the gradient, i.e., gradient descent is used. Levenberg-Marquardt dynamically varies λ , increasing it when previous steps fail to reduce the error. In addition, Levenberg-Marquardt uses an approximation to the Hessian matrix that reduces the second derivative sensitivity to noise. Although the descriptions on Numerical Recipes are clear, the coding style there is not ideal, in part because of the Fortran-style array indexing and short names. One of the authors has produced a Java language Levenberg-Marquardt implementation with a more readable style (http://www.idiom.com/∼zilla/Computer/Javanumeric/index.html); it should be easy to translate this into C/C++.
Practical Least-Squares for Computer Graphics, Fred Pighin and J.P. Lewis
53
9 Conclusion In these notes, we tried to offer an overview of the different least-squares techniques available. We also tried to illustrate these techniques through examples taken from the computer graphics community. Our hope is to expose some of the less known techniques. It often seems that every problem can be formulated as a least-squares minimization on which we can unleash an array of numerical techniques. Our experience has taught us that it is valuable to spend some time studying the data and carefully formulating the problem to derive a robust and efficient solution. Also when working with artists who sometime lack the necessary mathematical background, it is often better to prefer techniques and solutions that are predictable and appeal to common sense. Or you might have to explain why non-convexity prevented your non-linear solver from finding the “correct” solution.
Practical Least-Squares for Computer Graphics, Fred Pighin and J.P. Lewis
54
References [1] N. Amenta and Y. J. Kil. Defining point-set surfaces. In SIGGRAPH ’04: ACM SIGGRAPH 2004 Papers, pages 264–270, New York, NY, USA, 2004. ACM Press. [2] A. Bjork. Numerical methods for least-squares problems. SIAM, Philiadephia, 1934. [3] M. Black. Robust Incremental Optical Flow. PhD thesis, Yale, 1992. [4] C. Bregler, L. Loeb, E. Chuang, and H. Deshpande. Turning to the masters: motion capturing cartoons. In SIGGRAPH ’02: Proceedings of the 29th annual conference on Computer graphics and interactive techniques, pages 399–407, New York, NY, USA, 2002. ACM Press. [5] S. R. Buss and J.-S. Kim. Selectively damped least squares for inverse kinematics. journal of graphics tools, 10(3):37–49, 2005. [6] B. Le Callennec and R. Boulic. Robust kinematic constraint detection for motion data. In SCA ’06: Proceedings of the 2006 ACM SIGGRAPH/Eurographics symposium on Computer animation, pages 281–290, Aire-la-Ville, Switzerland, Switzerland, 2006. Eurographics Association. [7] J. C. Carr, R. K. Beatson, J. B. Cherrie, T. J. Mitchell, W. R. Fright, B. C. McCallum, and T. R. Evans. Reconstruction and representation of 3d objects with radial basis functions. In Proceedings of ACM SIGGRAPH 2001, Computer Graphics Proceedings, Annual Conference Series, pages 67–76, August 2001. [8] E. Chuang and C. Bregler. Performance driven facial animation using blendshape interpolation. CS-TR-2002-02, Department of Computer Science, Stanford University, 2002. [9] M. Eck, T. D. DeRose, T. Duchamp, H. Hoppe, M. Lounsbery, and W. Stuetzle. Multiresolution analysis of arbitrary meshes. In Proceedings of SIGGRAPH 95, Computer Graphics Proceedings, Annual Conference Series, pages 173–182, August 1995. [10] S. Farsiu, M. D. Robinson, M. Elad, and P. Milanfar. Fast and robust multiframe super resolution. IEEE Transactions on image processing, 13(10):1327– 1344, 2004. [11] G. D. Finlayson, S. D. Hordley, and I. Tastl. Gamut constrained illuminant estimation. Int. J. Comput. Vision, 67(1):93–109, 2006. [12] M. A. Fischler and R. C. Bolles. Random sample consensus: A paradigm for model fitting with applications to image analysis and automated cartography. Communications of the ACM, 24(6):381–395, 1981.
Practical Least-Squares for Computer Graphics, Fred Pighin and J.P. Lewis
55
[13] S. Fleishman, D. Cohen-Or, and C. T. Silva. Robust moving least-squares fitting with sharp features. ACM Trans. Graph., 24(3):544–552, 2005. [14] D. Forsyth and J. Ponce. Computer Vision: A Modern Approach. Prentice Hall, 2003. [15] M. Gleicher. A graphics toolkit based on differential constraints. In UIST ’93: Proceedings of the 6th annual ACM symposium on User interface software and technology, pages 109–120, New York, NY, USA, 1993. ACM Press. [16] M. Gleicher and A. Witkin. Through-the-lens camera control. In SIGGRAPH ’92: Proceedings of the 19th annual conference on Computer graphics and interactive techniques, pages 331–340, New York, NY, USA, 1992. ACM Press. [17] G. Golub, M. Heath, and G. Wahba. Generalized cross-validation as a method for choosing good ridge parameters. Techntronics, 21:215–223, 1979. [18] G. H. Golub, V. C. Klema, and G. W. Stewart. Rank degeneracy and least squares problems. Technical Report CS-TR-76-559, 1976. [19] Y. Guo, J. Wang, H. Sun, X. Cui, and Q. Peng. A novel constrained texture mapping method based on harmonic map. Computers & Graphics, 29(6):972– 979, December 2005. [20] P. C. Hansen. Rank-deficient and discrete ill-posed problems: numerical aspects of linear inversion. SIAM, Philiadephia, 1987. [21] P. C. Hansen. Analysis of discrete ill-posed problems by means of the l-curve. SIAM Rev., 34:561–580, 1994. [22] P. C. Hansen. Rank-deficient and discrete ill-Posed problems: numerical aspects of linear inversion. SIAM, Philiadephia, 1997. [23] M. Hardy. An Illuminating Counterexample. ArXiv Mathematics e-prints, June 2002. [24] D. L. James and C. D. Twigg. Skinning mesh animations. In SIGGRAPH ’05: ACM SIGGRAPH 2005 Papers, pages 399–407, New York, NY, USA, 2005. ACM Press. [25] V. Kwatra, I. Essa, A. Bobick, and N. Kwatra. Texture optimization for examplebased synthesis. ACM Trans. Graph., 24(3):795–802, 2005. [26] C. L. Lawson and R. J. Hanson. Solving Least Squares Problems. Prentice–Hall, Englewood Cliffs, NJ, 1974. [27] A. Mohr and M. Gleicher. Building efficient, accurate character skins from examples. ACM Transactions on Graphics, 22(3):562–568, July 2003. [28] Y. Nakamura and H. Hanafusa. Inverse kinematics solutions with singularity robustness for robot manipulator control. Journal of dynamic systems, measurements, and control, 108:163–171, 1986.
Practical Least-Squares for Computer Graphics, Fred Pighin and J.P. Lewis
56
[29] A. Nealen, T. Igarashi, O. Sorkine, and M. Alexa. Laplacian mesh optimization. In GRAPHITE ’06: Proceedings of the 4th international conference on Computer graphics and interactive techniques in Australasia and Southeast Asia, pages 381–389, New York, NY, USA, 2006. ACM Press. [30] J. Noh and U. Neumann. Expression cloning. In Proceedings of ACM SIGGRAPH 2001, Computer Graphics Proceedings, Annual Conference Series, pages 277– 288, August 2001. [31] D. P. O’Leary. Near-optimal parameters for tikhonov and other regularization methods. SIAM Journal on Scientific Computing, 23(4):1161–1171, 2001. [32] F. Pighin, J. Hecker, D. Lischinski, R. Szeliski, and D. H. Salesin. Synthesizing realistic facial expressions from photographs. In Proceedings of SIGGRAPH 98, Computer Graphics Proceedings, Annual Conference Series, pages 75–84, July 1998. [33] W. H. Press, B. P. Flannery, S. A. Teukolsky, and W. T. Vetterling. Numerical Recipes in C : The Art of Scientific Computing. Cambridge University Press, 1992. [34] O. Sorkine and D. Cohen-Or. Least-squares meshes. In Proceedings of Shape Modeling International, pages 191–199. IEEE Computer Society Press, 2004. [35] L. N. Trefethen and III D. Bau. Numerical linear algebra. SIAM, Philiadephia, 1997. [36] G. Turk and J. F. O’Brien. Modelling with implicit surfaces that interpolate. ACM Transactions on Graphics, 21(4):855–873, October 2002. [37] C. W. Wampler. Manipulator inverse kinematic solutions based on vector fomulations and damped least-squares methods. IEEE Transactions on Systems, Man, and Cybernetics, 16:93–101, 1986. [38] D. Zhang and M. Hebert. Harmonic maps and their applications in surface matching. cvpr, 02:2524, 1999.
Practical Least-Squares for Computer Graphics, Fred Pighin and J.P. Lewis
57
Figure 12: Geometric interpretation of the SVD for a 2 × 2 matrix, A.
A
The Singular Value Decomposition
Matrix decompositions are tools both for solving and for gaining insight into linear algebra problems. One of the most useful decomposition is the Singular Value Decomposition (SVD). Consider the case m ≥ n which corresponds to an over-determined system of equations (the case m ≤ n being quite similar). Given an m × n real matrix A, the SVD of A is written: A = UDV T , where U is an m × m orthogonal 4 matrix, V is an n × n orthogonal matrix, and D is an m × n matrix of the form: σ1 . . . 0 .. . . . . . .. 0 . . . σn D= 0 ... 0 . . . . . .. .. 0 ... 0 In other words the top n rows form a diagonal matrix and the bottom m − n rows are filled with zeroes. The {σi } are non-negative scalars called the singular values of A. For ease of analysis it is conventional to assume that the singular values are sorted in non-increasing order (i.e. σ1 ≥ σ2 ≥ . . . ≥ σn ≥ 0). Any matrix can be decomposed using the SVD. In what follows, we call {ui } and {vi } the columns vectors of matrix U and V respectively. 4 Recall that a square matrix M is orthogonal if MM T = I. Orthogonal matrices preserve distances (i.e. kMpk = kpk). In 3-space they represent rotations (det(M) = +1) and symmetries (det(M) = −1).
Practical Least-Squares for Computer Graphics, Fred Pighin and J.P. Lewis
58
Geometric interpretation. The SVD has a geometric interpretation: it describes the transformation of a unit sphere (in an n dimensional space) into a hyperellipse 5 (in an m-dimensional space). This relies on the fact that linear transformations (i.e. matrices) transform spheres into hyperellipses. With the unit sphere as input, the resulting hyperellipse has for principal semiaxes the vectors {σi ui }. The vectors {vi } give the directions in which the sphere is stretched in the original space. Figure 12 illustrates this geometric interpretation. Properties. We can learn a lot about a matrix once it has been decomposed. Here are some of the most useful properties:
n
|det(A)| = kAk2 kAkF
∏ σi , i=1
= σ1 , s =
n
∑ σi2 ,
i=1
and with r = rank(A): range(A) = null(A) =
5 An
hu1 , . . . , ur i,
hvr+1 , . . . , vn i
hyperellipse is to an m dimensional space what an ellipse is to a 2-dimensional space.
Practical Least-Squares for Computer Graphics, Fred Pighin and J.P. Lewis
59
B Errata In the Constrained Least Squares subsection on Lagrange Multipliers, the final equation should be ∇ f (x, y) + λ ∇g(x, y) = 0