differences between variables (*** p < 0.001; * p < 0.05) using Wilcoxon matched-pairs signed rank test (paired samples for comparison in same infant).
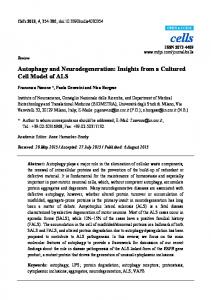
Figure S1. Immunoglobulin concentrations of (A) total IgM (SIgM/IgM) and (B) IgG in mother’s milks delivering prematurely (23–32 week of gestational age (GA), 7–98 days of postnatal age) and at term (38–40 week of GA, 16–42 days of postnatal age). Values are mean ± SEM, n = 15 for preterm infants and n = 8 for term infants. Asterisks show statistical significant differences between variables (*** p < 0.001; * p < 0.05) using Mann Whitney test (unpaired samples for preterm vs. term).
Nutrients 2018, 10,
S2 of S8
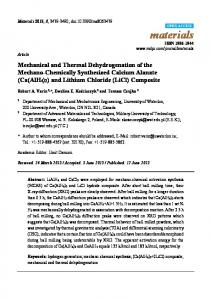
Figure S2. Peptide counts and abundance of human immunoglobulin fragments in human milk and gastric samples at 2 h postprandial time from paired mother-infant delivered prematurely (23–32 week of gestational age (GA), 7–98 days of postnatal age) and at term (38–40 week of GA, 16–42 days of postnatal age). Values are mean ± SEM, n = 15 for preterm infants and n = 8 for term infants. (A, B, C and D) Ig alpha-chain (from SIgA/IgA), (E and F) Ig mu-chain (from SIgM/IgM). Asterisks show statistical significant differences between variables (*** p < 0.001; * p < 0.05) using Wilcoxon matched-pairs signed rank test (paired samples for comparison in same infant).
Nutrients 2018, 10,
S3 of S8
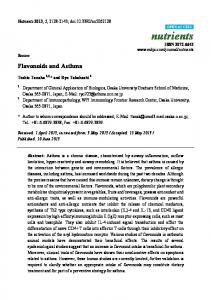
Figure S3. Peptide counts and abundance of human immunoglobulin fragments in human milk and gastric samples at 2 h postprandial time from paired mother-infant delivered prematurely (23–32 week of gestational age (GA), 7–98 days of postnatal age) and at term (38–40 week of GA, 16–42 days of postnatal age). (A, B, C and D) Ig gamma-chain (from SIgA/IgA), (E, F, G and H) Ig J-chain (from SIgA/IgA/SIgM/IgM). Values are mean ± SEM, n = 15 for preterm infants and n = 8 for term infants. Asterisks show statistical significant differences between variables (*** p < 0.001; * p < 0.05) using Wilcoxon matched-pairs signed rank test (paired samples for comparison in same infant).
Nutrients 2018, 10,
S4 of S8
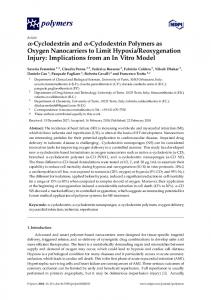
Figure S4. Peptide counts and abundance of human immunoglobulin fragments in human milk and gastric samples at 2 h postprandial time from paired mother-infant delivered prematurely (23–32 week of gestational age (GA), 7–98 days of postnatal age) and at term (38–40 week of GA, 16–42 days of postnatal age). Values are mean ± SEM, n = 15 for preterm infants and n = 8 for term infants. (A, B, C and D) Ig kappa-chain (from SIgA/IgA/SIgM/IgM/IgG), (E, F, G and H) Ig lambda-chain (from SIgA/IgA/SIgM/IgM/IgG). Values are mean ± SEM, n = 15 for preterm infants and n = 8 for term infants. Asterisks show statistical significant differences between variables (*** p < 0.001; * p < 0.05) using Wilcoxon matched-pairs signed rank test (paired samples for comparison in same infant).
Nutrients 2018, 10, x FOR PEER REVIEW
S5 of S9
Figure S5. The pH in human milk and gastric samples in human milk and gastric samples at 2 h postprandial time from paired (A) mother-infant delivered prematurely (23–32 week of gestational age (GA), 7–98 days of postnatal age) and (B) at term (38–40 week of GA, 16–42 days of postnatal age). Values are mean ± SEM, n = 15 for preterm infants and n = 8 for term infants. Asterisks show statistical significant differences between variables (*** p < 0.001; * p < 0.05) using Wilcoxon matched-pairs signed rank test (paired samples for comparison in same infant).
Figure S6. Stability of standard immunoglobulins (Igs) before and after the incubation at pH 4.5. (A) Concentrations of total IgA (SIgA/IgA), (B) total secretory component (SC/SIgA/SIgM), (C) total IgM and (SIgM/IgM) (D) IgG were determined by ELISA. No significant difference between groups (p > 0.05) was observed using paired Student t-tests. Values are mean ± SEM, n = 3.
Nutrients 2018, 10,
S6 of S8
Table S1. Details for the assays performed in human milk and gastric samples.
Type of assay
ELISA kit
Sample amount Sample in Standard curve (μL) dilution buffer
Human total IgA
IHUIGAKT, I.R.I 1
4
1:4,000
0.1–100 ng/mL
Human secretory EKC35479, Biomatik component (SC)
4
100
20–0.078 µg/mL
Human IgG
IHUIGGKT, I.R.I
4
1:100,000
0.2–200 ng/mL
Human IgM
IHUIGMKT, I.R.I
4
1:10,000
0.5–200 ng/mL
1
Innovative Research, Inc.
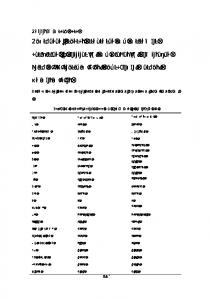
Table S2. Statistical results (p-values) for Wilcoxon matched-pairs signed rank test to compare immunoglobulin concentrations (ELISA) and peptides (peptidomics) in human milk and gastric samples in preterm and term infants (PM vs PG or TM vs TG). Mann Whitney test to compare measurements of preterm and term infant samples in human milk or gastric samples (PM vs. TM and PG vs. TG). All tests were using nonparametric tests as the D ’Agostino & Pearson normality test did not pass for some groups. Paired milk and gastric samples were collected from preterm infants (23–32 wk of gestational age, 7–98 days of postnatal age) and term infants (38–40 wk of GA, 16–42 days of postnatal age). Values are p-value for preterm (n = 15) and/or term (n = 7) infants. PM; preterm milk; PG; preterm gastric; TM, term milk; TG, term gastric. C, concentration; PC, peptide counts; PA, peptide abundance.
Immunoglobulin
PM vs. PG
TM vs. TG
PM vs. TM
PG vs. TG
C total IgA
0.001
0.016
0.62
0.73
C total SC
0.33
0.031
0.18
0.17
C total IgM
0.54
0.016
0.99
0.20
PA Ig J
0.016
0.031
>0.99
0.052
PC Ig lambda
0.99
0.39
PA Ig lambda
0.99
0.12
PC Ig kappa
0.001
0.031
>0.99
0.45
Nutrients 2018, 10,
S7 of S8
PA Ig kappa
0.001
0.031
>0.99
0.29
PC SC
0.001
0.016
0.64
0.52
PA SC
0.006
0.031
0.009
0.25
pH
< 0.001
< 0.001
< 0.001
< 0.001
Table S3. Statistical results (p-value) from the linear regression of the pH and the concentration of total IgA (SIgA/IgA), total SC (SC/SIgA/SIgM), IgG and total IgM (SIgM/IgM) across postnatal age (P), gestational age at birth (GA), postmenstrual age (PMA), BWb, BWs and feed volume (FV) in human milk and in gastric contents at 1, 2 and 3 h postprandial from preterm infants (23–32 wk of gestational age, 7–98 days of postnatal age) and term infants (38–40 wk of GA, 16–42 days of postnatal age). Values are P-value for preterm (n = 15) and/or term (n = 7) infants. Pearson correlation coefficient (r) and slope (s) are included when the p-value is < 0.1. PM, preterm milk; PG, preterm gastric; TM, term milk; TG, term gastric; C, concentration; PC, peptide counts; PA, peptide abundance.
Immunoglobulin
Factor
PM
PG
TM
TG
C Total IgA
P
0.002 (r = –0.74, s = – 13)
0.021 (r = –0.59, s = – 3.4)
0.77
0.20
GA
0.051 (r = 0.51, s = 0.15)
0.17
0.28
0.83
PMA
0.032 (r = -0.55, s = – 115)
0.059 (r = –0.50, s = – 35)
0.50
0.35
BWb
0.097 (r = 0.44, s = 559)
0.23
0.075 (r = -0.71, s = –480)
0.43
BWs
0.007 (r = -0.70, s = – 843)
0.043 (r = -0.57, s = – 223)
NA
NA
FV
0.059 (r = 0.52, s = 20)
0.17
0.92
0.92
C total SC
C total IgM
P
0.28
0.51
0.50
0.073 (r = – 0.77, s = – 5.3)
GA
0.25
0.42
0.58
0.76
PMA
0.80
0.92
0.66
0.18
BWb
0.20
0.46
0.28
0.17
BWs
0.89
0.57
NA
NA
FV
0.62
0.31
0.90
0.90
P
0.075 (r = –0.49, s = – 0.4)
0.33
0.30
0.52
GA
0.20
0.14
0.18
0.83
Nutrients 2018, 10,
C IgG
S8 of S8
PMA
0.18
0.89
0.92
0.11
BWb
0.46
0.19
0.26
0.50
BWs
0.032 (r = –0.60, s = – 31)
0.51
NA
NA
FV
0.012 (r = 0.65, s = 1.4)
0.021 (r = 0.61, s = 1.6)
0.25
0.66
P
0.23
0.22
0.61
0.84
GA
0.090 (r = -0.45, s = – 5.7)
0.91
0.65
0.88
PMA
0.84
0.014 (r = –0.62, s = – 16)
0.16
0.36
BWb
0.065 (r = –0.49, s = – 51)
0.95
0.68
0.016 (r = 0.80, s = 278)
BWs
0.88
0.026 (r = -0.61, s = 85)
NA
NA
FV
0.23
0.72
0.53
0.53