Sep 25, 1981 - DIANNE MCCARTHY AND MICHAEL DAVISON. UNIVERSITY OF AUCKLAND, NEW ZEALAND. Three experiments are reported in which two ...
1982, 37, 371-382
JOURNAL OF THE EXPERIMENTAL ANALYSIS OF BEHAVIOR
NUMBER 3
(MAY)
INDEPENDENCE OF STIMULUS DISCRIMINABILITY FROM ABSOLUTE RATE OF REINFORCEMENT IN A SIGNAL-DETECTION PROCEDURE DIANNE MCCARTHY AND MICHAEL DAVISON UNIVERSITY OF AUCKLAND, NEW ZEALAND Three experiments are reported in which two pigeons were trained to detect differences in stimulus duration under varying levels of absolute rate of reinforcement. Two red stimuli, differing in duration, were arranged probabilistically on the center key of a three-key chamber. On completion of the center-key duration, the center-keylight was extinguished and the two side keys were illuminated white. Correct responses were left-key pecks following the shorter duration and right-key pecks following the longer duration. In Experiment 1, relative rate of reinforcement for correct responses was held constant and absolute rate of reinforcement was varied in seven conditions from continuous reinforcement to a variableinterval 90-second schedule. In Experiment 2, relative rate of reinforcement was manipulated across three different absolute rates of reinforcement (continuous reinforcement, variable-interval 15-second, and variable-interval 45-second). Stimulus discriminability was unaffected by changes in absolute or relative rates of reinforcement. Experiment 3 showed that discriminability was also unaffected by arranging the same consequences (three-second blackout) for unreinforced correct responses and errors. Key words: signal detection, generalized matching law, stimulus discriminability, absolute reinforcement, pecking, pigeons
Behavior on concurrent schedules of reinforcement is well described by the generalized matching law (Baum, 1974): , P2 (1) yR2) where P tallies the number of responses emitted and R tallies the number of reinforcers obtained on two (subscripts 1 and 2) concurrently available schedules of reinforcement. The parameter a is the sensitivity of behavior to changes in the obtained reinforcement ratio, and c is inherent bias, a constant preference across all reinforcement ratios. In concurrentschedule research, preference is a function of the relative rate of obtained reinforcement (e.g., de Villiers, 1977), but is independent of overall rate of reinforcement if obtained relative rate of reinforcement is constant (Fantino, Squires, Delbruck, & Peterson, 1972). The generalized matching law (Equation 1) has also been used to describe behavior in a
signal-detection task (Davison & McCarthy, 1980; Davison & Tustin, 1978). Davison and Tustin (1978) applied the generalized matching law to the standard signal-detection 2 by 2 payoff matrix and derived two independent measures of performance: stimulus discriminability (or, the ability of a subject to tell two stimuli apart) and response bias. The matrix of events in a signal-detection yes-no procedure is shown in Figure 1. In the presence of one stimulus (S1), left-key responses (correct responses) are reinforced and right-key responses (errors) have no consequence or, perhaps, produce blackout. In the presence of S2, right-key responses are correct and are reinforced, and left-key responses are errors and are not reinforced. The various measures are designated PW and P, (correct responses) and P0, and Py (errors), and the reinforcers obtained in the correct cells are R,, and R,. Davison and Tustin (1978) wrote two separate equations for performance in S, and in S2. In SI,
This research was supported by grants to both authors from the New Zealand University Grants Committee. Initial results of Experiment 2 were discussed in McCarthy (1981). Reprints may be obtained from Dianne McCarthy or Michael Davison, Department of Psychology, University of Auckland, Private Bag, Auckland, New Zealand.
371
log ( ) = ar log (Rw) + log d + log c, (2) and in S2,
372
DIANNE McCARTHY and MICHAEL DAVISON
been shown to occur in some cases, the slope of the relation is zero. If, however, the behavior measure is a function of the reinforcement ratio, Equation 4 will have a nonzero slope, and it will conform to a nonunit isosensitivity curve in signal-detection theory (McCarthy & Davison, 1980b). A simplification of Equation 4, which assumes ar, = ar2, was suggested by Davison and Tustin (1978) to provide a point estimate of discriminability for a single experimental condition. A similar point estimate was suggested by Luce (1959; see also Nevin, Jenkins, Whittaker, & Yarensky, 1982).
RESPONSE 1
(Ir
_
_
_
Si
D -J D
RFT
EXT
EXT
RFT
JI
S2
log (p) -log( or,
Fig. 1. The matrix of stimulus and response events in a standard yes-no detection task. The numbers of events in each cell are denoted W, X, Y, and Z.
log (p) = ar2 log ( -v)- log d + log c.
(3) In these equations, ar1 and a'2 are the sensitivities of the behavior allocation to the reinforcement allocation (as is a in Equation 1), log c is inherent bias (as in Equation 1), and log d is discriminability, the measured ability of the animal to discriminate the two stimuli. In an experiment in which the relative numbers of reinforcers for left and right correct responses are varied, discriminability can be assessed from Equations 2 and 3. If the data are fit to these two equations, an estimate of log d can be obtained by a simple subtraction of the intercept of Equation 3 (log c log d) from that for Equation 2 (log c + log d) and division by 2. Alternatively, a stimulus function (McCarthy & Davison, 1980a) may be derived. Subtracting Equation 3 from Equation 2 gives: 2 2log ar
ar2
-logR
)log
p
Rw) + log de
(4)
The intercept of this relation (log d), obtained by linear regression, is a least-squares estimate of discriminability (as is the intercept-subtraction method given above). If, ar1= a,2, as has
I
) = 2 log d,
log d = [log(p,PW
)]
(5)
It is clearly safe to use Equation 5 as a point estimate if, and only if, arl = ar2. But the point estimate has to be used for conditions in which no reinforcement variation was carried out. It is clear that the point estimate (Equation 5) will be a measure with more variance than the regression estimate (Equation 4, or Equations 2 and 3). The only published data on the relation between discriminability and overall rate of reinforcement were presented by Nevin et al. (1982) in their Experiment 2. They reported that discriminability was monotonically related to overall rate of reinforcement. This finding seems incompatible with the generalized matching-law results mentioned above (Fantino et al., 1972) from which the detection equations were derived. It also seems inconsistent with some of our own results in which discriminability remained constant with moderate reinforcement-rate changes (e.g., McCarthy & Davison, 1979). The procedure used by Nevin et al. was more complex than the situations we used here. It was a conditionaldetection procedure in which a tone signaled a high-reinforcement-rate detection trial and a noise signaled a low-reinforcement-rate trial. In 11/12 cases, point estimates of discriminability were lower on noise trials than on tone trials. Reinforcement rates were varied from variable-interval (VI) 45-sec to VI 225-sec for correct responses, and, using probabilistic schedules, from p = .04 to p = 1.0 per correct response. The present experiment was a sys-
DISCRIMINABILITY AND ABSOLUTE RATE OF REINFORCEMENT
tematic replication of the Nevin et al. study in which overall rate of reinforcement (using VI schedules) was varied in a simpler, nonconditional, detection procedure, and effects on stimulus discriminability were assessed.
EXPERIMENT
1
METHOD Subjects Two experimentally naive homing pigeons, numbered 02 and 03, served. Both birds were maintained at 85%, + 10 g of their free-feeding body weights by providing supplementary food in the home cage after each experimental session. Water and grit were available at all times in the home cage. Apparatus The experimental chamber, situated remotely from solid-state control equipment, was sound attenuated, and masking noise was provided by an exhaust fan. The chamber contained three response keys, 2 cm in diameter, 9 cm apart, and 25 cm from the grid floor. The center key was transilluminated by a red or white light. The two outer keys were transilluminated white. Illuminated keys were operated by pecks exceeding .1 N. A food magazine was situated beneath the center key and 10 cm from the grid floor. During rein-
373
forcement, access to wheat, the keylights were extinguished and the food magazine raised for 3 sec. Apart from the key and magazine lights, the only other source of illumination in the chamber was a houselight. Procedure The birds were initially magazine trained and autoshaped to peck all three keys with various key colors. The birds were then trained to discriminate between two stimulus durations under seven experimental conditions. The sequence of conditions and the number of sessions training given in each are shown in Table 1. In all conditions, the center key was initially lit by a white light, and the two outer keys were dark. A peck on the center key extinguished the white light and produced a red center-key light for one of two durations. The shorter duration, designated S1, was 2.23 sec. The longer duration, designated S2, was 3.15 sec. Red center-key responses had no consequence. The probability of occurrence of S1 relative to S2 on the center key was constant at .5 throughout the experiment. On completion of the center-key stimulus, the red light was extinguished and the two white side keys were illuminated. Following S1 trials (when the shorter stimulus was presented on the center key), a peck on the left key was correct. Following S2 trials (when the tble
1
Experiment 1: Sequence of experimental conditions and the number of sessions training given in each. All times are in seconds and the probability of occurrence of the stimuli was .5 for all conditions. Also shown are the number of responses emitted and the number of food reinforcers obtained on the left and right keys on both S1 and S2 trials. These data were summed over the last five sessions of each experimental condition.
Condition 1.
CRF
Bird 02 03
2. VI7.5
02 03
3. VI 15
02 03 02
4. VI30
Responses in S1 L R 134
2
129
7 139i 9
Responses in S2 L R
86
20 28 14 48 13 5 179 195 153 446 112
1447
55
271
750
206 86
45
949
273
1891
110 218 265 356
557
5. VI45
03 02 03
6. VI60
02
686 788 1062 828
03
7. VI90
02
03
2077
16
7 63 69 23
53
116 121 255 213 290 358 451
573 685
773 765 1296
Reinforcers L R 134
129 70 123 107 116 137 126 126 131 117 115 102 119
116 121 180
127 143 134 113 124 124 119 133 135 148 131
Sessions 33
19 39 24 22 16 31
17 40 18 34 22 24 30
374
DIANNE McCARTHY and MICHAEL DAVISON
longer stimulus was presented on the center key), a peck on the right key was correct. Incorrect responses were left-key pecks following S2 presentations and right-key pecks following
1-8
02 o--o 03 .-.
S, presentations.
When a correct response was emitted on either the left or right key, the side-key lights were extinguished and the magazine light was presented for 3 sec. The frequency with which food delivery accompanied the magazine light was varied across seven experimental conditions (Table 1). For example, in Condition 1, 3-sec access to wheat always accompanied the magazine light (continuous reinforcement, CRF). In Condition 6, on the other hand, food delivery accompanied the magazine light according to a VI 60-sec schedule on all correct responses. Incorrect responses always produced 3-sec blackout during which the keyand houselights were extinguished and responses were ineffective. A new trial (that is, presentation of the white center-key light) began after either food reinforcement, magazine light, or blackout had been produced. Throughout the experiment, the occurrence of S, and S2 on the center key was independent of accuracy on the previous trial (a noncorrection procedure). Experimental sessions were conducted seven days a week. Daily training sessions continued until either 50 food reinforcers had been obtained or 45 minutes had elapsed. Sessions started and ended in blackout. The data collected were the number of responses emitted on the left and right keys following presentations of S, and S2 and the number of food reinforcers obtained on the left and right keys. Experimental conditions were changed when each bird had met a specified stability criterion. The criterion required that the median proportion of correct responses emitted over five sessions be within 5% of the median from the preceding five sessions. This criterion had to be met five, not necessarily consecutive, times. RESULTS AND DISCUSSION
The number of responses emitted and the number of food reinforcers obtained on the left and right keys on both S, and S2 trials are shown in Table 1. The changing maximum rate of food reinforcement arranged by the schedules is reflected in the changes in
i-
1O
o -J
*6 I
*05
a
a
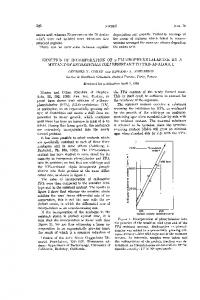
.1 *2 3 4.5 RFTS / TRIAL
1-0
Fig. 2. Experiment 1: Point estimates of stimulus discriminability as a function of the obtained number of food reinforcers per trial. The discriminability estimates were obtained using Equation 5 with the data shown in Table 1.
the number of correct responses emitted per reinforcer obtained in the various conditions. With continuous reinforcement, for example, one correct response per reinforcer was emitted. With VI 45-sec scheduling, on the other hand, the birds emitted, respectively, 5.9 and 7.4 correct responses. The total number of responses per reinforcer for the two birds, respectively, ranged from 1.09 and 1.14 for CRF to 7.81 and 17.24 for VI 90-sec. Almost invariably Bird 03 emitted more responses, and more correct responses, per reinforcer. Figure 2 shows point estimates of discriminability obtained from Equation 5. These have been plotted as a function of the obtained number of reinforcers per trial to facilitate comparison with Figure 7 of Nevin et al. (1982). Nevin et al. reported that point estimates of discriminability fell when the number of reinforcers per trial obtained decreased. The present data showed no evidence of this effect, and nonparametric trend tests (Ferguson, 1966) confirmed that no significant trend (p = .05) was present in the data from either bird. Besides the lack of trend, a feature of these data is their extreme variability from condition to condition. Mean log d values averaged across experimental conditions for Birds 02 and 03 were .97 and 1.06. But the associated
DISCRIMINABILITY AND ABSOLUTE RATE OF REINFORCEMENT standard deviations of the mean estimates were .28 and .35, respectively. Point estimates of discriminability obtained from Equation 5 are based on two ratios of behavior measures and are thus highly sensitive to random variations. This effect is especially clear when discriminability is high, that is, when few errors are emitted. The extreme case occurs when no errors of one sort or the other (P1, or Py; Figure 1) are emitted in a session, and discriminability becomes infinite. Stimulus discriminability was high in the present experiment (noticeably higher than in Nevin et al.'s experiment using apparently identical stimuli), and so the present data may not be sufficiently accurate to constitute a failure of replication of Nevin et al.'s results. Accordingly, in Experiment 2, we attempted to obtain more reliable estimates of discriminability of the two stimuli by varying the relative rates of reinforcement for correct responses at three overall rates of reinforcement and using fits to Equation 4 to provide good estimates of log d. EXPERIMENT 2 METHOD Subjects and Apparatus These were the same as in Experiment 1. Procedure The procedure in all three parts of Experiment 2 was identical to that used in Experiment 1 except in two regards. First, in each procedure of Experiment 2, the probability of presenting S, (short duration) was varied from .2 to .9 (.1 to .9 in Procedure 3) over four experimental conditions. Since reinforcement for correct responses was arranged using CRF or single VI schedules, the stimulus-probability variation resulted in variations in the number of reinforcers obtained for each of the two correct responses (McCarthy & Davison, 1979). Second, three different scheduling arrangements were used in Experiment 2. In the first procedure of the experiment, reinforcement was available for each correct response. In the second procedure, reinforcement was delivered for a correct response on the average once every 45 sec, and in the third procedure, reinforcement for a correct response was delivered on the average once every 15 sec. These procedural details, with the sequence of experi-
375
mental conditions, are shown in Table 2. Experiment 1 also provided three data sets which were used in the analysis of Experiment 2. These were data from the same arranged overall-reinforcement rates (CRF, VI 45-sec, VI 15sec) with an Sl-presentation probability of .5 (i.e., Conditions 1, 3, and 5 of Experiment 1). As in Experiment 1, training on an experimental condition continued until the stability criterion had been met. RESULTS AND DISCUSSION The numbers of responses emitted and food reinforcers obtained in each condition are shown in Table 2. Changing the probability of presenting Sl, and hence the relative frequency of reinforcement obtained on the left and right keys, changed the distribution of responses between the two side keys. Changing arranged rates of reinforcement also strongly affected the number of responses per reinforcer and the number of trials per reinforcer. No errors were made in the presence of S2 by Bird 03 in Condition 1. As a result, these data could not be used in the subsequent data analysis. Figure 3 shows the results of Experiment 2 plotted according to Equation 4. The data for each bird for the conditions comprising each set of overall rates of reinforcement (including the appropriate data from Experiment 1) were fit using least-squares linear regression. The equations of the best-fitting straight lines, and the standard deviations of the slopes [(arl - ar2)/2] and intercepts (log d), are shown on each graph. Although the fits of the straight lines shown in Figure 3 are poor, the estimates of log d were considerably improved over the point estimates obtained in Experiment 1. In addition, they were very similar to those obtained in Experiment 1. For the two birds the standard deviations for discriminability (log d) in Experiment 1 were .28 and .35, respectively, but in Experiment 2 they decreased to less than half these values, .12 and .17. However, even with these improved estimates, Figure 3 shows no evidence of a decrease in discriminability levels with decreasing reinforcement rates: that is, the obtained intercepts were not systematically different across the CRF, VI 15-sec, and VI 45-sec conditions. A final important feature of the curve fits shown in Figure 3 is that all six slopes were
DIANNE McCARTHY and MICHAEL DAVISON
376
Table 2 Experiment 2: Sequence of experimental procedures and conditions and the number of sessions training given in each condition. All times are in seconds, and SPP refers to the probability of occurrence of Stimulus 1 (short duration). Also shown are the number of responses emitted and the number of food reinforcers obtained on the left and right keys on both S1 and S2 trials. These data were summed over the last five sessions of each experimental condition.
Procedure
Condition
SPP
Bird
1. CRF
1.
.2
2.
.9
3.
.7
4.
.3
2. VI45
5.
.7
6.
.2
02 03 02 03 02 03 02 03 02 03 02
7.
.9
03 02
8.
.3
02
9.
.7
10.
.3
11.
.9
12.
.1
03 3. VI15
03 02 03 02 03 02 03 02 03
Responses in S, R L
21 3 232 227
178 170 70
34 56 1 1 1 1
17 47 20 22 174 92 304 101 1 1057 2426 28 374 12 622 13 347 32 9 553 166 17 166 39 2 592 747 19 23 56 44 22 48 1263 1656
greater than zero although only two of them (Bird 02 under CRF and under VI 45-sec) reached statistical significance on a criterion of being greater than two standard-deviation units away from a zero slope. These results mean that the sensitivity to reinforcement following presentations of the short duration (ar1, Equation 2) was always greater than sensitivity following presentations of the long duration (ar2, Equation 3). This result is equivalent to a finding of a nonunit isosensitivity curve in detection theory (McCarthy & Davison, 1980b), and it has been ascribed to variance in the decision criterion (Wickelgren, 1968). Although its empirical genesis remains unclear, its effect on point estimates of discriminability (taken using Equation 5) is clear. Consider Figure 4. Assuming a discriminability (log d) value of .5 and no inherent bias (log c = 0), performance during S, and S2 pre-
Responses in 5, L R
4 0 6 9 8 5 9 16 63 189 32 49 11 38 37 116 20 10 11 40 4 15 4 13
228 247 18 22 72 77 179 202 527 507 983 1564 110 202 872 1346 149 251 400 446 71 84 537 543
Reinforcers L
R
Sessions
21 3
228 247 18 22
25 19 24 16 26 16 25 19 22 16 27 15 25 15 24 15 17 15 25 15 25 15 17 16
232 227 178 170 70 48
172 176 36 41 227 227 68 66 166 163 60 66 216 222
7 15
72 77 179 202 78 74 214 209 23 23 182 184 84 87 190 184 34 28 243 235
sentations (Equations 2 & 3) is shown for three different situations on the left side of the figure: (i) reinforcement sensitivity in S1 equals reinforcement sensitivity in S2, i.e., ar1 = a`2 (Graph Al); (ii) reinforcement sensitivity in S1 is greater than reinforcement sensitivity in S2, i.e., a, 1> ar2 (Graph Bl); and (iii) reinforcement sensitivity in S, is less than < a72 reinforcement sensitivity in S2, i.e., (Graph Cl). The center plots of Figure 4 show the stimulus functions (Equation 4) for these three results. First, when a,1 = ar2 (Graph Al), the slope of the stimulus function is zero (Graph A2). Second, when a,,> a.2 (Graph Bl), the slope of the stimulus function is positive (Graph B2). Third, when a,, < ar2 (Graph Cl), the slope of the stimulus function is negative (Graph C2). Stimulus discriminability (log d) is shown in two ways on these graphs. First, as the
a7,
DISCRIMINABILITY AND ABSOLUTE RATE OF REINFORCEMENT * --*
o--o
02
The effect of differing a,1 and
03
a,.2 values
377 on
discriminability is clear. Obviously, in the
C RF
, / first case when a,1 = a,.2, reinforcement sen:/ sitivity has no effect on log d. In the second 1.5 /°case, when ar1 > ar,2, log d will be smaller when the subject is biased toward reporting /'S2 [a negative log-reinforcement ratio, log Y= 36X+ 120 (Rto/Rz)] and larger when the subject is biased 1.0 (.12) (09)0 toward reporting S1 (a positive log-reinforce+ 1-04 o/ Y= / 57X ment ratio). In the third case when a,1 < a,2, (-33) (21) log d will be larger when the subject is biased / /X k , , ° 0 toward S2 and smaller when the subject is .5 biased toward Sl. N The right-hand side of Figure 4 shows the * VI 15-sec 0 0corresponding ROC contours, plotted as normal-deviate scores, for each of the three results. a(31X8) /First, when a,. = ar2, an isosensitivity contour 1 0-- 1*5 with unit slope is obtained, as shown in Graph A3. Second, when a,l > a,.2., the slope of the l ° ROC contour is greater than unity (Graph Y = 22X 1.29 x 1.0 p * (27) ( 19) B3), and third, when arl < ar2, the slope is a less than unity (Graph C3). o In the present experiment, positive slopes ,__________________, _, RF C___
0
(1532,
4), shownof for the stimulus in Figure 3, meanfunction that the(Equation point estimates
cm 2.0 VI__45-sec_/ V I 45-sec 0 I-
the subwhenlonger discriminability will be smaller the dureporting is biased toward ject
Y =52X 1 34 (.19) (.12)
I-4 Ar
* o
/ / ___-_~^ ~ = + 112 ;- t Y10X + 1.12
(.20) (.12)
0 -1-
6
-.8
0
8
LOG OBT RFT RATIO
16
Fig. 3. E:xperiment 2: The logarithm of the response ratio on S, trials minus the logarithm of the response ratio on S2 trials, all divided by 2, as a function of the logarithm of the obtained reinforcement ratio. The plots
corres5pond
with Equation 4. The data shown are
for each biird in all conditions comprising each set of overall rate s of reinforcement (including the appropriate data fri om Experiment 1). The best-fitting straight line by the method of least squares, its equation, and the standarrd deviations of the slope and intercept are shown for ieach bird and for all three overall rates of
ration and larger when it is biased toward reporting the shorter duration. Nevin et al. (1982) did indeed find some extensive and unexplained bias shifts in the presence of noise, which signaled the lower overall rates of reinforcement. But their data cannot be used to assess the presence of unequal sensitivities to reinforcement following presentation of the two stimuli. If the differential sensitivity effect iS due to the type of stimuli used and was the same in the Nevin et al. study as here, higher discriminability in the lower
reinforcement rate (and more biased) com-
ponent would be predicted as most biases were toward reporting the short duration. If, of course, in the Nevin et al. data, a,.2 was greater than arl, (Equation 4), then such biases would predict the lower sensitivity they reported. closure on these possibilities.
reinforceme nt.
difference between the intercepts of the lines for S, and S2 performance in the left-hand
panels, and, second,
as
the intercepts of the
stimulus functions shown in the center panels.
EXPERIMENT 3 This experiment investigated a major procedural difference between Nevin et al.'s (1982) study and the procedure used in Experiments
DIANNE McCARTHY and MICHAEL DAVISON
378
Performance in Si &S2 Al =
1
Stimulus Function li A2
ar2
0
*5 o
*
ROC anatysis
p
s=O 1 N
N
O. 1
I
0-
-
I
rO 0~ N-
Q-
.
B2
0
ar, =7
a
51
I-
s>O
~~ ar2~= .25 N,
0~: 0o
1
0-
Cl
ar, =
725
2 C3 1
C2 s