Third International Symposium on Ultrasonic Doppler Methods for Fluid Mechanics and Fluid Engineering EPFL, Lausanne, Switzerland, September 9 - 11, 2002
SIGNAL PROCESSING FOR ADVANCED CORRELATION ULTRASONIC VELOCITY PROFILER Yousuke Sato1, Michitsugu Mori2, Yasushi Takeda3, Koichi Hishida1 and Masanobu Maeda1 1
Department of System Design Engineering, Keio University, Hiyoshi 3-14-1, Kohoku-ku, Yokohama, Kanagawa, Japan, e-mail:
[email protected] 2 Tokyo Electric Power Co., Inc., Egasaki-cho Tsurumi-ku, Yokohama 230-8510, Japan, e-mail:
[email protected] 3 Paul Scherrer Institute, CH-5232 Villigen PSI, Switzerland & Hokkai University, Div. Mechanical Science, Sapporo, Japan e-mail:
[email protected]
Keywords: high time resolution, signal processing, cross correlation, turbulence measurement
ABSTRACT The objective of the present study is to develop a high-time resolution ultrasonic velocity profiler system by improving a signal processing algorithm and to apply it to turbulent flow measurement. The time resolution of an existing ultrasonic velocity profiler systems is limited to the order of 10 ms at the best due to its signal processing technique, the fact of which needs more than a few tens echo signals to obtain the velocity distribution. In order to improve the time resolution of a Doppler-shift-typed ultrasonic velocity profiler, we have introduced a cross-correlation technique to estimate a time difference between two echo signals of a pair of emissions of ultrasound pulses. We improved a signal processing procedure for a better durability over noise by using following criteria, 1: a threshold of correlation coefficient at 0.95; 2: a threshold of signal amplitude: over 3/128 (in 8bits); 3: exclusive operation to the spurious data that is largely far from average values. A pipe flow was measured by the present high-time resolution ultrasonic velocity profiler system with new signal processing algorithm. Hydrogen bubbles and nylon particles were used as a tracer. A comparison showed that a good agreement was attained, although data rate for hydrogen bubbles was over 90% and nylon particles were less than 10% at the center of pipe region. Moreover, comparing with LDV, a relative error falls within ±1.5%. In conclusion, we could improve the time resolution of the high-time resolution ultrasonic velocity profiler up to 1 ms to obtain a line profile of velocity distribution and demonstrated a possibility to realize a measurement of a smaller time scale velocity fluctuation in flows.
1. INTRODUCTION The acquisition of instantaneous velocity fields is of utmost importance in understanding flow mechanism. An ultrasonic velocity profiler called as UVP has been developed for this purposes [1][2]. The principle of UVP is to use a pulsed ultrasonic echography together with a derivation of instantaneous Doppler shift frequency of echo. One of its measurement capabilities is capturing an instantaneous velocity distribution on one line. Furthermore, the UVP is applicable to opaque liquid objects and through the wall of closed vessel without making a window. By taking these advantages, UVP measurement clarified a transient process in a rotating Taylor-Couette system successfully [3]. To measure multi-dimensional two-phase flow characteristics, a measurement system combining UVP with a video data processing unit was developed [4], and such characteristics as void fraction profiles of bubbly concurrent flow were investigated [5]. Time resolution of UVP greatly depends on a signal processing algorithm, and in the existing UVP based on pulse Doppler method, it is difficult to detect the Doppler shift from a single
-5-
Third International Symposium on Ultrasonic Doppler Methods for Fluid Mechanics and Fluid Engineering EPFL, Lausanne, Switzerland, September 9 - 11, 2002
echo and it requires dozens echo receptions. Therefore, time resolution is limited to the order of 10 msec at the best and is insufficient for the measurement of turbulence characteristics. The objective of the present study is to realize high time resolution measurement which is better than 1 ms by introducing a new signal processing method other than the Doppler shift method. A cross correlation method was adopted to determine a time difference - velocity (tracer movement) - between two successive echoes. Although this method is able to take a large signal shift compared to the Doppler method, the waveform needs to be characterized to differentiate a signal in order to detect the signal shift. Thus, four-cycle sinusoidal tone burst was used. Since data amount obtained is increased from one pair of pulses through the following signal validation processes, it enables to determine velocity by a few times of echo reception, i.e. time resolution is extremely improved. The present system consists of three enhanced PC boards and a transducer. Both a pulsarreceiver and an analogue to digital converter up to 2GS/s are synchronised by Trigger signal. Trigger timing is configured such that following two processes are repeated. 1: Emitting several successive trigger signals; 2: Leaving constant time interval. Herewith, since data amount was increased, velocity distribution that improved data rate was obtained with durability over noise by the following processes. 1: threshold of correlation coefficient: over 0.95; 2: threshold of signal amplitude: over 3/128 (in 8bits); 3: exclusive operation to the unusual data which separated most from an average value. It is also advantageous to be able to adjust time resolution sufficiently depending on the time scale of fluctuation.
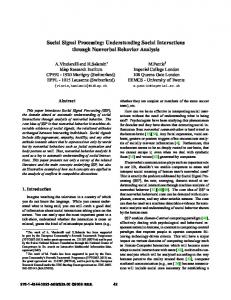
2. PRINCIPLE 2.1 Determination of Velocity Profiles A basic concept of the principle of the present signal processing technique is illustrated in Fig. 1. Sinusoidal ultrasonic tone-burst are emitted from the transducer with a short time interval (∆t) along a measuring line, and then the echo signals that is reflected from the same minute tracer bulk are detected by the same transducer. This generates two time series of echo signals with the time coordinate being set at the emission of the ultrasonic pulse. Position x is determined from time delay τ between emission of pulse and reception of echo by echographic relation as expressed in Eq.1. A displacement of the tracer bulk ∆x during the burst interval ∆t gives a velocity of the bulk, which is reflected on the echo signal as a time shift ∆τ. Eq.2 figures out this relationship.
Fig. 1 Determination of time difference between two local echo
-6-
Third International Symposium on Ultrasonic Doppler Methods for Fluid Mechanics and Fluid Engineering EPFL, Lausanne, Switzerland, September 9 - 11, 2002
2.2 Interpolation of Cross-Correlation for an accurate measurement of time delay The time shift ∆τ at each position would be obtained by cross correlation from two time series of local echo signals, whereby much higher sampling rate, 100 MS/s, is used to build such a time series in the present work. When two signals include the echo from the tracer bulk very clearly and characteristically, a time delay ∆τ is easily determined from computation of cross correlation function because of characterized echo signals with 4-cycle successive tone-burst. However even in this case, the sampling rate is still insufficient to determine the velocity at the position with high accuracy due to its discrete nature of the signal. To improve this, we adopted an interpolation scheme that has been established in the signal processing by LDV [6]. We take a cross-correlation function with the reference window, which is a part of reference echo signals, and the length of the time series is 1 µs, and the search window in search echo signals. The integer index of the peak in the correlation map k is obtained as the discrete value and we obtain a modified time difference by using Gaussian Curve Fitting to find the ∆τ corresponding to the real peak value as shown in Eq. 3.
This adjustment for interpolation of discrete data minimizes a bias error. The present technique enables us to improve the resolution of velocity evaluation. We repeat this procedure over the measurement range 2.3 Trigger Timing The measurement system was set up such that signal emission, echo reception and its digitisation be synchronized with the trigger signal. The timing is configured such that the following two processes are repeated as shown in Fig. 2. 1: Emitting several, usually 2~4, successive trigger signals; 2: Leaving constant time interval. Time during two successive trigger signals is called Duration Time, which is equivalent to ∆t in measurement principle. Duration Time and constant time interval are combined and called Interval Time, that corresponds to a time resolution of the system.
Fig. 2 System controlling
By configuring like this, two advantages are expected: the first is an increase of an amount of total data by increasing the number of time series of echo to be used, and the second is a flexible adjustment of time resolution. 2.4 Validation of Echo Signals When a concentration of the tracer particles is low, we receive only weak echo and the signal to noise ratio is low. Furthermore, when the peak of the computed cross correlation function between two echo signals is not clear or the peak value is quite low, an accurate measurement of the velocity is difficult. The objective of the present study is to develop a signal processing procedure of velocity measurement with durability over noise for high adaptability in a real flow place. Therefore, we employed three rejection schemes to validate the echo signal. 1: threshold of signal amplitude value; 2: threshold of correlation peak value; 3: exclusive operation to the unusual data which separated largely from average value.
-7-
Third International Symposium on Ultrasonic Doppler Methods for Fluid Mechanics and Fluid Engineering EPFL, Lausanne, Switzerland, September 9 - 11, 2002
As the amplitude of the echo signal is strongly dependent on various experimental and measurement configurations such as material properties of reflector, its concentration, velocity levels, setting angle of transducer, electronics etc., there is no realistic prescription to determine the threshold values for signal amplitude as well as peak value of cross correlation function. Also, there is no realistic prescription to determine the unusual data to be excluded.
3. EXPERIMENTAL APPARATUS 3.1 Measuring System Measurement system was built based on PC. Devices installed were pulsar-receiver board, analog to digital converter board, a trigger board and a transducer. To synchronize pulser receiver and analog to digital converter, we built a trigger board to send an external signal. The trigger board has a 1 MB onboard memory (RAM-TABLE). The software here could set a signal pattern in the memory of Trigger Board with 100 ns time resolution. Using this Trigger Board, we could attain any desired Interval Time and Duration time. Fig. 3, 4 and Table.1, 2, 3, 4 show system configuration and parameters, and each system Board specification.
Fig. 3 Measurement System
Fig. 4 Time sequence of Trigger Table. 2 Specifications of Analog to Digital Converter
Table. 1 Specifications of Transducer resonance frequency active diameter overall diameter overall length near field length divergence half angle
4MHz 5mm 8mm 60mm 16.9mm 2.2º
Table. 3 Specifications of Ultrasonic Pulser/Receiver Board Pulser pulse type frequency range pulse width jitter width
gated sinusouid 50kHz to 20MHz 20ns to 26µs ±1/frequency range
Receiver bandwidth gain dynamic range
50kHz to 20MHz 0dB to 70dB +70dB
sampling frequency 1kHz to 500MHz resolution 8bits on board memory size 512MB internal sampling clock accuracy 200ppm DC accuracy 2%
Table. 4 Set of present system parameters US basic frequency pulse reptiiton rate maximum measurable range maximum measurable velocity velocity resolution spacial resolution number of channels bursts per profile time resolution profile storage
4 MHz 150µs maximum 11cm 60cm/s 50mm/s 0.75mm 150 1~3 150µs maximum Max: 34133
3.2 Flow Test Section We examined the measurement system applying to a water pipe flow as shown in Figure 5. An ultrasonic transducer of 4 MHz was installed in the outside of the pipe wall with the 45º inclination. This pipe was made of acrylic polymer and the thickness of the pipe was 2 mm;
-8-
Third International Symposium on Ultrasonic Doppler Methods for Fluid Mechanics and Fluid Engineering EPFL, Lausanne, Switzerland, September 9 - 11, 2002
thin enough for the ultrasound pulses to pass through this pipe wall. The inner diameter of the pipe was 44mm and the channel around the pipe was filled with water to eliminate a spurious echo returning to the transducer. The experiments were performed at the Reynolds number of 12000 and 14000. The measurement position was 19D from the entrance of the pipe. For comparison of the effect of echo amplitude, two kinds of tracers were used. They were Hydrogen bubble, 10~20 µm particle diameter and nylon powder, 3~30 µm particle diameter.
Fig. 5 Test Section
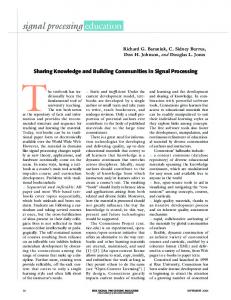
4. RESULTS AND DISCUSSION 4.1 Mean Velocity and Data Rate In Fig. 6, one result is shown in comparison with LDV measurement. It was measured at the same line and for the same velocity component. In LDV, 3000 data are averaged at each measurement points. In the present new-typed high-time resolution ultrasonic velocity profiler, 3000 profiles were averaged, and time resolution was 10ms with ∆t of 200µs. Also, threshold of the present high-time resolution ultrasonic velocity profiler was set to 0.95 (correlation coefficient) and 3/128 (quantized signal amplitude). Only hydrogen bubble was employed as tracer in this measurement. LDV and the present high-time resolution ultrasonic velocity profiler measurements show excellent agreement for averaged velocity distribution and RMS value distribution. In total a difference outside the boundary layer lies in less than 5%. Experimental accuracy (RMS value / average) at the center of the pipe is in the order of 2%. This result indicates that high accuracy measurement on LDV-level was realised in line measurement. Additionally, data rate reached to the order of 90% except near wall region.
Fig. 6 measurement result of average profiles (left) and data rate through the threshold (right) 4.2 The effect of tracer particles When applying the present high-time resolution ultrasonic velocity profiler for an actual working flow, hydrogen bubbles cannot not be employed as a tracer. Using a solid particle is also restricted to very small quantity in many cases. The experiments were made in
-9-
Third International Symposium on Ultrasonic Doppler Methods for Fluid Mechanics and Fluid Engineering EPFL, Lausanne, Switzerland, September 9 - 11, 2002
considering these cases. Amount of data was increased intentionally by emitting successive three times of trigger signal and creating 3 time series of echo in Interval Time, and then, averaging five points on the side of the time series of echo, the unusual data that is separated from average value were excluded. Although data rate was very low, near value resulted by hydrogen bubbles was obtained by this exclusive validation method.
Fig. 7 comparison of data rate
Fig.8 Velocity distribution obtained in low data rate
4.3 Time Series of Measurement Higher time resolution measurement was made by setting both Interval time and Duration time as 150µs. Fig.9 shows five successive velocity distributions and 400 times successive velocity data at the center of pipe and near wall region. For this time resolution, it was observed that velocity profiling was successful. And, variation is small at the center of pipe. In contrary to this, periodical variation is observed in near wall region.
Velocity (m/s)
Fig. 9 Instantaneous Velocity Distribution
5. CONCLUSION The high-time resolution ultrasonic velocity profiler was developed with the signal processing method based on cross correlation; alternative to pulsed Doppler method. The present signal processing method enables us to control the repetition of echo reception with only two times. By this method, we could develop a noble velocity measurement system with high time
- 10 -
Third International Symposium on Ultrasonic Doppler Methods for Fluid Mechanics and Fluid Engineering EPFL, Lausanne, Switzerland, September 9 - 11, 2002
resolution. Circular pipe flow was measured with the present high-time resolution ultrasonic velocity profiler system. In comparison to LDV, the relative error of average velocity is less than 2% and RMS value is less than 16% at the center of the pipe. Applicability of the cross correlation method was confirmed. By adjusting acquirement of echo signal, the amount of signal data was increased. Even in the case using nylon particles, which showed only weak reflection echo, we obtained near value of velocity distribution measured using hydrogen bubbles. The high time resolution measurement in 150µs was made. We obtained velocity distribution successively. This measurement is considered to be reliable because the measurement results by the present high-time resolution ultrasonic velocity profiler system showed excellent agreement with those of LDV’s.
REFERENCES [1] William D.BARBER, JEFREY W.EBERHARD and STEVEN G.KARR, A New Time Domain Technique for Velocity Measurements Using Doppler Ultrasound, IEEE Transactions of Biomedical Engineering, Vol.BME-32, No.3, P213-229, 1985 [2] Y.TAKEDA, Development of Ultrasound Velocity Profile Monitor (UVP) and its Experience, 4th International topical meeting on Nuclear Reactor Thermal-Hydraulics, P418423, 1989 [3] Y.TAKEDA, Quasi-periodic state and transition to turbulence in a rotating Couette system, Journal of Fluid Mechanics, 389, P81-99, 1999 [4] M.ARITOMI and S.ZHOU, Measurement System of Bubbly Flow Using Ultrasonic Velocity Profile Monitor and Video Data Processing Unit, Journal of Nuclear Science and Technology, vol.33, No.12, P915-923, 1996 [5] S.ZHOU, Y.SUZUKI, M.ARITOMI, M.MATSUZAKI, Y.TAKEDA and M.MORI Measurement System of Bubbly Flow Using Ultrasonic Velocity Profile Monitor and Video Data Processing Unit, (3) Comparison of Flow Characteristics between Bubbly Concurrent and Countercurrent Flows, Journal of Nuclear Science and Technology, vol.35, No.5, P335343, 1998 [6] Y.OZAKI, T.KAWAGUCHI, Y.TAKEDA, K.HISHIDA and M.MAEDA, High Time Resolution Ultrasonic Velocity Profiler, Experimental Thermal and Fluid Science, Volume 26, Issues 2-4, P253-258, June 2002
- 11 -