May 29, 2008 - detect activities with a signature-based detection approach. ..... digital signal processing, statistical estimation, control theory, artificial intelligence, ... presented to the decision maker, who may be under time pressure and/or.
Institutionen för kommunikation och information Examensarbete i datavetenskap 30hp (Information Fusion 7,5hp) D-nivå Vårterminen 2008
Signature-based activity detection based on Bayesian networks acquired from expert knowledge Farzad Fooladvandi
Signature-based activity detection based on Bayesian networks acquired from expert knowledge Submitted by Farzad Fooladvandi to the University of Skövde as a dissertation towards the degree of M.Sc. by examination and dissertation in the School of Humanities and Informatics. 2008-05-29 I hereby certify that all material in this dissertation which is not my own work has been identified and that no work is included for which a degree has already been conferred on me. Signature: _______________________________________________
Supervisors: Fredrik Johansson and Christoffer Brax
Signature-based activity detection based on Bayesian networks acquired from expert knowledge Farzad Fooladvandi
Abstract The maritime industry is experiencing one of its longest and fastest periods of growth. Hence, the global maritime surveillance capacity is in a great need of growth as well. The detection of vessel activity is an important objective of the civil security domain. Detecting vessel activity may become problematic if audit data is uncertain. This thesis aims to investigate if Bayesian networks acquired from expert knowledge can detect activities with a signature-based detection approach. For this, a maritime pilotboat scenario has been identified with a domain expert. Each of the scenario’s activities has been divided up into signatures where each signature relates to a specific Bayesian network information node. The signatures were implemented to find evidences for the Bayesian network information nodes. AIS-data with real world observations have been used for testing, which have shown that it is possible to detect the maritime pilot-boat scenario based on the taken approach. Key words: Signature-based detection, Bayesian networks, knowledge elicitation, information fusion, maritime situation awareness
Contents 1
Introduction ......................................................................................1
2
Background .......................................................................................2 2.1
Information Fusion .......................................................................................... 2
2.2
Activity detection systems ............................................................................... 4
2.2.1
Signature-based detection systems......................................................... 4
2.2.2
Anomaly-based detection systems ......................................................... 5
2.2.3
Hybrid detection systems ....................................................................... 6
2.3
2.3.1
Statistical anomaly detection.................................................................. 7
2.3.2
Machine learning based detection .......................................................... 7
2.4
4
5
Bayesian Networks .......................................................................................... 8
2.4.1
Knowledge Elicitation.......................................................................... 12
2.4.2
Ontologies ............................................................................................ 13
2.5
3
Activity detection techniques .......................................................................... 6
AIS-systems................................................................................................... 14
Problem............................................................................................15 3.1
Problem domain............................................................................................. 15
3.2
Problem description ....................................................................................... 16
3.3
Problem demarcation ..................................................................................... 16
Method .............................................................................................17 4.1
Summary of methods..................................................................................... 17
4.2
Identify a maritime scenario .......................................................................... 17
4.3
Build and learn a Bayesian network .............................................................. 18
4.4
Evaluate the Bayesian network...................................................................... 19
Realization and result.....................................................................20 5.1
Identify a maritime scenario .......................................................................... 20
5.1.1 5.2
Result of the open interview................................................................. 20
Build and learn a Bayesian network .............................................................. 25
5.2.1
Qualitative part of the Bayesian network............................................. 25
5.2.2
Quantitative part of the Bayesian network........................................... 27
5.2.3
Overview of the signature-based detection software ........................... 31
5.2.4
Implementation of the signature-based detection software.................. 32
5.3
Testing and verification ................................................................................. 34
I
6
7
5.3.1
Testing the signature-based detection software ................................... 34
5.3.2
Test results............................................................................................ 36
5.3.3
Verification of test results and the Bayesian network model............... 38
5.3.4
Verification of the knowledge elicitation tool...................................... 39
Related work ...................................................................................40 6.1
Detection of vessel anomalies – a Bayesian network approach .................... 40
6.2
Maritime situation monitoring and awareness using learning mechanisms .. 40
Conclusions......................................................................................41 7.1
The Bayesian network and the signatures ..................................................... 41
7.2
The knowledge elicitation tool ...................................................................... 41
7.3
Future work.................................................................................................... 42
Acknowledgements .................................................................................43 References................................................................................................44
II
Introduction
1 Introduction The maritime industry is experiencing one of its longest and fastest periods of growth. This phase is due to the past 10 years that has seen an annual growth rate of 3.8% in transport volume, and in the past 3 years this growth rate has almost doubled (Skjong and Soares, 2008). Hence, the global maritime surveillance capacity is in a great need of growth as well. This stems according to Hoye et al. (2008) from the levels of hazardous cargo transports, smuggling of goods and humans, and growth in global terrorism. Due to these activities there is an ongoing implementation of new cooperative systems for ship reporting to meet emerging requirements for detection, identification, and tracking. The detection of unusual vessel activity is an important civil security maritime domain awareness (MDA) objective. This can be particularly challenging in environments with much vessel traffic. According to Bomberger et al. (2006), vessel activity can be considered at different levels, from atomic events (represented by the current state of a vessel in relation to its environment) to long-term behaviours (which could be conceived of as sequences of events). Maritime organisations involving both the civilian and the military domain often have access to a number of surveillance sources. The ability to make full use of these surveillance systems, e.g., for detecting events and behaviours, is limited due to their inability to fuse data and information from all sources in a timely, accurate, and complete manner. Automated association of sensor information with non-sensor information is an important functionality for surveillance systems, which can help with such tasks as search and rescue, monitoring of specific regions and identifying ship activities that may threaten environment or national security (Lefebvre and Helleur, 2004). This is the task of information fusion, which involves combining data and information from multiple sources (e.g., sensors and domain experts). Furthermore, the task involves relating this information to achieve improved accuracy and more specific inferences which could not be achieved by the use of a single sensor alone (Hall and Llinas, 1997). Information fusion in general and the military domain in particular contains a high degree of uncertainty. An important technique for uncertainty management is probability theory. A technique such as neural networks is a way of approaching uncertainty, but an alternative to this is Bayesian networks (Johansson and Falkman, 2006). Given the diverse uncertainty management techniques, this thesis will consider a Bayesian network approach to activity detection in the maritime domain. There is a need to investigate if different techniques in combination with diverse approaches can help in detecting activities. Section 2 considers the domain of information fusion, activity detection systems and also Bayesian networks. The Bayesian network’s part will also present the field of knowledge elicitation and the domain of ontologies in relation to Bayesian networks. The last part of section 2 mentions the Automatic Identification Systems. In section 3, the aim and objectives of this thesis are presented. Section 4 explains the methods that are assigned to each of the objective. Section 5 will describe how the objectives were realized and the results of each objective will also be presented. In section 6, related work will be compared to the work in this thesis. Section 7 presents the conclusions of this thesis and also suggestions for future work.
1
Background
2 Background In subsection 2.1, information fusion is described to introduce the reader to the overall domain of this thesis. Subsection 2.2 will introduce the reader to different kinds of activity detection systems and how they differ from each other. Thirdly, subsection 2.3 will consider the different techniques that are used for realizing an activity detection system. Subsection 2.4 introduces Bayesian networks and the underlying concepts. This subsection also describes the domains of knowledge elicitation and ontologies with relation to Bayesian networks. Finally, the AIS-system will be mentioned and described in subsection 2.5.
2.1 Information Fusion Information fusion (sometimes referred to as data fusion) is, according to Hall and Llinas (1997), when data is combined from multiple sources to achieve improved accuracy and more specific inferences which cannot be achieved by the use of a single source alone. Information fusion is hardly a new concept: humans and animals use this concept continuously through the use of senses. By using our senses, both animals and humans can achieve a more accurate assessment of the surrounding environment and identify threatening factors that improve their chances of survival (Hall and Llinas, 1997). The relation to the nature is clear and information fusion to some extent tries to apply phenomena from the nature to actual systems. An example from the nature could be where a snake detects an animal by using different senses to classify its prey and based on the classification decide to neutralize the prey or deviate from it. There is however different techniques, drawn from a diverse set of disciplines, that together contribute to the field of information fusion. These techniques include: digital signal processing, statistical estimation, control theory, artificial intelligence, and classic numerical methods. The military domain has, according to Hall and Llinas (1997), traditionally and historically dominated the use and the development of information fusion methods. But this trend has changed and more and more civilian domains are applying the concept of information fusion to their disciplines. The widespread use of information fusion applications can be acknowledged throughout different domains. When it comes to the military domain, there are applications such as: automated target recognition, guidance for autonomous vehicles, remote sensing, battlefield surveillance, and automated threat recognition systems, such as identification-friend-foe-neutral (IFFN) systems. On the other hand, nonmilitary information fusion applications include monitoring of manufacturing processes, condition based maintenance of complex machinery, robotics, and medical applications (Hall and Llinas, 1997). The Joint Directors of Laboratories (JDL) Data Fusion Working Group created a common reference ground in 1986 when they proposed a model for the domain of information fusion. Reasons for this had to do with the lack of a unifying terminology and this caused problems such as when knowledge were to be transferred to other domains. The JDL process model is, according to Hall and Llinas (1997), a functionally oriented model for the information fusion domain, where the intent is to provide a general and useful ground across many application domains. This conceptual model identifies the processes, functions, categories of techniques, and specific techniques intended for information fusion. An important factor to consider is that the JDL process model is not a model which one should follow when developing 2
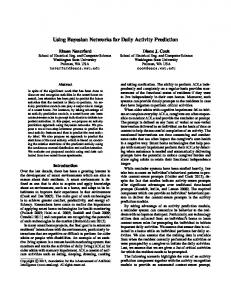
Background an information fusion system. Instead, it is intended to provide an overview of the different levels where data is fused into information and should work as a vehicle for communication. As figure 2.1 illustrates, the JDL process model consists of six levels (zero to five). The levels will be explained to clarify the JDL process model and provide a basis for how the model is structured and interpreted.
Figure 2.1 JDL process model (after Hall and Llinas, 1997) •
Level 0: Sub-object assessment has, according to Bossé et al. (2007), the main task of distributing and allocating data to different processes. Data and signals are preprocessed for further levels and this may involve reducing noise/jitter in data, and also filtering. Source preprocessing may also involve forcing the information fusion process to concentrate on data which is relevant in the present situation.
•
Level 1: Object assessment involves associating data and achieve refined representations of entities/objects. In other words, entities are tracked and information of interest is assigned to them for further level processing (Hall and Llinas, 1997).
•
Level 2: Situation assessment deals with describing situations based on relationships between entities and environments. This can for instance be done by aggregating certain entities together. In other words, the task here is to determine the higher level of “what is going on” (Bossé et al., 2007).
•
Level 3: Impact (threat) assessment is the task of estimating and projecting the current situation into the future to consider consequences. The main concern in this level is according to Hall and Llinas (1997) to predict if the intent of an entity/adversary is to affect our situation, environment or resources.
•
Level 4: Process refinement handles, according to Hall and Llinas (1997), the optimization of the fusion process and the utilization of sensors. The processes here monitors and adapts parts or a whole fusion process, therefore they are often called meta-processes, i.e., a process that operates on other processes.
•
Level 5: Cognitive refinement, also referred to as user refinement, is where the interaction between human and machine is monitored and refined, and such 3
Background aspects as visualization and the user is considered. It is according to Riveiro (2007) important to know how to present information to the user because the information is not only handled and processed by computers but also presented to the decision maker, who may be under time pressure and/or overwhelmed by information overload. When it comes to user aspects, the primary concern is to involve the user as an active component in the fusion process, e.g., to interact with the system (Hall et al., 2001). Level 0 and 1 are referred to as low-level information fusion and as explained, the main task here is to identify entities, e.g., interesting objects in the environment, and assigning attributes to them. This process involves measurement management, entity kinematics estimation (e.g., speed and direction) and entity type estimation, e.g., type classification (Hall and Llinas, 1997). For this sort of processing there are certain methods that have been shown to work appropriately, and these are: Kalman filtering, Particle filtering and Multi hypothesis tracking (Hall and Llinas, 1997). The rest of the levels (level 2+) are referred to as high-level information fusion and the main tasks here are: aggregation e.g., relating interrelated entities, plan recognition e.g., estimating intention of entities, estimating consequences of current intentions and states of the world and also own resources, improving input through refining fusion processes and sensors, monitor and refining the interaction between human and machine (Hall and Llinas, 1997). There are different techniques when attempting to achieve these tasks: rule-based reasoning, logic-based methods, Bayesian networks, fuzzy logic, and neural networks. The general goal of high-level information fusion is according to Bomberger et al. (2007) to combine the processed data that low-level information fusion produces with existing knowledge, and this is performed in order to achieve situation awareness. Situation awareness is a key goal of high-level information fusion and it is defined as: “Situation awareness is the perception of the elements in the environment within a volume of time and space, the comprehension of their meaning, and the projection of their status in the near future.” (Endsley, 1995, p.36).
2.2 Activity detection systems The three approaches for detecting activities or anomalies that will be described here are signature-based detection, anomaly-based detection and a hybrid variant. The difference between these three approaches is that a signature-based detection system identifies patterns in data presumed to be of particular interest. The patterns are referred to as signatures which are specific activities/behaviours which are of interest to detect. An anomaly-based detection system compares activities/behaviours against a normal baseline, e.g., the normal behaviour of entities (Patcha and Park, 2007). The third approach combines the techniques of the two detection systems to form a hybrid system. 2.2.1
Signature-based detection systems
A signature is a representation of a known activity (normal or abnormal) which is of interest to detect. Signature-based detection systems rely on predefined signatures reflecting activities that are of importance to detect. The signature-based detection system looks for specific patterns/behaviours in incoming events and tries to match these with predefined signatures, e.g., activities that are of interest. In other words, decisions are according to Patcha and Park (2007) made based on the knowledge acquired from the occurred events. Normal or abnormal activities can be defined and 4
Background compared with observed activities irrespective of the normal behaviours of an entity. The main benefit with signature-based detection systems, compared to anomaly-based detection systems, is according to Patcha and Park (2007) the detection of activities/behaviours, which is performed in a reliable fashion. This is illustrated through the generally low false alarm rate that is produced. A system observer can easily determine precisely which abnormal activity an entity is experiencing, due to the presence of specific activity signatures. No alarms will be raised if the activity or behaviour that is searched for is not included in the database and/or the log files containing signatures of interest. One of the biggest problems with signature-based detection systems is maintenance of state information of signatures. This problem can according to Cho and Cha (2004) occur when an entity changes its previous known illegal activity to a new one that is not considered as abnormal. Another drawback is that the signature-based detection system must have a signature defined for all of the possible activities that an entity may possess e.g., essentially the activities of interest. This yields a direct consequence which demands frequent signature updates to keep the signature database and/or log files up-to-date (Patcha and Park, 2007). 2.2.2
Anomaly-based detection systems
An anomaly is defined as a deviation from an expected behaviour (Khatkhate et al., 2007). According to Li et al. (2006), anomaly-based detection usually involves a set of attributes, e.g., duration, average speed and location. Such attributes, when combined, can be crucial in decision making. For instance, if there had been information that an entity made its movement late at night and at very slow speed, the combination of all such attributes is very revealing in anomaly-based detection. According to Bomberger et al. (2006), the objectives that are of importance to anomaly-based detection systems are to learn what normal activities are and to detect deviations from normalcy. There are certain factors that one has to consider when defining normal behaviour. For instance, factors such as: entity class, different contexts, weather conditions, and tidal status may vary the notion of normalcy in some instances. Discovering and accounting for such factors that change normalcy (the change in itself is legitimate, but the results of it may be in conflict with the defined normalcy) is of essential importance (Bomberger et al., 2006). One obvious producer of such factors is the environment that affects many parameters of entities residing in it. An anomaly-based detection system creates a baseline profile of the normal activity at the first instance. Any activity that deviates from the created baseline profile will be treated as abnormal. This will result in an anomaly which the anomaly-based detection system will notify of by setting of alarms. Such systems offer several benefits compared to signature-based detection systems. Firstly, the system is according to Patcha and Park (2007) based on customized profiles; this approach will convey a degree of uncertainty upon entities in the sense that an entity really never knows what activities it can perform without being detected e.g., setting of alarms. This approach will in fact according to Giacinto et al. (2008) also make it possible to detect previously undetected or unthought-of activities. The reason for this benefit is that anomaly-based detection systems are not based on specific signatures representing known activities. Hence, whatever deviates from normalcy will be judged as an anomaly.
5
Background Anomaly-based detection systems, however, also suffer from several drawbacks. According to Patcha and Park (2007) the system must go through a training period where baseline profiles are created by determining and defining normalcy of a certain entity. Creating a baseline profile is a challenging task because of the difficulties that exists. One of such difficulties is that if the baseline profile is created inappropriately then the performance of the anomaly-based detection system will suffer. The maintenance of the baseline profiles can be time-consuming since anomaly-based detection systems are looking for anomalous activities rather than activity signatures. Hence, they are prone to be affected by time-consuming false alarms (Patcha and Park, 2007; Giacinto et al., 2008). The anomaly-based detection system can learn normal events through training with a set of observations that reflect routine activity of entities. The observations should also contain sufficient numbers of examples from all the contexts in which entities will be required to operate in. This is of essential importance because of the factors that can vary the normalcy. However, this is according to Bomberger et al. (2006) not mandatory because the learning system can in fact adapt at a later point in time, either autonomously or through operator input, e.g., expert knowledge. The human operator may guide the learning of the system by letting the system flag abnormal activities so that they could be reviewed. The system performance can gain a lot by this procedure, where an operator labels events as threatening or harmless, which in fact can trigger learning. When behaviours and/or contexts change, learning can be performed in a semi-supervised fashion, where the operator shares his/her experience without an intensive interaction (Bomberger et al., 2006). The main reason to why anomaly-based detection systems are not deployed is their inability to suppress false alarms. This is also the primary and probably the most important challenge that needs to be met by different strategies to reduce the high rate of false alarms (Patcha and Park, 2007). 2.2.3
Hybrid detection systems
As mentioned before, a hybrid or compound detection system combines techniques from both signature-based detection and anomaly-based detection systems. The hybrid detection system is according to Patcha and Park (2007) basically inspired from a signature-based detection system, where it makes decisions using a “hybrid model”. The hybrid model is based on both the normal and abnormal activity of an entity. Anomaly-based detection techniques that are applied will aid in the detection of new or unknown activities while the signature-based detection technique will detect known activities. The approach that involves combining multiple activity detection technologies into a single system can, according to Patcha and Park (2007), theoretically produce a much stronger activity detection system (of both normal and abnormal activities), but the resulting hybrid systems may not always be better. Although different activity detection technologies monitor certain activities in different ways, the major challenge here is to build a hybrid system that, based on different technologies, can interoperate in an effective and efficient way.
2.3 Activity detection techniques An activity detection approach usually consists of two phases: a training phase and a testing phase. In the former, the baseline profile is defined; in the latter, the learned 6
Background profile is applied to new data, in order to examine the ability of the activity detection system to find activities of interest. In this subsection two different techniques that have been proposed for activity detection will be briefly presented. These include statistical anomaly detection and machine learning based techniques. 2.3.1
Statistical anomaly detection
Statistical methods for behaviour/activity detection produce profiles of entities by monitoring their behaviour. Statistical approaches to behaviour/activity detection have a number of advantages and also some drawbacks. Like most activity detection systems, statistical techniques do not require the prior knowledge of entity behaviours. As a consequence, such systems have the capability of detecting very diverse activities. According to Patcha and Park (2007), statistical approaches can provide accurate notification of activities that are abnormal and which also occur over extended periods of time. One of the drawbacks with statistical anomaly detection is that the thresholds that balance the odds of false alarms are hard to establish. Furthermore, according to Patcha and Park (2007), statistical methods need accurate statistical distributions and cannot purely be used to model all behaviours. 2.3.2
Machine learning based detection
The ability of a system to learn and improve its performance on a certain task or group of tasks over time is according to Patcha and Park (2007) an associative definition of machine learning. Machine learning is similar to statistics in the sense that it aims to answer many of the same questions. However, unlike statistical approaches, machine learning focuses on building a system that improves its performance based on previous results, instead of focusing on understanding the process that generated the data (Patcha and Park, 2007). In other words, machine learning facilitates the ability to change execution strategy when new information is acquired. A Bayesian network (BN) is a graphical model that encodes probabilistic relationships among variables of interest. BNs in conjunction with statistical techniques have several advantages when it comes to data analysis: A BN can handle instances where data is missing; this is according to Patcha and Park (2007) because of the encoding of interdependencies between variables. BNs have the ability to represent causal relationships and therefore, they can be used in predicting consequences of actions. BNs can also be used to model problems where there is a need to merge prior knowledge with data, this is a result of using both causal and probabilistic relationships. Bayesian statistics have according to Patcha and Park (2007) been adapted to create models for anomaly detection. Neural network based anomaly detection focuses on detecting deviations in behaviours as an indication of an anomaly. The neural network predicts the behaviour of various phenomenons through learning. One of the main advantages of neural networks is according to Patcha and Park (2007) their tolerance when it comes to imprecise data and uncertain information. Also, the ability to infer solutions from data without having prior knowledge of the regularities in the data is basically a beneficial characteristic of neural networks. Another ability of neural networks is that they can
7
Background generalize from learned data and this has made them an appropriate approach to anomaly detection. Real-time learning is hard to achieve with most of machine learning techniques. This can be a consequence of the relative high number of events that occur and the large amount of audit data. Solutions which are based on neural networks suffer from the expensive resource usage due to the need of collecting and analyzing the training data and partly because the weights of the individual neurons have to be manipulated for it to arrive to the correct solution. Another drawback is that when dealing with absence of sufficient data or where there is no learnable function, the neural network can in fact fail to find satisfactory solutions (Patcha and Park, 2007). The procedure of collecting and analyzing the training data, and to manipulate the weights of the individual neurons to arrive to a correct solution yields the lack of speed. However, BNs have some essential advantages over neural networks when it comes to machine learning. According to Johansson and Falkman (2007), BNs can handle incomplete data sets which can be beneficial when there is an absence of complete data sets. Another advantage is the fact that a BN provides a graphical representation and this can aid the observer. An observer can verify and validate models representing a certain scenario or activity and based on that, help to fine-tune what really needs to be detected. In contrast to BNs, neural networks can be compared to a “black box” where input data is inserted and out comes a result. In this way, there really is no flow of activities that an operator can observe. Finally, BNs are good at handling prior knowledge both from audit data and/or expert knowledge. Therefore, in this thesis, a Bayesian network approach will be used when detecting activities.
2.4 Bayesian Networks A Bayesian network (BN) (also referred to as a belief network, probabilistic network, or, somewhat imprecisely, casual network) is according to Jensen and Nielsen (2007) a directed acyclic graph (DAG) consisting of a set of nodes and edges which represents probabilistic (causal) dependences among variables. The set of nodes represents variables with a finite set of mutually exclusive and exhaustive states. The nodes with edges directed/pointing into them are called “child” nodes and the nodes which direct/point edges to other nodes are called “parent” nodes. The DAG represents the structure of dependencies between nodes and gives the qualitative part of a BN. The quantitative part consists of conditional probability tables (CPTs) which are attached to each node. A concept of BNs which is important is the concept of conditional independence. The definition of conditional independence is explained through the concept of dseparation (“d” for “directed graph”): “Two distinct variables A and B are d-separated if for all paths between A and B, there is an intermediate variable V (distinct from A and B) such that either i) the connection is serial or diverging and V is instantiated, or ii) the connection is converging, and neither V nor any of V’s descendants have received evidence.” (Jensen and Nielsen, 2007, p.30).
8
Background
Figure 2.2 d-separation topologies: a) serial connection, b) diverging connection, and c) converging connection. To simplify matters, there will be a brief description of each connection mentioned above. Figure 2.2a shows the serial connection, stating that A has an influence on B, which in turn has influence on C. Evidence about A will influence the certainty of B, which as a result will influence C. The same holds if evidence about C is acquired, and as a consequence A’s certainty will be influenced through B. However, if evidence for B is provided, then the path between A and C will be blocked. This states that A and C becomes independent from each other, and this is referred to as a dseparation given B (Jensen and Nielsen, 2007). When it comes to diverging connections, which can be seen in figure 2.2b, dseparation will occur if A is instantiated. As a consequence the communication between its children (B, C,…,E) will be blocked. To simplify the meaning of the diverging connection, consider a thorough example from Jensen and Nielsen (2007), where one tries to determine the gender of a person through hair length and body structure. In this case A is equal to gender, B is equal to hair length, and C is equal to body structure. If the persons gender is unknown, then maybe the person’s hair length will change our belief of his/her gender, and also influence the nature of the person’s body structure. But in contrast, if evidence of the person’s gender is present e.g., it is a female, thereon the length of her hair don’t provide any extra clue of her body structure. When considering the converging connection, which can be seen in figure 2.2c, it shows that if A changes certainty it opens communication between its parents. In contrast, if A has no evidence, the parents are independent from each other e.g., there is a d-separation. This is because evidence about one of the parents cannot influence the certainties of the others through A. When two nodes are not d-separated, they are called d-connected. A set of nodes composed of node A’s parents, its children, and its children’s parents are in a BN the Markov blanket (MB) of node A, in connection to d-separation. In other words, the MB of node A is the set of neighbouring nodes of A which also separates it from the rest of the BN. The definition of the MB is: “The Markov blanket of a variable A is the set consisting of the parents of A, the children of A, and the variables sharing a child with A.” (Jensen and Nielsen, 2007, p.30). In figure 2.3, the MB is illustrated and the blue (dark) ellipse shows node A’s parents, children, and the nodes sharing a child with A.
9
Background
Figure 2.3 The Markov blanket Conditional probability tables (CPTs) are a solid part of BN and the relationships between different nodes are quantified by the conditional probability distribution. The numbers that are quantified in the conditional probability distribution are encoded into the BN by using a set of CPTs. The numbers that a CPT consists of is often facilitated by either experts determining the numbers or statistical data that is acquired from real life experiments (Johansson and Falkman, 2006). The statistical data can be acquired from a simulator which simulate natural behaviours of certain entities, or the statistical data can be acquired from certain surveillance registers from real life, i.e., from Automatic Identification Systems (see subsection 2.5). Nodes with no parents have unconditional CPTs which only consist of an apriori probability distribution. Nodes with parents have their CPTs define how probable the different states of the given node are based on their parents. The CPTs belong to individual variables, i.e., nodes in the BN. The variables in a BN are either discrete, with at least two states, or continuous. There are also different kinds of variables in a BN, information variables and hypothesis variables (Jensen and Nielsen, 2007). According to Johansson and Falkman (2006), the hypothesis variables are sometimes divided into two types, query variables and intermediate variables. The variables that are directly observable, e.g., data that can be collected from different kinds of sensors, are the information variables. When it comes to hypothesis variables, these variables are not directly observable. Evidence that comes from the information variables are used to infer knowledge about their states. Furthermore, the chain rule of Bayesian networks (see equation 2.1) says that a BN is a representation of a unique joint probability distribution over all the variables represented in the DAG. From this joint probability distribution, marginal and conditional probabilities can be computed for each node of the network (Jensen and Nielsen, 2007). If U is a universe of variables: U = {X1, X2,…,Xn}, the joint probability of U becomes: (2.1) where Pa(xi) stands for the parents of xi. The example below will illustrate the chain rule by applying it on the BN which is illustrated in figure 2.4:
10
Background
Figure 2.4 A Bayesian network (after Jensen and Nielsen, 2007) Figure 2.4 illustrates a BN model which shows causal relationships between salmonella infection, flu, nausea, and pallor. Salmonella and flu can cause nausea, which can in turn cause pallor. The values for each of the BN nodes are assumed to be true and false, e.g., either having an illness or not. From the chain rule we will get joint probability: P(Salmonella, Flu, Nausea, Pallor) = P(Salmonella)P(Flu) P(Nausea|Salmonella,Flu)P(Pallor|Nausea). Various marginal and conditional probabilities can be computed from the joint probability distribution, e.g., P(Xi), P(Xi,|Xj) or P(Xi|e). Generally, e is an evidence: e = {e1,e2,…,em}, that is knowledge/information received from external sources about possible states/values of subsets of BN variables. Evidence can come in two forms, either “hard” or “soft”. When evidence is referred to as “hard”, it refers to the exact state of the variables in consideration. On the other hand, when evidence is referred to as “soft” there is a notion of uncertainty. The evidence is weak which means that the certainty of the evidence resides within 0% < P < 100%. According to Jensen and Nielsen (2007) the appearance of evidence is in the form of a likelihood distribution over the possible states of a discrete variable Xi: if observations are given over a number of variables of the network, evidence can be used to calculate the probability of occurrence of some events. This is referred to as Bayes’ Theorem (see equation 2.2), where according to O’Hagan et al. (2006) one can learn from experience and this is also where prior probability is converted to posterior probability: (2.2) When building a BN for a certain domain, it usually involves three tasks. According to Druzdzel and van der Gaag (2000) the three tasks entails: 1) Identifying variables of importance, along with their possible values; 2) Identify relationships between variables and express these in a graphical structure; 3) Build a Bayesian network to obtain the probabilities required for the quantitative part. Moreover, when considering the learning part, a BN can be learnt from three sources. According to Johansson and Falkman (2007) the sources for learning is from: 1) domain experts; 2) data; or 3) a combination of the two. In either case, the learning of a BN will provide probabilistic information of various sources and even with the large amount of information acquired, there are essentially not enough numbers provided in most cases. These numbers are in fact required for the quantitative part of a BN and 11
Background the process of obtaining the numbers is hard and time-consuming (Druzdzel and van der Gaag, 2000). When audit data is available to the extent that it can be used for covering the probabilistic information need, then other sources may not be necessary. In contrast to the luxury of having enough audit data, domain experts can assist in this vital role of providing their knowledge and beliefs in probabilistic form. The domain expert can also fine-tune the probabilities acquired from other sources, verifying the numbers, and also evaluating the BN. In any case, the role of a domain expert should according to Druzdzel and van der Gaag (2000), not be underestimated in the construction of the quantitative part of the BN. This brings us to the domain of knowledge elicitation. 2.4.1
Knowledge Elicitation
Knowledge elicitation in the context of Bayesian statistical analysis is according to Garthwaite et al. (2005) the process where a person’s knowledge and beliefs about one or more uncertain quantities are formulated into a joint probability distribution. The elicitation task involves a facilitator which is an expert that attempts to help a group of people or an organisation to work towards a common goal. The facilitator’s main task here is to assist the expert who in turn has the task of formulating knowledge in probabilistic form. But the elicitation process is, according to Johansson and Falkman (2007), time-consuming, especially when considering the probabilities needed for the quantitative part of the network. According to Renooij (2001) the process of knowledge elicitation involves the following steps: 1) select and motivate the expert, 2) train the expert on the elicitation process, 3) structure the questions, 4) elicit and document the expert judgements, and 5) verify the results. When working with elicitation there is no straightforward way to achieve it accurately. It can be hard when considering the expert’s knowledge and belief about a single event or hypothesis. This can according to Garthwaite et al. (2005) be a direct consequence of the expert’s unfamiliarity with the meaning of probabilities. Even if the domain expert is familiar with probabilities, it can still be hard to assess a probability value for an event accurately, and with certainty. There are however different ways of asking the expert for his/her probability judgment. The methods that will be described in this thesis are Frequency Estimation method, Gamble method, and Probability wheel method. The Frequency Estimation method is according to Wiegmann (2005) where elicitation questions are stated in frequency format. This is where an expert is asked to state the number of times out of for instance ten that he/she would expect that an event would occur, with respect to certain conditions. The use of graphical probability scales can be used to allow the expert to mark probabilities. A better version of this method is the verbal-numerical probability scale. This method is according to Witteman and Renooij (2003) the bestknown direct method e.g., an expert is asked to explicitly express probabilities, and is easy to understand by the expert. Another benefit with this method is that it provides both a labelled and a numerical choice for the expert to consider. Here the expert can choose to assess his/her probabilities in both verbal and numerical form. The drawback of this method is that endpoints such as probabilities between 0.01 and 0.001 are difficult to address. The opposite of the direct methods are the indirect methods which are also often used. The Gamble method and Probability wheel method are indirect methods and with these methods the probabilities are not explicitly expressed as in direct methods, instead they require a decision from the expert (Renooij, 2001).
12
Background The Gamble method is where an expert is presented with a choice between two lotteries. According to Witteman and Renooij (2003), in one of these lotteries the probability of winning is set by the elicitor. In the other lottery the probability of winning is the probability of the event that is to be assessed. The elicitor varies the former probability until the expert is unconcerned about the two lotteries. After this, the assessment of the probability can be determined. This method suffers according to Wiegmann (2005) of high time cost and is unsuitable or unethical due to its connection to gambling. The next method is the Probability wheel method and here a pie chart is used with a pointer that is able to spin. The pie chart consists of different section, e.g., a red and a green section. The red and green section on the pie chart is adjusted by the elicitor until the expert thinks that the probability of the pointer landing in the red section is likewise to the probability in question, or of the event under consideration. The two indirect methods mentioned will not be further examined in this thesis and for information on these two consider Renooij (2001) and Witteman and Renooij (2003). In whatever way probabilities are elicited from experts, with respect to the method, there needs to be a common understanding about why the elicitation is carried out and also how the probabilities elicited from the expert can help. For the purpose of documenting and sharing the knowledge derived from an expert, an ontology can according to Helsper and van der Gaag (2007) be utilized. This brings attention to the domain of ontologies where concepts and relations between concepts in a certain domain are specified. Furthermore, the use of ontologies may also be necessary for creating a solid foundation for a BN. We have seen that knowledge elicitation is used for the quantitative part of a BN. The following subsection will describe how ontologies can be used for the qualitative part of a BN.
2.4.2
Ontologies
According to Gruber (2007), an ontology defines a set of representational primitives with the purpose of modelling a domain of knowledge. The primitives are typically classes, attributes and relationships between them. The primitives also include information about their meaning. According to Helsper and van der Gaag (2007) the term ontology is used to denote an explicit specification of shared domain knowledge. The purpose of creating an ontology for a domain is to help the involved, e.g., domain experts and developers, to understand the subject at hand, and also to improve communication. The benefits of constructing an ontology is according to Helsper and van der Gaag (2007) that it provides background knowledge about a domain. The structure, concepts, and relations amongst the concepts of a domain are explicitly stated. Furthermore, to help understand the ontology, it can be modelled with different perspectives. This can according to Helsper and van der Gaag (2007) involve modelling the concepts in hierarchies or focus on relations between the concepts. The purpose of this is to allow different actors to concentrate on a particular part of a model instead of trying to understand the whole model. There are different ways of modelling an ontology and in this thesis UML (Unified Modelling Language) will be used for constructing an ontology. UML has according to Cranefield and Purvis (1999), and Kogut et al. (2002) been shown to work well in the construction of ontologies. Once the ontology is considered to be a reliable and agreed-upon representation of the domain, it can be exploited for building the graphical structure e.g., the qualitative 13
Background part of a BN (Helsper and van der Gaag, 2007). Since the ontology is an explicit representation of the domain at hand, it can also work as a solid foundation for a BN.
2.5 AIS-systems The Automatic Identification System (AIS) is a maritime safety and vessel traffic system imposed by the International Maritime Organisation (IMO) (Eriksen et al., 2006). The system broadcasts position reports and short messages with information about the ship and the voyage e.g., vessel identity, position, heading, destination, estimated time of arrival, nature of cargo, etc. This sort of information can assist in monitoring and tracking maritime entities for security reasons. The main motivation for the AIS system was to have the ability to identify vessels on the radar screen. The system has been mandatory on all new ships in international traffic since 1 July 2002, and by the end of 2004 all passenger ships, tankers and other ships of 300 tons or more engaged in international voyages also have it (Eriksen et al., 2006). All ships of 500 tons or more in national voyages will also be covered when the system is fully implemented in 2008. The requirements for the AIS system is according to Eriksen et al. (2006) that it shall: 1) automatically provide to shore stations, other ships and aircraft information, including the ship’s identity, type, position, course, speed, navigational status and other safety-related information; 2) receive automatically such information from similarly fitted ships; 3) monitor and track ships, and 4) exchange data with shorebased facilities. Ships fitted with AIS shall maintain AIS in operation at all times except where international agreements, rules or standards provide for the protection of navigational information. For more technical information consider Eriksen et al. (2006) and Hoye et al. (2008).
14
Problem
3 Problem In this subsection the problem domain will be described and thereafter a more specific description of the aim and the objectives of this thesis will be considered. Finally the demarcation of this thesis will be explained.
3.1 Problem domain The maritime industry is according to Skjong and Soares (2008) growing fast and this is due to the growth of the transportation volume. In consequence to this transition of growth, more and more surveillance is needed to cope with the security threats. The maritime surveillance capacity is in need of growth as well. The main reasons for the needed growth in the maritime surveillance are due to the levels of hazardous cargo transports, smuggling of goods and humans, and growth in global terrorism. When dealing with such reasons one needs to be able to detect the occurrence of unwanted activities. According to Bomberger et al. (2006), the detection of unusual vessel activity is an important civil security objective. For enabling situation awareness in the maritime surveillance, the operators must be supported in detecting anomalous behaviours. There are factors that speak in favour of attempting to automate the detection of activities and not to depend on operators to observe a situation manually. According to Nilsson et al. (2008) operators have limited cognitive ability and this makes it hard to be observant of small changes in a situation. The second factor is that people tend to apprehend situations differently from each other and this yields different views on situation awareness e.g., they notice issues differently from each other. Thirdly, today’s adversaries are less obvious and they are characterised by their activities such as smuggling, which may be difficult to detect. In this thesis, the emphasis will lie on a maritime scenario and the scenario’s activities. This will require knowledge of how vessels behave when performing the actual maritime scenario. According to Nilsson et al. (2008), when dealing with activities that are reoccurring and that are of interest to detect, there is a need for specifying these activities specifically into the surveillance systems e.g., to specify the signatures for that scenario. The reason for doing this is to basically automate the detection of the activity and to let the operators of the surveillance system concentrate on other demanding issues. This will naturally depend on which approach one chooses to utilize when attempting to detect such activities. The approaches mentioned in this thesis were anomaly-based detection, signature-based detection and hybrid systems. The approach that will be utilized in this thesis is the signature-based detection. The signature-based detection approach is based on defining signatures e.g., defining activities which are of interest to detect. According to Patcha and Park (2007), the main benefit of the signature-based detection approach is that it is reliable and this is projected by the generally low amount of false alarms. The disadvantage of the signature-based detection approach is that there is a need for defining all of the activities that are of interest into signatures and also maintaining these. This may not be such a burden if one observes a smaller portion of a larger situation. Hence, the emphasis on a maritime scenario in this thesis will account for a small number of specific activities. When there is present knowledge about what activities a scenario constitutes of, the signature-based detection approach is advantageous in the sense that one can utilize the already known facts about a particular scenario. This is why signature-based detection is
15
Problem chosen as the approach for detecting the maritime scenario in this thesis. For detection of the maritime scenario and its signatures, Bayesian networks (BN) will be utilized. BNs have some advantages over other machine learning techniques. According to Johansson and Falkman (2007) BNs are good at handling incomplete data sets and an observer can verify models easier. There is a high degree of uncertainty in audit data derived from sensors and such. An uncertainty management technique for handling such uncertainty is BN. A BN can be learnt from domain experts, audit data, or both. In this thesis the focus will be on learning the BN from a domain expert. A domain expert can also assist in verifying how well the BN detects the assessed scenario. For the purpose of deriving the prior probabilities in an orderly fashion, the discipline of knowledge elicitation will be utilized. This is where an expert’s knowledge and beliefs are formulated into probabilistic form. With the intention of providing a solid ground for the knowledge captured, it is wise to set up an ontology. According to Helsper and van der Gaag (2007) an ontology can help to provide a shared understanding of the domain at hand and the elicited knowledge. An ontology can also serve as a means of communication when validating and documenting the domain knowledge. Moreover, an ontology can according to Helsper and van der Gaag (2007) be exploited for building the graphical structure of a BN.
3.2 Problem description The aim of this thesis is to investigate if Bayesian networks acquired from expert knowledge can detect activities in a maritime scenario with a signature-based approach. A maritime scenario will be accounted for in this thesis. The learning of the BN will be performed by utilizing domain expert knowledge and the testing will be based on AIS-data with the purpose of detecting vessels involved in real world activities. To take advantage of an expert’s knowledge and beliefs, knowledge elicitation will be used for formulating knowledge in probabilistic form. The probabilities will be used as prior knowledge for the BN and the resulting BN is to detect the specified maritime scenario. The objectives for achieving the aim explained above are: •
Identify a maritime scenario and address the various activities involved.
•
Build a BN for the identified maritime scenario and learn the BN through a domain expert, and elicit domain expert knowledge in probabilistic form.
•
Test the BN on AIS-data and evaluate the BN based on verification and validation by domain expert and test results.
3.3 Problem demarcation A demarcation worth to mention is that in this thesis, temporal events will not be considered. This is due to the basic format of a BN which makes it hard and unsuitable to consider events that occur over time. Instead, the time of events taking place will be viewed as a snapshot of the actual time. An example of such an event could be: vessel X is waiting on a specific coordinate and the clock is 04:30 pm.
16
Method
4 Method In this section the methods for each of the objectives identified will be accounted for. Each objective will respectively be allocated a suitable method and the motivation for the chosen method will also be presented. The aim of this thesis will be achieved through the completion of these objectives with the methods allocated to them. The following subsection will provide a summary of the selected methods.
4.1 Summary of methods The first objective which is described in section 4.2 is based on an open interview with a domain expert with the purpose of identifying a maritime scenario. The second objective which is described in section 4.3 involves an implementation with the purpose of realizing the solution for detecting the maritime scenario. Objective two will also handle the elicitation task which will need an elicitation session in order to derive accurate probabilities from a domain expert. Finally, the third objective, described in section 4.4 involves testing and evaluation of the solution and the result. A domain expert is also involved in the verification and validation of the BN and the results. The following subsections will consider each objective and the respective method in more detail.
4.2 Identify a maritime scenario When considering the identification of a maritime scenario and the involved activities it is important to find a scenario that is of current interest. The purpose of this objective is to find a maritime scenario that is of importance which also can be set as the foundation of this thesis. There are different methods that can be utilized to help finding a maritime scenario with significance. One can do a literature study on the maritime surveillance domain. Through this, a systematic examination is carried out by analysing published material, with respect to the specific purpose of the thesis. This method can yield plentiful results that can be used in the thesis, but if carried out without careful interpretation and analysis of the material, the whole literature study can be invalid. There is also according to Berndtsson et al. (2002) the problem where one cannot determine when enough material has been collected. Not to forget is the time spent on the procedure of collecting and reading materials. This is however not something that one knows from the beginning. Another method that can be practical here is interviews. This method also has advantages and disadvantages. There is the benefit of interviewing domain experts and acquire new information about a particular phenomenon. It would also be suitable to involve domain experts because they can provide the current status on which maritime scenario that is of interest. It can also be the case where a manually observed scenario needs to be observed automatically. A disadvantage of this method is that a domain expert may not be available due to their often busy schedule. They may also not want to participate due to the sensitive subject of maritime security. But there is no doubt that if a domain expert is available and willing to participate, the knowledge should be utilized. The primary method to be conducted for this objective will be an open interview. The motivation for this choice is that the method yields a more freely format of interviewing. That is, the domain expert and the interviewer can have discussions that 17
Method are more like a brainstorming session (Berndtsson et al., 2002). This approach does not consider questions that can be answered quickly, but rather questions that allow the domain expert to control the session. Although the expert is the one that need to convey the information and the interviewer can step in and point the interview in the right direction, if it starts to deviate from the intended subject. The field-notes i.e., with pen and paper, which are collected throughout the interview, will be documented with the help of an ontology. This will help in the verification of how the maritime scenario and the activities involved were interpreted. The ontology will also be partly used to exploit the graphical parts of the Bayesian network e.g., the qualitative part, for the next objective.
4.3 Build and learn a Bayesian network For the purpose of investigating if Bayesian networks acquired from expert knowledge are suitable for detecting activities with a signature-based detection approach, an implementation will be carried out. Through the identified maritime scenario and the activities involved, an outline of specific events can be derived and used as specific signatures. The signature-based implementation will detect specific activities instead of the contrary which is to detect deviations from a normal baseline. The qualitative part of a BN consists of the graphical part with the nodes and the dependencies in the form of arrows pointing to other nodes. This part will be acquired from domain expert knowledge. The documented domain expert knowledge from the previous objective will assist in building the qualitative part of the BN. The information can be used as the foundation for the BN, where variables and relations between these can be derived from the ontology. The next step involves the quantitative part of the BN. This is where the probabilities for the BN must be acquired e.g., the conditional probability tables (CPTs) must be assigned. In this thesis, the method for acquiring these probabilities will be based on a method from the domain of knowledge elicitation. One of the methods that were described in section 2.4.1 is named the verbal-numerical probability scale. This method uses a probability scale with both numerical and verbal labels. The method is helpful in the sense that an expert can choose if he/she wants to judge probabilities numerically or verbally. Some probabilities may be assessed more comfortably when assessed by selecting verbal labels which reflect the belief of a certain event occurring. On the other hand, some probabilities are more easily assessed with the presence of a numerical label. In both cases, the needed probabilities are outputted as numbers (Witteman and Renooij, 2003). This method has been tested and evaluated. The testing of this method has been applied on both a session with a large number of participating experts, and also on a session where few experts where participating. This can be seen in van der Gaag (1999, 2002) where the method was used in the medical domain and with the purpose of eliciting expert knowledge for BNs. The experts that this method was applied on were considering the method to be easy to use and also equally important comfortable in contrast to other elicitation methods, such as those described in subsection 2.4.1. The verbal-numerical probability scale also delivers many probabilities in a short period of time. For the execution of the knowledge elicitation method an elicitation session needs to be carried out. This is where the verbal-numerical probability scale is to be utilized in conjunction to appropriate questions. The elicitation process is to be followed in this part of the objective.
18
Method This objective will result in a complete BN ready to be tested and evaluated. The next objective will consider just that and how the testing and the evaluation will be conducted.
4.4 Evaluate the Bayesian network For the purpose of testing the BN it is tested on real world AIS-data. The AIS-data will include ship movements over a period of time. This data will include attributes of each of the tracked ships such as vessel identity, position, heading, destination, estimated time of arrival and nature of cargo amongst more. The BN will be tested on the AIS-data with the purpose of finding the maritime scenario activities that were identified in the first objective described in subsection 4.1. The results of the testing will be used to determine if and how well the BN detects the maritime scenario. The disadvantage of carrying out testing on AIS-data is that the specific signatures resembling the maritime scenario may not exist in the data. That is, they may have not occurred during the time period that the AIS-data were recorded. It can also be the cause of vessels that have turned off their AIS-transmitter when commencing their activities. To tackle these disadvantages, it is possible to modify the AIS-data by inserting self-made activities that matches the maritime scenario. The original AISdata can then be used and considered as ordinary everyday activities. Another solution to this obstacle could be to use another kind of sensor data that is independent of AIStransmitters. Another approach is to create synthetic data by using a simulator that generates data. This can be achieved by placing out vessels in the environment within the simulator and assigning routes to them. When the vessels move, the coordinates are recorded. By implementing the maritime scenario into the simulator one can create audit data which can be useful. Besides reflecting the maritime scenario in the synthetic data, it is also possible to apply vessels with ordinary everyday activities. This is similar to AIS-data, but could be used if AIS-data was not available in time of testing. In either case, the test results produced from the testing can be examined in relation to other results that are considered as related work to the one in this thesis. This may involve evaluating how accurate the BN detects the specific activities and how significant the false alarm rate is. This information can be useful when comparing the solution of this thesis with others. However, the signature-based detection approach is known to have a generally low false alarm rate. Due to the appreciated graphical characteristics of BNs it is also possible to involve a domain expert in this step. In comparison to other machine learning techniques, BNs have the potential to illustrate activities graphically. By this advantage a domain expert will also assist in fine-tuning the probabilities acquired, verifying the numbers, and also evaluating the BN. Besides the verification and the evaluation of the BN a domain expert can also validate if the BN considers the activities of the identified maritime scenario. This can then be used as evidence to justify that the solution and the result is according to the domain expert’s specification. According to Berndtsson et al. (2002) it is important to be certain that an implementation reflects the proposed solution. To be certain that the implementation of this thesis is valid and reliable, the domain expert will be asked to validate and verify the implementation based on presented artefacts and test results.
19
Realization and result
5 Realization and result In this section the realization and results of each objective will be explained. A thorough description for each solution will be given in conjunction with the approach taken to reach them.
5.1 Identify a maritime scenario The domain expert that assisted in this objective was provided by Saab Microwave Systems1. The interview that was conducted with the domain expert was based on an open interview. As described in subsection 4.2, the purpose of this objective was to establish a maritime scenario based on the current knowledge of a domain expert. The identified maritime scenario would then be the foundation of this thesis. The questions that the interview was initiated with were: •
Is there a maritime scenario that is of current interest to be detected?
•
Is there a maritime scenario that is observed in a manual fashion which needs to be automated?
•
What activities are involved in the maritime scenario?
To perform the interview in a productive manner a number of already interesting activities/conditions that were identified in Nilsson et al. (2008) were discussed in the interview. These activities/conditions illustrate what the operators at the Swedish marine surveillance control centre in Malmö wanted to detect automatically. The selected activities/conditions that where brought to the interview were: •
If a vessel is government owned.
•
Vessel enters area X and has the name Y.
•
Speed > X.
•
Vessel has name X.
•
Speed changes from high speed to low speed and back to high speed.
•
Two vessels in parallel, with a certain distance X.
•
If a vessel encounters a smaller boat.
•
Vessel deviates from planned route.
The purpose of providing these activities/conditions was to familiarize the domain expert to how activities/conditions in a scenario could be broken down. None the less, it was also intended to investigate if some of these activities/conditions could be present in the maritime scenario that was to be identified. The next subsection discusses the artefacts that were produced based on the expert knowledge that was documented. 5.1.1
Result of the open interview
The maritime scenario that was presented by the expert constitutes of how ships are escorted to a harbour. The maritime scenario will be referred to as the pilot-boat
1
Saab Microwave Systems is a leading supplier of airborne, ground-based and naval radar systems. See http://www.saabgroup.com for more information.
20
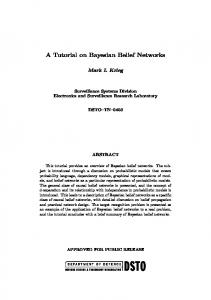
Realization and result scenario from now on. Ships are escorted by one or more pilot-boats that have the responsibility to escort a ship to a harbour. The reason for this is that foreign ships may not be familiar with how strong currents are in the water and also lack the practical knowledge of how to dock a ship in a crowded harbour. Therefore, pilotboats assist ships in this task so that accidents and mishaps can be avoided. If a ship is carrying expensive and fragile goods, it is wise to let someone with the knowabouts to carry out the task of docking the ship (the ship may be expensive in it self). The pilotboat scenario that will be focused on in this thesis is illustrated by figure 5.1.
Figure 5.1 A pilot-boat scenario. Figure 5.1 illustrates the result of the open interview with the domain expert from Saab Microwave Systems. The activities involved in figure 5.1 are represented through a set of numbers in the figure. The activities are: 1. Ship waits for pilot-boat(s) within an unspecified waiting area. The waiting area is denoted by a square. 2. The pilot-boat leaves the docking area. 3. Pilot-boat meets up with the ship and initiation of escort begins. 4. Pilot-boat travelling to the harbour followed by ship. This is the actual escort. 5. Ship docks at the docking area belonging to the harbour. 6. Pilot-boat returns to an unspecified docking area. The next artefact which can be seen in figure 5.2 illustrates the different objects, attributes and their relation to each other. A UML class diagram has been used to create a representation of the objects, attributes and their relations in the pilot-boat scenario.
21
Realization and result
Figure 5.2 A UML diagram over the pilot-boat scenario. Figure 5.2 is part of the ontology for this pilot-boat scenario and it also reflects each activity which was described earlier. The illustrative UML diagram displays what this thesis will consider in terms of the scope of this pilot-boat scenario. In other words, figure 5.2 is used as a demarcation for this thesis as well. The activities presented in figure 5.1 and modelled in figure 5.2 are the only activities that will be accounted for in this thesis. This is due to their significance which will essentially convey an indication that a ship is about to dock at a harbour. Furthermore, these activities have explicitly been stressed by the domain expert as being the most important to focus on. Next there will be a number of figures that show the pilot-boat scenario in real life. These images have been captured from the website Live Search Maps provided by Microsoft Virtual Earth2. The purpose of these images is to display the pilot-boat scenario taking place in real life and what it can look like. These images may also
2
http://maps.live.com/?q=&mkt=en-us&scope=&FORM=LIVSOP#
22
Realization and result help to provide the sense that all the activities are of paramount importance in that they have to be conducted correctly.
Figure 5.3 Overview of a harbour containing ships, pilot-boats and containers. The harbour that can be seen in figure 5.3 is located in Gothenburg which is part of the west coast of Sweden. It is an overview of a part of the harbour which contains an actual pilot-boat scenario similar to the one in this thesis. One can see the white ship at the bottom-left area of figure 5.3 is in contact with two pilot-boats.
Figure 5.4 A closer look at the harbour. Figure 5.4 is a close-up on the white ship with pilot-boats at its back and left side. There are also a couple of other ships with different sizes that have docked at the harbour. In figure 5.5 the satellite image displays the white ship in contact with two pilot-boats in close-up. The ship may have travelled from foreign waters to reach Sweden and deliver merchandise. A ship may also be assisted in leaving a docking area by the help of pilot-boats, but this activity is not accounted for in this thesis. The reason for mentioning this activity is because that it can affect the detection of a pilot-boat scenario. If a ship is escorted out of a harbour, it may be interpreted as a ship that is being escorted to a harbour. Due to the sequential order which each of the pilot-boat activities have to be executed in (besides the first one, ship waiting at area) it is 23
Realization and result assumed that with a correct solution such an activity will not affect the detection of the pilot-boat scenario. The next important subject to be described is the motivation behind the choice of this scenario.
Figure 5.5 A ship in contact with two pilot-boats. According to the interviewed domain expert it is important to detect activities such as those presented in figure 5.1 and to automate the detection. The motivation for this is that instead of manually examining a database over arriving ships that need to be escorted to a harbour, a signature-based detection system can handle the task. That is, an operator does not have to look-up a database to find out when a ship is in need of being escorted. When the signature-based detection system detects activities that resemble a ship waiting for an escort, then the operators can be notified of this. The interviewed domain expert also described that when an operator puts the trust in a database with a timetable of ships arriving, then it is possible to miss ships that are not registered in the database. To elaborate on this matter, if a ship is not scheduled to be escorted to the harbour then an operator may not even notice the actual escort if it took place. If the detection of the pilot-boat scenario is automated, then unscheduled activities will also be detected. By having the signature-based detection system automatically detecting the unscheduled pilot-boat scenario, the operator can look-up the database and examine if a particular ship have been scheduled or not after notification from the signaturebased detection system. If the detected ship that is about to be escorted is scheduled, then the operator can consider it to be legitimate. On the contrary, if the operator is notified by the signature-based detection system that a ship is waiting on to be escorted or is being escorted, and the activity is not scheduled, then it can be considered as illegal. In other words, if the signature-based detection system detects these activities without them being scheduled, then the operator will be notified to take action. In either case, whether or not a ship is commencing in an illegal activity fitting in the pilot-boat scenario, it is according to the domain expert valuable to automate this detection and notify the operators’ every time such activities occur. The operators’ attention can be captured by the signature-based detection system so that unscheduled and perhaps dangerous ships can be handled in a correct manner. The detection of the pilot-boat scenario is of importance due to the size of a harbour. According to the domain expert some harbours can reach up to a number of kilometres. By taking the approach of detecting ships waiting for or commencing 24
Realization and result escorting, one can assure that most or hopefully all of pilot-boat scenarios are detected and notified to the operators observing the harbours. The activities that are involved in the pilot-boat scenario presented in figure 5.1 will be used as the foundation for this thesis. They are significant in the sense that each of the activities will indicate that the pilot-boat scenario is about to commence or has already begun. Each of the activities can be represented in the form of a signature where some of them need to be detected in order to determine if the pilot-boat scenario is taking form or taking place. When the pilot-boat scenario is taking form there may be a ship waiting at an area for pilot-boats, which in itself is an indication of the pilot-boat scenario starting in its initial stage. When the pilot-boat scenario is taking place, the ship may already be on its way to the harbour e.g., being escorted. If the signature-based detection system fails to detect the initial form of the pilot-boat scenario it may detect when the pilot-boat scenario already is taking place. Therefore, the set of activities illustrated in figure 5.1 resemble the signatures that the signaturebased detection system has to detect in order to determine if the pilot-boat scenario is taking form or taking place. The signatures which together resemble the actual scenario can be implemented with different techniques. The chosen technique in this thesis is Bayesian networks, which will be explained next.
5.2 Build and learn a Bayesian network In this subsection, the construction of the Bayesian network with the help of expert knowledge will be explained. The knowledge elicitation session which was carried out with a domain expert will also be explained. Finally, both an overview and a detailed examination of the signature-based detection software will be given. 5.2.1
Qualitative part of the Bayesian network
Through the scenario identified with the help of a domain expert from Saab Microwave Systems, a Bayesian network (BN) has been created. The BN model is built up with a TAN (tree-augmented naïve Bayes) structure which is a simple structure when modelling phenomena from the real world. The TAN structure follows a diverging topology. Figure 5.6 illustrates the created BN model for the pilot-boat scenario.
Figure 5.6 A BN acquired from expert knowledge and without any evidence set. Through the characteristics of the BN model, the child nodes can be regarded as information variables for the BN, and the parent node as the query variable. The reason for this is because the child nodes, given the evidence set on their values, will determine the outcome of the parent node. Hence, the calculations made by the child nodes will affect the probability of the parent node. If a value of the parent node is known, e.g., evidence is present; the child nodes will not have any affect on each 25
Realization and result other or on the parent node. That is, information variables are assumed to be independent from each other given the evidence about the query variable. The given explanation exemplifies a diverging topology which was described in subsection 2.4. According to Zaffalon and Fagiuolin (2003) the TAN structure has a linear time complexity for posterior probability calculations and provides very good performance when it comes to problems where one is only interested in identifying the most probable causes of a phenomenon. The pilot-boat scenario is similar in the sense that only certain activities can indicate that the scenario is true. The nodes of the BN model will be described next: •
“Scenario in action” is the parent node variable and it has two values, which are true and false. This node is the query variable which represents a belief about whether the scenario is in action or not. If no evidence is present about the parent node, then the probability of the scenario being true or false is dictated by the parent’s child nodes.
•
“Ship waiting at area” is the first child node and it takes into account how long a ship has been waiting at an area. The values for this node is, T for time, T > 0 and T 5 and T 10. Evidence on one of these values will be set, depending on the time that a vessel has been waiting. The discrete values are based on expert knowledge.
•
“Ship meets pilot-boat” is the second child node which also is the parent of “Ship escorted by pilot-boat”. This node follows the same discretization as the previous child node. With this node the values are based on the distance between a ship and a pilot-boat e.g., M > 0 and M 5 and M 10, where the unit for M is meters. Evidence will be set on one of the values depending on the distance between a particular vessel and a pilot-boat. For instance, if the distance between a vessel and a pilot-boat is 7.5 meters, then evidence for the second value is set.
•
“Ship escorted by pilot-boat” is the third child node which also is the parent of “Ship reach harbour”. This child node takes into account whether a ship is being escorted by a pilot-boat or not. The values for this child node is escorted and not escorted. This node is influenced by the “Ship meets pilot-boat” node, and depending on the evidence set on the values of the “Ship meets pilot-boat” node, the probabilities for “Ship escorted by pilot-boat” are influenced.
•
“Ship reach harbour” is the fourth child node and this node takes into account whether a ship has reached a harbour or not. This node is also the parent of “Pilot-boat returns to area”. The values for this child node is reach harbour and not reach harbour. The two values are influenced by the evidence set on the “Ship escorted by pilot-boat” node. The values of this child node were similar to the “Ship meets pilot-boat” node. It followed the same approach of calculating a distance between two entities and it also had discrete values. Due to the lack of precise information on the location of each harbour, the current values had to be used. The harbours are currently plotted out with squares, where each square resemble a harbour. When a vessel resides within a harbour square, then the vessel is regarded to be near or to have reached the harbour.
•
“Pilot-boat returns to area” is the fifth and the last child node. This node takes into account if a pilot-boat returns to an unknown area near a harbour after it has escorted a vessel to a harbour. This child node has two values, true and false. It is also influences by the “Ship reach harbour” node. 26
Realization and result The BN model resembles the pilot-boat scenario by having the characterizing activities as child nodes e.g., information variables. The structure of the BN model tolerates if an activity is undetected. This means that if the detection of a particular activity is missed for some reason, the BN model can still output an answer. It can be beneficial to have this tolerance due to the uncertainty which resides within each activity. The advantage of having dependencies between some of the child nodes is to acquire a more realistic representation of the pilot-boat scenario. The choice of incorporating influences between the child nodes allows the nodes to affect each other which results in more realism. For instance, if a ship is being escorted then this would influence the chances of the ship reaching a harbour. The disadvantage of having dependencies between child nodes is that the conditional probability tables (CPTs) become more complex. This may complicate the process of inserting the probabilities into the CPTs and also complicate the knowledge elicitation process. The next part will consider the quantitative part of the BN model. 5.2.2
Quantitative part of the Bayesian network
The quantitative part of a BN involves as explained in subsection 2.4.1 and subsection 4.3, the CPTs and how to elicit and extract information in a probabilistic form. A diverse set of methods were described, but the one argued for was the verbalnumerical probability scale. For this task, a tool was created which is part of the overall software. The task involved implementing research material by van der Gaag (1999, 2002) and Witteman and Renooij (2003). The purpose was to bring forward the graphical characteristics of the verbal-numerical probability scale to a computerized environment, and subsequently compose a means for extracting and eliciting knowledge in a correct fashion. Two parts will be explained here, the computerization of the research material and the knowledge elicitation session which was carried out.
27
Realization and result
Figure 5.7 Illustration of the knowledge elicitation tool. Figure 5.7 illustrates the knowledge elicitation (KE) tool created. It has mainly two parts, an elicitation session capability and a compilation feature which compiles the probabilities so that they are ready for utilization by the BN. The KE tool has a straightforward design implemented in Java. At the top, the question at hand is displayed and below the question are the values in relation to the BN node. The structure of the inquiring questions can also be viewed at the top. In the middle, the actual verbal-numerical probability scales are visible. As illustrated, the questions can be answered with a label or an associated numerical alternative, depending on how an expert wants to answer the question. The preparation and accomplishment of the KE session was performed in accordance with the procedure in Renooij (2001): 1) select and motivate the expert, 2) train the expert on the elicitation process, 3) structure the questions, 4) elicit and document the expert judgements, and 5) verify the results. Here is a compilation of the performed activities: 1. The domain expert was allocated by Saab Microwave Systems. 2. The domain expert was briefly introduced to BN and KE. Due to the already present background knowledge that the expert had, the introduction was more focused on how the session would be carried out and how the questions would be presented. 3. The questions were structured according to the order of the BN nodes e.g., from left to right. Each question took into account whether the parent node was true or false. When it came to the child nodes that had dependencies from 28
Realization and result both the parent node and another child node, the question became somewhat more complicated. But the expert was assisted during every question. 4. The KE tool took care of the elicitation part and the probabilities were stored in a numerical format and ready to be used by the BN. 5. The elicited probabilities were confirmed by the expert in conjunction with each question. Any answers that the expert suspected to be wrong, was calibrated and corrected. In conjunction with the question, the values of the actual BN node are aligned with each scale. The purpose of this is to bring attention to the values at hand and to allow the expert to have a visual overview of the values that need to be assessed. Table 5.1 to table 5.6 illustrates the CPTs for each BN node. The probabilities of the CPTs are based on the expert knowledge which was acquired with the KE tool. Scenario in action True
False
0.14
0.86
Table 5.1 CPT for the parent node Scenario in action. Table 5.1 shows the prior knowledge of how probable it is for a pilot-boat scenario to occur.
Ship waiting at area
Scenario in action True
False
T > 0 and T 5 and T 10
0.74
0.9
Table 5.2 CPT for the child node Ship waiting at area. Table 5.2 presents the probabilities of how long a ship needs to wait before it is considered to be involved in a pilot-boat scenario. This depends on whether or not the child node Scenario in action, is assumed to be true. According to the CPT in table 5.2, there is a 74% probability that a ship have been waiting for more than ten minutes, given that the pilot-boat scenario is true. Table 5.3 shows the probabilities of how close a ship needs to be to a pilot-boat before it is considered to be involved in a pilot-boat scenario. The CPT in table 5.3 follows the same structure as the CPT in table 5.2. Hence, there is a 78% probability that the distance between the ship and the pilot-boat is within the interval of 0 to 5 meters, given that the pilot-boat scenario is true. Neither of the CPTs in table 5.2 and table 5.3 are affected by other child nodes.
29
Realization and result
Scenario in action Ship meets pilot-boat
True
False
M > 0 and M 5 and M 10
0.03
0.92
Table 5.3 CPT for the child node Ship meets pilot-boat. Scenario in action True
False
Ship meets pilot-boat
Ship meets pilot-boat
M > 0 and M > 5 and M > 10 M 5 and M > 10 M 0 and M 5 and M 10. The main task here is to calculate the distance between two sets of latitude and longitude coordinates. Any results that reside within the intervals that the values advocate are stored. The results will indicate whether or not a vessel has been in contact with a pilot-boat. The stored results are then utilized as evidence for the “Ship meets pilot-boat” child node.
•
isShipBeingEscorted: attempts to use the information compiled from the former method to detect if a vessel is being escorted by a pilot-boat. The method observes how long the vessel and the pilot-boat have had contact e.g., being close to each other. The contact between the vessel and the pilot-boat must also involve movement to indicate that the vessel and the pilot-boat are travelling together. The close vicinity and the movement will decide whether or not the vessel is being escorted. This information is stored for the next methods and is also used as evidence for the “Ship escorted by pilot-boat” BN child node values escorted and not escorted.
•
isShipNearHarbour: is the method that examines whether or not a vessel has reached a harbour. Due to the lack of information on the precise coordinates for each harbour, it is considered that a vessel is near or has reached a harbour if the vessel at hand has travelled within a harbour zone. This method examines the information produced by the former method which is isShipBeingEscorted. When a vessel and a pilot-boat are travelling together, and are detected to be within a harbour zone, then the event will be stored. This information will then be used by later methods and will also be used for evidence for the “Ship reach harbour” BN child node. The child node values that this node finds evidence for is reach harbour and not reach harbour.
•
isPilotBoatReturningToArea: attempts to detect if a pilot-boat, after escorting a vessel to a harbour, deviates from the vessel. The main task here is to detect when a pilot-boat is leaving a vessel. The method utilizes the information stored by the former method to determine when the activity of escorting has been completed. An examination will then be performed by the method to detect whether or not the pilot-boat is deviating from the vessel. If the pilotboat is deviating from the vessel, then the method will observe the pilot-boat’s movement until it has stopped. When no more movement is detected, the pilotboat is considered to have returned to an area. This information is then used as evidence for the “Pilot-boat returns to area” BN child node. The child node values that this method finds evidence for is true and false.
33
Realization and result When all of the methods have been executed on each vessel, the evidence on each child node will dictate what the probability of the parent node “Scenario in action” will be. The probability of a pilot-boat scenario taking place or not, will be determined by the generated belief of the parent node “Scenario in action”. The belief is in probabilistic form and indicates how probable it is that the pilot-boat scenario has taken place. Based on the values of the parent node which are true or false, the signature-based detection software will be informed of whether or not the pilot-boat scenario was detected. The procedural structure of the signature-based detection software can be viewed in figure 5.9. The illustration also offers an overview of how the diverse tasks are performed.
Figure 5.9 Pseudo code of the signature-based detection software. The next subsection will consider the testing and verification of the signature-based detection software as well as the expert verifying the test results and the BN model.
5.3 Testing and verification In subsection 5.3.1, the test cases will be presented which the signature-based detection software was tested on. Subsection 5.3.2 will illustrate the test results. The verification of the BN and the signatures will be presented in subsection 5.3.3. Finally, the verification of the knowledge elicitation tool will be described in subsection 5.3.4. 5.3.1
Testing the signature-based detection software
During the development of the signature-based detection software, testing was conducted in a sequential order. Each of the methods described in subsection 5.2.4 were developed and tested one at a time. This procedure was executed because each method needed to function correctly before progressing to the next. Hence, AIS-data
34
Realization and result was utilized for testing the methods as well as the complete signature-based detection software. Two kind of tests where carried out on the complete software. The first one considered a manually created pilot-boat scenario to be inserted in the AIS-data. The manually created scenario had the purpose of testing if the signature-based detection software possesses the capabilities of detecting a pilot-boat scenario based on the identified pilot-boat activities/signatures, which the domain expert advocated. The detection of the manually created pilot-boat scenario would prove that the capabilities of detecting a pilot-boat scenario are present. Figure 5.10 illustrates the setup for the manually created pilot-boat scenario, which is similar to the real world pilot-boat scenario illustrated in figure 5.4. The manually created pilot-boat scenario was inserted in AIS-data which resembled a ship that had been waiting for a pilot-boat for more than ten minutes. The distance between the ship and the pilot-boat was set to between 0 and 5 meters, and the specified interval was also considered when the ship was being escorted by the pilot-boat. That is, the ship and the pilot-boat would have a distance between 0 and 5 meters during the escort. The ship would reach the specified harbour depicted with a rectangle in figure 5.10. Finally, the pilot-boat would deviate from the ship and return to the area from which it started.
Figure 5.10 Overview of the manually created pilot-boat scenario. The green (dark) dots in figure 5.10 represent a ship and the yellow (light) dots represent a pilot-boat. The black rectangle displays the harbour which the ship desires to dock at and the arrows represent the starting direction of each vessel. The result of this test will only reflect the software’s capability of detecting signatures in the absence of uncertainty. To justify the software’s capability of detecting pilot-boat 35
Realization and result scenarios based on real world observations, a test that considers real world observations have to be conducted. With real world observations, there are other factors that can affect the signature-based detection software. Factors such as observation faults, vessels behaving strange, environment conditions e.g., waves, currents and weather, can all affect the detection of pilot-boat scenarios. For instance, observation faults can result in undetected signatures, which would then reduce the probability of detecting the pilot-boat scenario. The next test will be described here. The second test applies a complete set of available AIS-data on the signature-based detection software. The purpose of this test is to examine the software executing on real world observations and also to analyse if any pilot-boat scenarios can be detected. This test can justify the software’s capabilities of detecting pilot-boat scenarios from real world data. The complete set of available AIS-data covers the time period from the 1st to the 18th of January 2008. There are more than 63 million observations available in the mentioned area and time period. This number will decrease because of the specific area that the software will consider. Figure 5.11 illustrates the precise area from which observations will be considered. Observations residing outside the area that figure 5.11 depicts, will not be considered. The motivation for the areal choice is the mixture of both open waters and coastal area. This may test the signature-based detection software in open waters and also near harbours.
Figure 5.11 Observation area for the second test. 5.3.2 Test results The first test which was described in subsection 5.3.1 resulted in success. The manually created activities resembling a pilot-boat scenario were detected. Hence, the test showed that the signature-based detection software is built in accordance with the pilot-boat activities/signatures. The test also showed that the software has the 36
Realization and result capability of detecting pilot-boat scenarios with the absence of uncertainty. It was also shown that each of the methods described in subsection 5.2.4, detected the signatures that were present in the manually created pilot-boat scenario. The methods show that: •
[Ship_waiting_at_area] -> T_higher_10
•
[Ship_meets_pilot_boat] -> M_higher_0_lower_equal_5
•
[Ship_escorted_by_pilot_boat] -> escorted
•
[Ship_reach_harbour] -> srhTrue
•
[Pilot_boat_returns_to_area] -> pbrtaTrue
The result of the methods indicates that the specified test activities in subsection 5.3.1 were detected with success. Based on these evidences there is a 91% probability of the pilot-boat scenario taking place. The second test applied real world observations on the signature-based detection software. The result of this test showed that the software can detect ships involved in a pilot-boat scenario. Due to the lack of information on the actual number of pilotboat scenario occurrences in the AIS-data, the accuracy of the BN and the signatures could not be set. The test showed that during 14 days of AIS-observations, the amount of detected pilot-boat scenarios where 74. These detected pilot-boat scenarios where then examined with the purpose of determining whether the detections where true positive or false positive. That is, if the actual detections where real or if they where falsely considered as real. The examination showed that out of 74 potential pilot-boat scenarios, there where 45 true positives and 29 false positives. Hence, this justifies that the software has the necessary capability for detecting pilot-boat scenarios. The examination also showed that the software detects scenarios which are slightly similar to the pilot-boat scenario. But the performed examination only considered detected scenarios that where in accordance with the pilot-boat scenario described in this thesis. There are approximately 3 pilot-boat scenarios occurring each day that are in accordance with the signatures specified by the domain expert.
Diagram 5.1 Number of pilot-boat scenarios detected per day. 37
Realization and result The reasons for the 29 false positive detections can for instance be due to a reverse pilot-boat scenario where a ship is escorted from a harbour which this thesis does not consider. Ships may also be involved in scenarios where pilot-boats are assisting in some other activities. For instance, a pilot-boat captain may board the ship and manually assist it to reach the harbour. Any scenarios which are similar to the one in this thesis may trigger the signature-based detection software to notify that a potential pilot-boat scenario has been detected, even if it deviates from the identified pilot-boat activities. Diagram 5.1 displays the total number of detected pilot-boat scenarios over 14 days of AIS-data. The diagram also illustrates the number of true positives and false positives for each observed day. Figure 5.12 illustrates a ship involved in a pilotboat scenario which was detected based on real world AIS-data.
Figure 5.12 A pilot-boat scenario detected from AIS-data. Figure 5.12 illustrates an actual pilot-boat scenario taking place. The green (dark) dots represent the ship, and the yellow (light) dots represent the pilot-boat. At the left of figure 5.12 one can se how the two vessels end up with each other. After that the actual escorting of the ship is taking place. At the right the pilot-boat and the ship has reached the harbour and the pilot-boat returns continues to a waiting area. 5.3.3
Verification of test results and the Bayesian network model
The expert was presented with the test result and the BN model. Based on the test result from the first test the expert was pleased that the signature-based detection software detected the pilot-boat scenario based on the specified signatures. The expert was also surprised that the software detected the pilot-boat scenario. On the other hand the expert considered the lack of real-time characteristics as the downside. To be able to account for real-time observations was according to the expert a necessity if such a solution would be implemented in a maritime surveillance system. The test results from the second test were also presented to the expert. These results showcased the capabilities of the signature-based detection software to detect real world pilot-boat scenarios. The expert considered the amount of detected pilot-boat scenarios to be fairly good and was pleased with software’s ability to detect real life pilot-boat scenarios. The expert also considered the examination of each of the 74 detected pilot-boat scenarios to confirm how well the software can detect pilot-boat scenarios. Real-time characteristics were also discussed during the presentation of the test result from the second test. 38
Realization and result The signatures of the software and the source code for each of them were described in detail. According to the domain expert, the implemented signatures which together resemble a pilot-boat scenario are in accordance to the actual activities that a pilotboat scenario constitutes of. The BN model was shown to the expert in conjunction with each of the implemented signatures. The reason for this was that the expert could have an overview of the BN model and the underlying signatures which handled the evidence gathering. When the BN model was described the expert agreed upon that each of the child node values were sufficient in the sense that they covered the uncertainty in time and distance. This concerned the child nodes which had values of discrete intervals. The expert was also satisfied with the other child node values. The expert mentioned that the dependencies, that are present between some of the child nodes, are helping to represent the scenario in more detail. 5.3.4 Verification of the knowledge elicitation tool The knowledge elicitation tool that the expert used during the elicitation session was presented again. The expert was also shown CPTs, the purpose of this was to put the knowledge elicitation tool in relation to how it would be to manually insert probabilities. One of the experiences that the expert took part of was that the tool was comfortable to work with. It was not overwhelming to work with due to the sufficient information that was presented on the screen during the elicitation session. The expert also thought that the tool would result in a faster probability gathering. On the other side, the expert explained that some of the questions asked were somewhat complex to grasp at the first reading. This was due to the complexity of some child node CPTs. It was also mentioned by the expert that such a tool like the one in this thesis can very well be incorporated into larger systems. The purpose of this would according to the expert be to modify expert knowledge when needed. This would concern such solutions like the use of BN acquired from expert knowledge.
39
Related work
6 Related work This section positions this thesis in relation and in context with other work in the same problem domain. A comparison between this and other studies will be conducted based on differences and similarities, and their approaches.
6.1 Detection of vessel anomalies – a Bayesian network approach In Johansson and Falkman (2007), the domain for which the work was based on was the maritime domain. Observation data was acquired from a simulator, which then was used as training and testing data. The training data had to be used because of the approach that was taken. The approach considered learning the BN from training data from which a normal baseline for legal activities was created. In other words, an anomaly-based detection approach was taken. Speeding of single sea vessels was an anomaly which Johansson and Falkman (2007), ended up with detecting based on their normal baseline. The implemented solution illustrated that the BN learnt from audit data detected the speeding anomaly. In this thesis, the BN was learnt from expert knowledge and the observations were based on real world AIS-data. A similarity however, is that both of the reports strive to unload the many unnecessary activities which an operator handles. To automatically detect speeding or a pilot-boat scenario may help to filter out unimportant vessels so that an operator can focus on important ones. The tests on the BN in Johansson and Falkman (2007) were based on the testing data. Some manually created vessels were also created and inserted in the test data. The manually inserted vessels performed anomalous behaviours which resembled different degrees of speeding. In this thesis, a similar test case was created where a pilot-boat scenario based on the expert’s specified signatures was inserted into AIS-data.
6.2 Maritime situation monitoring and awareness using learning mechanisms In Rhodes et al. (2005), the use of Fuzzy ARTMAP neural networks was used. The algorithm which the paper is based on provides a fast engine for learning to distinguish between classes of objects, events, or behaviours. The anomaly-based detection approach was chosen here. The normal baseline was learnt from data resembling routine activity. The learning algorithm in Rhodes et al. (2005) is based on continuous learning, where new observations are classified as normal, anomalous, or unknown class. The performance of the learning algorithm can be improved by confirming or rejecting alerts which the operator in this case can. The signature-based detection software presented in this thesis does not have the ability to be fine tuned on-the-fly like the solution in Rhodes et al. (2005). The main procedure for improving the overall software is to manually configure the BN to add or remove nodes. Another part of the signature-based detection software, which can be fine tuned, is the methods that attempt to find the required evidences for each child node. These can be calibrated and modified to detect even more indistinct pilot-boat scenarios affected by environmental conditions. Both reports focus on the maritime domain and to improve detection of activities within this domain. It is however a different approach taken for detecting activities in Rhodes et al. (2005), which in this context can be viewed as an example of another procedure for detecting activities. 40
Conclusions
7 Conclusions In this section, a summary of the results from the work performed in this thesis will be given. This section will also present potential future work which relates to the work in this thesis.
7.1 The Bayesian network and the signatures It has been shown that Bayesian networks acquired from expert knowledge can detect activities with a signature-based detection approach. The TAN structure of the created BN makes it possible to freely modify the network. Hence, adding more detail to resemble the real world more accurately is possible. The BN model which represents the pilot-boat scenario can be used as a basis for representing other scenarios. In order to achieve this, child nodes e.g., information variables, have to resemble activities which are part of the scenario. Based on a collection of child nodes resembling all the scenario’s activities, the parent node e.g., query variable, have to represent the scenario. This sort of setup with information variables and a query variable made it possible to detect the pilot-boat scenarios with success. This conclusion is based on the test results which were presented in subsection 5.3.2. An important factor for the detection of the pilot-boat scenario is the required evidences for each information node. To be able to acquire evidence, the signatures representing each information node need to clearly be defined. The signatures need to represent the activities which the scenario is based on. The reason for this is because the signatures will dictate in what procedure the underlying methods/mechanisms need to function. If an expert is considered to be part of the identification of signatures for a scenario, proof about the expert’s expertise in the domain need to be present. In the work of this thesis, an expert has been involved when creating signatures, this turned out to be achievable due to the experts knowledge about certain activities in the maritime domain. The expert knowledge about a pilot-boat scenario resulted in clearly defined signatures. The signatures may need more development if they ever are set to detect pilot-boat scenarios with indistinct activities. The work of this thesis shows that the BN and the signatures can detect pilot-boat scenarios based on real world AIS-data. The AIS-data for the testing had an unknown number of pilot-boat scenarios involved. Based on the test results, it has been shown that the detection of pilot-boat scenarios in the AIS-data is possible. A number of the detections can be said to be potential pilot-boat scenarios due to their indistinct characteristics. If knowledge about the amount of pilot-boat scenarios involved in the AIS-data had been present, the accuracy of the BN and signatures could have been set.
7.2 The knowledge elicitation tool A contribution in the form of an implemented tool has also been presented in the work of this thesis. The knowledge elicitation tool helped to elicit probabilities for the BN model representing the pilot-boat scenario. The setup of the knowledge elicitation tool was based on the verbal-numerical probability scale. The probabilities where elicited from an expert which was involved in the identification of the pilot-boat scenario. The expert had insight in how often and how probable it was that each of the activities took place. Hence, knowledge about the occurrence of each activity was available. 41
Conclusions The knowledge elicitation tool was used in an elicitation session which based on the expert’s review was a smart and an efficient way of approaching a task of acquiring probabilities. This was compared to the procedure of manually inserting probabilities in the CPTs of the BN. The combination of verbal and numerical choices for answering questions made the process of eliciting probabilities faster and also comfortable for the expert. The knowledge elicitation tool can deliver complete and ready probabilities for the CPTs of the BN model. Such tools as the knowledge elicitation tool created in this thesis can very well be incorporated into large systems which bring forth the ability to modify expert knowledge whenever needed. The expert which used the knowledge elicitation tool had knowledge about probability theory, activity detection systems and also little insight in what a BN is. Hence, the conclusions of the knowledge elicitation tool are based on an expert with a fairly relevant knowledge background. To know whether or not the knowledge elicitation tool is built for experts with different degrees of knowledge about probability theory, activity detection systems and BNs, some experiments need to be carried out.
7.3 Future work The work in this thesis has shown that it is possible to detect activities based on Bayesian networks acquired from expert knowledge with a signature-based detection approach. Another contribution of this thesis is the knowledge elicitation tool. What resides within future work for this thesis is to investigate if the BN for the pilot-boat scenario can detect the scenario better than a BN acquired from audit data. This would involve learning a BN of what is considered to be a pilot-boat scenario e.g., constructing a normal baseline for the scenario. Then test whether or not the number of detected pilot-boat scenarios exceeds the current BN. This work could contribute to the research area with facts about how a BN learnt from audit data and a BN acquired from expert knowledge, behave and also separate from each other. The next future work proposal involves a comparison of the TAN structure with the naïve structure based on expert knowledge. The purpose of this comparison is to examine if there are any changes in the amount of detected pilot-boat scenarios. It may be valuable to determine if one of these structures can result in more accurate detections of the pilot-boat scenario. The third future work proposal is directed towards the use of another technique instead of BN. This proposal could bring forward the contrasts between BN and another technique when detecting scenarios. Future work could also be performed on the implementation in this study. To multithread the signature-based detection software, would make it possible to handle a large number of observations in parallell. This in conjunction with real-time characteristics could bring forth capabilities which can process real-time observations. The solution can also be modified so that is can work as an independent module, which can be inserted in maritime surveillance systems to detect specified scenarios. This would involve a number of different BN and signatures which represent a diverse set of scenarios, to be incorporated in the signature-based detection software. The work in this thesis has shown single scenario detection, but the incorporation of a diverse set would then need to be examined. The knowledge elicitation tool can be further developed to support other BN models. The tool would then have to create CPTs based on the inserted BN model and generate a set of questions for each of the CPTs which would then be presented to a domain expert. 42
Acknowledgements I would like to first of all thank my supervisor Fredrik Johansson for his outstanding supervision and the time which he spent on this work. I would also want to thank Christoffer Brax from Saab Microwave Systems for his excellent supervision. He has given me valuable input on the implementation of the signature-based detection software. I am also thankful for the initial input on the domain of knowledge elicitation from Ronnie Johansson. He has presented me with a handful of valuable sources which ended up being used in this thesis.
Farzad Fooladvandi May 2008
43
References Berndtsson, M., Hansson, J., Olsson, B., and Lundell, B., 2002. Planning and Implementing your Final Year Project – with Success. Springer, London. Bomberger, N. A., Rhodes, B. J., Seibert, M., and Waxman, A. M., 2006. Associative Learning of Vessel Motion Patterns for Maritime Situation Awareness. In Proceedings of the 9th International Conference on Information Fusion, Florence, July, pp. 1-8. Bomberger, N. A., Waxman, A. M., Rhodes, B. J., and Sheldon, N. A., 2007. A new approach to higher-level information fusion using associative learning in semantic networks of spiking neurons. Information Fusion, 8(3), July, pp. 227-251. Bossé, É. Roy, J. and Wark, S. 2007. Concepts, Models, and Tools for Information Fusion. Artech House, Norwood, MA, USA. Cho, S., and Cha, S., 2004. SAD: web session anomaly detection based on parameter estimation. Computer and Security, 23(4), pp. 312-319. Cranefield, S., and Purvis, M., 1999. UML as an ontology modelling language. In Proceedings of the IJCAI’99 Workshop on Intelligent Information Integration, Germany, Univ. of Karlsruhe, pp. 46-53. Druzdzel, J. M., and van der Gaag, C. L., 2000. Building Probabilistic Networks: Where Do the Numbers Come From? – a Guide to the Literature. IEEE Transactions on Knowledge and Data Engineering, 12(4), August, pp. 481-486. Endsley, M. R., 1995. Toward a theory of situation awareness in dynamic systems. Human Factors Journal, 37(1), pp. 32-64. Eriksen, T., Hoye, G., Narheim, B., and Meland, J. B., 2006. Maritime traffic monitoring using a space-based AIS receiver. Acta Astronautica, 58(10), May, pp. 537- 549. van der Gaag, L. C., Renooij, S., Witteman, C. L. M., Aleman, B. M. P., and Taal, B. G., 1999. How to elicit many probabilities. In: K. B. Laskey, and H. Prade, editors. In Proceedings of the 15th Conference on Uncertainty. Morgan Kaufmann Publishers, San Francisco, CA, pp. 647-654. van der Gaag, L. C., Renooij, S., Witteman, C. L. M., Aleman, B. M. P., and Taal, B. G., 2002. Probabilities for a probabilistic network: A case-study in oesophageal cancer. Artificial Intelligence in Medicine, 25(2), pp. 123-148. Garthwaite, H. P., Kadane, B. J., and O'Hagan, A., 2005. Statistical Methods for Eliciting Probability Distributions. Journal of the American Statistical Association, 100(470), June, pp. 680-701. Giacinto, G., Perdisci, R., Del Rio, M., and Roli, F., 2008. Intrusion detection in computer networks by a modular ensemble of one-class classifiers. Information Fusion, 9(1), pp. 69-82. Gruber, T., 2007. Ontology. In: L. Liu, and T. M. Özsu, editors. Encyclopedia of Database Systems, Springer-Verlag. Hall, D. L., and Llinas, J., 1997. An Introduction to Multisensor Data Fusion. In Proceedings of the IEEE, 85(1), January.
44
Hall, M. J., Hall, S. A., and Tate, T., 2001. Removing the HCI Bottleneck: How the Human Computer Interaction (HCI) affects the performance of Data Fusion Systems. In: D. L. David, and J. Llinas, editors. Handbook of multisensor data fusion. CRC Press, Florida, USA, chapter 19, pp. 1-19. Helsper, M. E., and van der Gaag, C. L., 2007. Ontologies for probabilistic networks: a case study in the oesophageal-cancer domain. The Knowledge Engineering Review, 22(1), March, pp. 67-86. Hoye, K. G., Eriksen, T., Meland, J. B., and Narheim, T. B., 2008. Space-based AIS for global maritime traffic monitoring. Acta Astronautica, 62(2-3), pp. 240-245. Jensen, F. V. and Nielsen, T. D. 2007. Bayesian Networks and Decision Graphs. 2nd edition, Springer, New York, USA. Johansson, F., and Falkman, G., 2006. Implementation and integration of a Bayesian Network for prediction of tactical intention into a ground target simulator. In Proceedings of the 9th International Conference on Information Fusion, Florence, July, pp. 1-7. Johansson, F., and Falkman, G., 2007. Detection of vessel anomalies – a Bayesian network approach. In Proceedings of the 3rd International Conference on Intelligent Sensors, Sensor Networks and Information Processing, Melbourne, Australia, December 3-6. Khatkhate, A. M., Ray, A., and Keller, E., 2007. Modelling and system identification of an experimental apparatus for anomaly detection in mechanical systems. Applied Mathematical Modelling, 31(4), pp. 734-748. Kogut, P., Cranefield, S., Hart, L., Dutra, M., Baclawski, K., Kokar, M., and Smith, K., 2002. UML for ontology development. The Knowledge Engineering Review, 17(1), March, pp. 61-64. Lefebvre, E., and Helleur, C., 2004. Automated Association of Track Information from Sensor Sources with Non-Sensor Information in the Context of Maritime Surveillance. In Proceedings of the 7th International Conference on Information Fusion, Stockholm, Sweden, June 28th – July 1st. Li, X., Han, J., and Kim, S., 2006. Motion-Alert: Automatic Anomaly Detection in Massive Moving Objects. In Proceedings of the IEEE International Conference on Intelligence and Security Informatics, San Diego, CA, May, pp. 166-177. Nilsson, M., van Laere, J., Ziemke, T., and Edlund, J., 2008. Extracting rules from expert operators to support situation awareness in maritime surveillance. In Proceedings of the 11th International Conference on Information Fusion, Cologne, Germany, June 30th – July 3rd. O’Hagan, A. Buck, E. C. Daneshkhah, A. Eiser, R. J. Garthwaite, H. P. Jenkinson, J. D. Oakley, E. J. and Rakow, T. 2006. Uncertain Judgements: Eliciting Experts’ Probabilities. Wiley, England. Patcha, A., and Park, J., 2007. An overview of anomaly detection techniques: Existing solutions and latest technological trends. Computer Networks, 51(12), August, pp. 3448-3470.
45
Renooij, S., 2001, Qualitative Approaches to Quantifying Probabilistic Networks. Ph.D. thesis. Institute for Information and Computing Sciences, Utrecht University, The Netherlands. ISBN 90-393-2644-4. Rhodes, B.J., Bomberger, N.A., Seibert, M., and Waxman, A.M., 2005. Maritime situation monitoring and awareness using learning mechanisms. In Proceedings of IEEE MILCOM 2005 Military Communications Conference, Atlantic City, NJ, USA October 17th-20th, pp. 646-652. Riveiro, M., 2007. Evaluation of Uncertainty Visualization Techniques for Information Fusion. In Proceedings of the 10th International Conference on Information Fusion, Québec, Canada, July, pp. 1-8. Skjong, R., and Soares, G. C., 2008. Safety of maritime transportation. Reliability Engineering and System Safety, 93(9), September, pp. 1289-1291. Wiegmann, A. D., 2005, Developing a Methodology for Eliciting Subjective Probability Estimates During Expert Evaluations of Safety Interventions: Application for Bayesian Belief Networks. Aviation Human Factors Division Institute of Aviation, University of Illinois at Urbana-Champaign. October. Technical report AHFD-0513/NASA-05-4. Witteman, C., and Renooij, S., 2003. Evaluation of a verbal-numerical probability scale. International Journal of Approximate Reasoning, 33(2), pp. 117-131. Zaffalon, M., and Fagiuoli, E., 2003. Tree-Based Credal Networks for Classification. Reliable Computing, 9(6), December, pp. 487-509.
46