Authentication System (BAS) based on the fusion of two user-friendly biometric modalities: signature and speech. All biometric data used in this work were ...
Signature with Text-Dependent and Text-Independent Speech for Robust Identity Verification B. Ly-Van*, R. Blouet**, S. Renouard**, S. Garcia-Salicetti*, B. Dorizzi*, G. Chollet** * INT, dépt EPH, 9 rue Charles Fourier, 91011 EVRY France; **ENST, Lab. CNRS-LTCI, 46 rue Barrault, 75634 Paris Emails: {Bao.Ly_van, Sonia.Salicetti, Bernadette.dorizzi}@int-evry.fr; {Blouet, Renouard, Chollet}@tsi.enst.fr Abstract This article addresses the setting up of a Biometric Authentication System (BAS) based on the fusion of two user-friendly biometric modalities: signature and speech. All biometric data used in this work were extracted from the BIOMET multimodal database [1]. The Signature Verification system relies on Hidden Markov Models (HMMs) [2], and we use two kinds of Speaker Verification systems. The first one is text-dependent and uses Dynamic Time Warping (DTW) [3] to compute a decision score. The second one is text-independent and based on Gaussian Mixture Models (GMMs) [4]. We first present the BIOMET database and describe precisely the two modalities of interest before giving a presentation of each monomodal BAS as well as their performance evaluation. We then compare performances of two classical learning-based fusion techniques: an additive CART-trees [5] classifier built with boosting [6], and Support Vector Machines (SVMs) [7]. In particular, the signature modality was fused with clean and noisy speech, at two different levels of degradation. The impact of noise in fusion performance is studied relative to that of each of the speech experts alone.
1 Introduction Many commercial applications require a step of Identity Verification before accessing to a service or to sensitive data. As the media and channels through which the Identity Verification process takes place are becoming more diverse, multimodal biometric authentication systems could be used with convenience to improve user security. Moreover, several studies have already proven that combining different biometric modalities significantly improves the performances compared to system working with a single modality [8, 9]. We present in this article a bi-modal biometric system based on two well-accepted modalities: signature and speech. The two main virtues of those modalities are their physical non-
intrusiveness and their capabilities to be easily sampled by personal computers or common electronic devices. Indeed, smart phones, tablet PC and Personal Digital Assistant (PDA) already allow the use of these two biometric modalities. Speaker Verification systems usually work either in text-dependent or text-independent mode. In this paper, we use these two Speaker Verification (SV) working modes along with the on-line hand-written signature to set up our multimodal BAS. Indeed, these two SV modes may be very complementary for many applications. For example, during a phone access to sensitive data the textdependent system can focus on keywords while the textindependent system works on the whole client utterance. Therefore, we finally have three different biometric systems. We perform score fusion of those 3 systems by means of two different learning-based techniques: an additive CART-tree [5] classifier built with boosting [6], and Support Vector Machines (SVMs) [7]. SVMs have already been successfully used on multimodal biometric data [9, 10]. They have proven to be a powerful tool for classification, and well-suited for applications in which few data is available, as it is the case in identity verification. Also, decision trees have successfully been used to fuse the scores of biometric experts, for example in [11]. Moreover, boosting is known to be a very efficient tool to fit additive tree based classifiers [12]. It significantly improves performance and is also wellsuited for applications with few training data. Hence, we decided to use boosting to fit an additive CART-tree classifier for multimodal fusion purposes. Finally, we propose a comparison of these two fusion paradigms on the BIOMET data, as well as a test of their robustness regain in the presence of noise in part of this data. Indeed, the capture of speech in a real life application is often done in noisy conditions. It is therefore important to study the impact of noise in expert scores fusion as recently done in [13]. This paper is organised as follows: section 2 describes the speech and signature data from the BIOMET
database. Section 3 gives the principles of the signature verification expert, detailed in [14], as well as related experimental results. Section 4 describes the two speech verification experts. Fusion by additive CART-tree classifier and by SVM are studied in Section 5, with clean speech data first, and then with degraded speech data.
2. BIOMET brief description BIOMET is a multimodal biometric database including face, image, finger print, signature and voice. We exploit signature and voice data from 68 people with time variability, captured in the two last BIOMET acquisition campaigns, which have a five months spacing between them. More details on the BIOMET database can be found in [1].
2.1 Signature data The digitizer captures from each signature, at a rate of 200 samples per second, 5 parameters, including the coordinates of each point sampled on the trajectory (x(t), y(t)), the axial pen pressure p(t) in such a point, and the position of the pen in space (azimuth and altitude angles). The total number of genuine signatures available per person is 15 and 12 impostor signatures, made by four different impostors.
2.2 Speech data Both speech sessions of the BIOMET database were recorded in quiet environment and using the same kind of microphone. Sampling rate is 16 kHz and sample size is 16 bits. In both sessions, each speaker uttered twice the 10 digits in ascending and descending order before reading sentences. The amount of available speech for each speaker is about 90 seconds by session.
3. Signature verification 3.1 Pre-processing and encoding signatures There is noise in the data, on one hand due to the parameter quantification performed by the digitizer, and on the other hand its high sampling rate. Different filtering strategies were thus chosen according to each parameter, as motivated in [14]. Finally, 12 dynamic parameters are extracted on each point of the signature.
3.2 Modelling signatures As we have few signatures for training a signer's HMM, we used Bagging [15] to produce an "aggregated
HMM" of each signer's characteristics. Indeed, by combining models learned on different samplings of a given data set, one builds a model with a more complex and more stable output. We generated T different training sets, by sampling with replacement from the N original signatures at disposal for training purposes. We thus built T component models, which are T continuous left-to-right HMMs [2] with 2 states and 3 gaussians per state. We then computed a composite score S(O) on signature O, by averaging the T output scores obtained from the component models when a signature is presented. We then built a classifier as follows: in order to decide whether the claimed identity of signer i is authentic or not, we compute the absolute difference of the composite score Si(O) of his/her current signature O and the average value Si* of the T component models' output scores on their respective training data set (we have T data sets); finally, we compare this quantity to a threshold. Indeed, a signature O is accepted if and only if: (1) | Si(O) - Si* | < τ where τ is a global threshold, computed once for all signers, on a devoted database, as explained in Section 3.3.
3.3 Experimental setup In order to train each signer's aggregate model, all the signatures of the third campaign are used (N=10 signatures most of the time per person). Following the fact that the improvement of bagging is evident within ten replications of the original training set [15, 16], we chose T=10 as the number of component models to be used. Among each signer’s genuine signatures, 10 out of 15 are used to train the corresponding aggregate model, as described above. The remaining 5 genuine signatures and the 12 impostor signatures may be devoted to compute the global threshold τ in (1), or to test the system, according to the signer's number in the database: indeed, the database of 68 clients was split in two databases of 34 clients each: BA to compute the thresholdτ, and BT to test the system once the threshold has been computed. The optimal threshold is computed on BA following two criteria: the Equal Error Rate (EER) corresponding to FA = FR, FA being the False Acceptance Rate and FR the False Rejection Rate, and the minimum of the Total Error Rate (TE), that is the number of errors made by the system (of type FA and of type FR), over the total number of signatures (genuine signatures and forgeries as well) presented in BA. As we use an aggregate model for each signer, the optimal threshold is found on database BA as follows: for each possible value of τ, for each signature O belonging to signer i of BA, the corresponding composite score S(O) is computed by averaging the T=10 scores of
the T component models of signer i. Then the decision of acceptance or rejection is taken according to (1). The system is then tested on BT. Table 1 shows the performance obtained for both criteria EER and TE on such database, with the corresponding 95% confidence interval [17]. Table 1. Global performances of signers' aggregate models Criterion TE (%) FA (%) FR (%) EER 11.1 [±2.6] 9.5 [±3.0] 14.8 [±5.4] Minimum TE 11.9 [±2.7] 8.9 [±2.9] 20.1 [±6.0] Roughly, we notice that the signature expert presents a Total Error Rate of around 10% (with both criteria EER and Minimum TE), with a rather large confidence interval. This result can be explained by the low number of samples available in the BIOMET database compared to other on-line signature databases [18]. Generally, this difficulty is indeed inherent to personal identity verification applications: one can hardly imagine building very large databases of biometric data for each application. Also, the signature modality, contrary to other biometric modalities, has the particularity of forgeries that are made by impostors that intentionally imitate the genuine signatures which increases this difficulty.
4. Speech verification
Speaker Verification systems decision is mostly based on a simple hypothesis test between two hypotheses H λ and H λ with:
Hλ :
X has been uttered by λ
Hλ :
X has been uttered by another speaker
Hence, the score is usually based on two similarity measures and the claimed identity is confirmed according to:
D λ (X) D λ (X)
the text-independent approach, as described in Section 4.3, D λ (X) and D λ (X) respectively correspond to the
Pλ (X) and Pλ (X)
probability density functions
associated to the densities of H λ and H λ
given X.
The state-of-the-art approach consists in using Gaussian Mixture Models (GMMs) [4] to estimate those densities. The same kind of acoustic analysis is used in the textdependent and text-independent approach. Every 10ms, we first extract from each 20ms frame of speech a 32 dimensional acoustic vector composed of 16 mel-scale filter bank cepstral coefficients augmented by associated delta coefficients. Delta cepstra are computed over ± 2 feature vectors.
4.2 Text-dependent Speaker Verification In the text-dependent Speaker Verification system, the decision score is based on the DTW [3] distance between the training sequence Xλ of 4 digits with an utterance X of the same sequence of digits. As in [19], we use a cohort of speakers to compute D λ (X) . For each client λ, the cohort is composed of a set Γλ ={X1….XK} of K speech segments of speakers uttering the same sequence of digits. D λ (X) is the mean over Γλof the log-DTW distance between X and Xk with k=1…K. D λ (X) corresponds to
4.1 Introduction
log
Warping (DTW) [3] to compute D λ (X) and D λ (X) . In
≥ β accep λ < β rejec λ
(2)
where D λ (X) and D λ (X) are respectively the similarity measures of the speech utterance X conditionally to H λ and H λ and β is the decision threshold. As described in Section 4.2, the text-dependent Speaker Verification system relies on Dynamic Time
the log-DTW distance between X and Xλ . The decision score for a test sequence corresponds to the subtraction of log (D λ (X)) with log D (X) .
(
λ
)
4.3 Text-independent Speaker Verification In the text-independent Speaker Verification system, we use a single speaker-independent model to represent Pλ (X) . This model, also called UBM [4], corresponds to a 256 components GMM with diagonal covariance matrices. Each client model is obtained by a mean-only Bayesian adaptation of the UBM [4] using associated training speech data. The decision score for a test sequence corresponds to the mean log-likelihood ratio computed on the whole test utterance.
4.4 Experiments on speech data 4.4.1 Evaluation protocol. In both text-dependent and
independent Speaker Verification systems, the client or target speaker set is composed of 68 speakers from the BIOMET database. For the text dependent system, the training data for a target speaker is one utterance of 4 digits (about 2s of speech). The cohort of speakers is composed of 50 utterances of the same digits. Test data is composed of 5 genuine accesses and 12 impostor accesses. In the text-independent system, Pλ (X) is trained using the whole speech data available in the BIOMET database (about 4 hours of speech). Half of these 4 hours of speech are uttered by speakers that are not impostors nor clients. Each client model is adapted from the speaker using the 10 digits utterance (about 15s of speech). Test data is composed of a segment of speech of approximately 15s, taken from read utterances. The training speech material is based on digit vocabulary and the test speech material is based on uttered word. For each speaker we performed 5 genuine and 12 impostor accesses. Both systems have been evaluated under 3 different conditions of noise in test utterances: without noise, with a gaussian white noise of -10dB, and with a gaussian white noise of 0dB. 4.4.2 Results. Performances of text-independent and textdependent Speaker Verification systems are given respectively in Table 2 and Table 3.
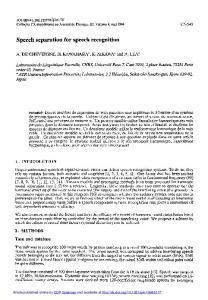
Boosting permits to construct efficient additive modelization from a socalled weak learner. Rk This weak-learner here corresponds to a classical binary tree built with the CART [5] algorithm. This Rk,l Rk,r algorithm permits one to construct a tree by recursive split of the observation space, here Figure 1. An additive corresponding to the 3-D tree classifier. The scores space of the observation space Rk is signature modality expert split into two subspaces k,l k,r and both speech R and R . verification experts. For instance, as shown in Figure 1, Rk is split in Rk,l and Rk,r when maximizing ∆H:
∆ H = H(R k ) - p l H(R
Table 3. Performances of the text-dependent Speaker Verification system SNR Criterion Error (%) FA (%) FR (%) without EER 13.5 [±2.9] 16.4 [±3.7] 7.1 [±3.9] noise Min. TE 10.3 [±2.6] 7.6 [±2.7] 17.0 [±5.7] EER 16.0 [±3.1] 19.8 [±4.0] 7.7 [±4.0] 10 dB Min. TE 11.9 [±2.7] 7.8 [±2.7] 22.1 [±6.3] EER 21.2 [±3.4] 25.3 [±4.4] 11.8 [±4.9] 0 dB Min. TE 16.5 [±3.1] 6.3 [±2.4] 42.0 [±7.4]
5. Fusion 5.1 Additive Tree Classifier
) - p r H(R
k, r
)
where H(Rk ), H(Rk, l ) and H(Rk, r ) are entropies of
nodes Rk, Rk,l and Rk,r with:
H(R) = p λ (R) ⋅ log (p λ (R) ) + p λ (R) ⋅ log (p λ (R) ) pl =
Table 2. Performances of the text-independent Speaker Verification system SNR Criterion Error (%) FA (%) FR (%) without EER 7.3 [±2.2] 5.8 [±2.4] 10.7 [±4.7] noise Min. TE 6.3 [±2.0] 2.0 [±1.4] 16.0 [±5.5] EER 12.0 [±2.7] 13.2 [±3.4] 9.5 [±4.4] 10 dB Min. TE 8.0 [±2.3] 2.0 [±1.4] 23.2 [±6.4] EER 29.4 [±3.8] 34.0 [±4.8] 19.0 [±5.9] 0 dB Min. TE 17.0 [±3.1] 6.0 [±2.4] 45.0 [±7.5]
k, l
N λ (R k ) N k, l N k, r , pr = and p λ (R) = k k N N N(R k )
in which Nk,l, Nk,r and Nk are respectively the number of observations in nodes Rk,l, Rk,r and Rk, and Nλ(Rk) is the number of observations of class λ in Rk. In our experiments, a node Rk is split only if Nk > 50. The score Si associated to each vector s=[s1, s2, s3] is
Si = log
p(λ s) p(λ s)
,
with
p(λ s) = p λ (R )
and
p(λ s) = p λ (R ) if s is affected to the region R by the tree. Given CART, a one-tree building algorithm, we use RealAdaboost [20] to fit an additive model. In this iterative algorithm, observations that have been incorrectly classified by the previous trees in the training ensemble are resampled with higher probability, leading to a new probability distribution for the next training ensemble. The fusion decision score S is then obtained as the mean over all trees of Si .
5.2 Support Vector Machines
In few words, SVMs' goal is to look for a hyperplane in a large dimension space which is considered because the input data are not linearly separable in the original space. We maximize the distance between the surface and the data, which leads to good generalization performance. Let X=(xi) be the data with labels Y=(yi) where yi = +1 or -1 represents the class of each person, and Φ is the function which sends the input data X in the feature space F. The distance between the hyperplane H(w,b) = {x ∈ F : + b = 0} and X is called the margin ∆. Following the Structural Risk Minimization (SRM) principle, Vapnik [7] has shown that maximizing the margin (or minimizing ||w||) leads to an efficient generalization criterion. One defines in F the kernel K as: K(x,y) = Thanks to this function, we avoid handling directly elements in F. The optimal hyperplane is found by solving, as shown in [7], a quadratic convex problem and, from the optimality conditions of Karush-Kuhn-Tucker, one can rewrite w in the following condensed manner: (3) w = Σi ∈ SV αi yi Φ(xi ) where SV = {i: αi > 0} denotes the set of support vectors. The choice of Φ or equivalently K is very important in order to obtain an efficient solution. Traditionally, one chooses the Vapnik polynomial kernel K(x,y)=d or the Gaussian kernel K(x,y)=exp(γ||x-y||2). We have chosen a linear kernel (d = 1). Indeed, the use of this type of kernel in a similar fusion case [8] gave better performance, compared to other choices. We will fuse the scores of the three experts, each designed for the same person. We thus put at the SVM three inputs, one per expert. The first one, for the signature modality, given signature O, is: (4) (Si(O) – Si*)/σ where Si(O) and Si* are defined in Section 3.2; σ is the average of the standard deviations σ(i) computed for person i in FLB as follows: we consider the scores given by the T component models of person i on the T corresponding genuine signatures data sets generated for bagging; and we compute their standard deviation σ(i). The second and third inputs to the SVM are the quantity log {D (X)/D (X) } in equation (2), where λ and λ
λ
λ are respectively estimated in text-independent and text-
dependent modes described in sections 4.2 and 4.3.
5.3 Experiments 5.3.1. Fusion database. Following the same protocol as the one of the signature framework, we split the database
of 68 persons in 2 subsets of 34 persons each, respectively named FLB (Fusion Learning Base) and FTB (Fusion Test Base). For each person in FLB and FTB, we have in general at disposal 5 genuine bimodal values and 12 imitation bimodal values. 5.3.2. Results. Table 4 presents the results of the different verification systems (Signature, Text-independent (TI) Speech, and Text-dependent (TD) Speech) as well as the results of the two fusion systems (Additive Tree Classifier (ATC) and SVM) for individuals of FTB, with the corresponding 95% confidence interval. These results have been obtained through a minimization of the global error rate TE. Table 4. The performance of the fusion systems Model Signature TI Speech Speech TD Speech without ATC noise SVM TI Speech TD Speech SNR: 10dB ATC SVM TI Speech TD Speech SNR: 0dB ATC SVM
TE (%)
FA (%)
FR (%)
11.9 [±2.7] 8.9 [±2.9] 20.1 [±6.0] 6.3 [±2.0] 2.0 [±1.4] 16.0 [±5.5] 10.3 [±2.6] 7.6 [±2.7] 17.0 [±5.7 2.8 [±1.4] 1.7 [±1.3] 5.2 [±3.3] 2.7 [±1.4] 1.3 [±1.1] 5.9 [±3.6] 8.0 [±2.3] 2.0 [±1.4] 23.2 [±6.4] 11.9 [±2.7] 7.8 [±2.7] 22.1 [±6.3] 2.9 [±1.4] 2.5 [±1.6] 3.9 [±2.9] 2.9 [±1.4] 1.9 [±1.4] 5.3 [±3.4] 17.0 [±3.1] 6.0 [±2.4] 45.0 [±7.5] 16.5 [±3.1] 6.3 [±2.4] 42.0 [±7.4] 6.7 [±2.1] 4.7 [±2.1] 11.2 [±4.8] 5.8 [±2.0] 2.4 [±1.5] 13.6 [±5.2] Roughly, we notice that in all cases, fusion reduces error rates of the best monomodal system by a factor 2. Also, it appears that the ATC and the SVM are equivalent in these experiments, in all the configurations here considered (clean or noisy environments). Finally, both fusion systems here studied show a good resistance to noise.
6. Conclusions In this article, we have shown that the use of data fusion allows to improve significantly the performance of three unimodal identity verification systems. Indeed, we had at our disposal one signature and two speaker verification systems. We compare an Additive Tree Classifier (ATC) and a SVM on the BIOMET multimodal database and also study their robustness to the presence of noise in speech data. Two levels of degraded speech data were considered. It appears that the ATC gives very good results, equivalent to those of the SVM, and that in clean or noisy environments. This shows the importance of the boosting algorithm here used to build the ATC. Also, both fusion systems are resistant to the presence of noise.
Indeed, in the best conditions, the Total Error Rate is around 2.8% for both fusion systems, and this rate is hardly lowered (to 2.9%) in the presence of noise at -10 dB. These results are encouraging, since few data is used to train the fusion systems.
7. References
[13] C. Sanderson, K. K. Paliwal, “Information Fusion and Person Verification using Speech and Face Information”, IDIAP Research Report, 02-33, September 2002. [14] M. Fuentes, S. Garcia-Salicetti, B. Dorizzi "On-line Signature Verification: Fusion of a Hidden Markov Model and a Neural Network via a Support Vector Machine", IWFHR8, August 2002.
[1] S. Garcia-Salicetti, C. Beumier, G. Chollet, B. Dorizzi, J. Leroux-Les Jardins, J. Lunter, Y. Ni, D. Petrovska-Delacretaz, "BIOMET: a Multimodal Person Authentication Database Including Face, Voice, Fingerprint, Hand and Signature Modalities", 4th International Conference on Audio and VidioBased Biometric Person Authentication, 2003.
[15] L. Breiman, "Bagging predictors", Machine Learning, 24(2), pp. 123-140, 1996.
[2] L. Rabiner, B.H. Juang, "Fundamentals of Speech Recognition", Prentice Hall Signal Processing Series, 1993.
[17] P. Verlinde, “A Contribution to Multimodal Identity Verification Using Decision Fusion”, Ph.D. Thesis, Department of Signal and Image Processing, Telecom Paris, France, 1999.
[3] Furui S., “Cepstral Analysis Technique for Automatic Speaker Verification”, IEEE Trans. Acoustic, Speech, Signal Processing, Vol ASSP – 29, 254-272, 1981. [4] D. A. Reynolds, T. F. Quatieri and R. B. Dunn, "Speaker verification using adapted Gaussian mixture models," Digital Signal Processing, Vol. 10, No. 1, pp. 19-41, Jan. 2000. [5] L. Breiman, J.H. Friedman, R.A. Olshen, C.J. Stone, “Classification and Regression Trees”, Belmont, CA: Wadsworth, 1984. [6] Y. Freund, “Boosting a Weak Learning Algorithm by Majority”, Proceedings of the Third Workshop on Computational Learning Theory, Morgan-Kaufman, 202-216, 1990. [7] V. Vapnik, “The Nature of Statistical Learning Theory”, Statistics for Engineering and Information Science, Second Edition, Springer, 1999. [8] S. Ben-Yacoub, "Multi-Modal Data Fusion for Person Authentification using SVM", IDIAP Research Report 98-07, 1998. [9] S. Ben-Yacoub, Y. Abdeljaoued and E. Mayoraz, “Fusion of Face and Speech Data for Person Identity Verification”, IEEE Trans. On Neural Networks, Vol. 10, No 5, 1999, pp. 10651074. [10] B. Gutschoven, P. Verlinde, “Multimodal Identity Verification using Support Vector Machine”, Fusion 2000, 2000. [11] Arun Ross, Anil Jain and Jian-Zhong Qian, “Information Fusion in Biometrics”, 3rd Int'l Conference on Audio- and Video-Based Person Authentication, AVBPA, pp. 354-359, Sweden, June 6-8, 2001. [12] H. Drucker and C. Cortes. “Boosting decision trees”. Advances in Neural Information Processing Systems, volume 8. 1996.
[16] J.R. Quinlan, "Bagging, Boosting, and C4.5", Proceedings of the 13th National Conference on Artificial Intelligence, pp. 725-730, 1996.
[18] J.G.A. Dolfing, “Handwriting Recognition and Verification, a Hidden Markov Approach”, Ph.D. Thesis, Philips Electronics N.V., 1998. [19] Rosenberg, A., J. DeLong, C-H. Lee, B-H. Juang, and F. Soong. "The Use of Cohort Normalized Scores for Speaker Verification" International Conference on Spoken Language Processing in Banff, University of Alberta, 599 - 602, 1992 [20] J. Friedman, T. Hastie and R. Tibshirani, “Additive logistic regression: a statistical view of boosting”, Dept. of Statistics, Stanford University Technical Report, 1998.