to best measure the similarity between the delay patterns of the landmarks and the one observed for ... a more accurate Internet host location from delay measurements. ... local advertising on web pages, automatic selection of a language to first ..... other host in the set during a period of 10 weeks from early December 2002.
Similarity Models for Internet Host Location Artur Ziviani∗† , Serge Fdida∗ ∗ Laboratoire
d’Informatique de Paris 6 (LIP6) Universit´e Pierre et Marie Curie Paris, France Email: {Artur.Ziviani, Serge.Fdida}@lip6.fr
Abstract— A whole new class of location-aware services may be envisaged by the deployment of a geographic location service for Internet hosts. We focus on a technique that relies on delay measurements and the exploitation of a possible correlation between geographic distance and network delay. Our investigation shows that such a correlation becomes stronger as connectivity becomes richer. Host locations are inferred by comparing delay patterns of geographically distributed landmarks (hosts with a known geographic location) with the delay pattern of the target host to be located. The problem we deal with is how to best measure the similarity between the delay patterns of the landmarks and the one observed for the target host. The location estimation of the target host is the location of the landmark that presents the most similar delay pattern with respect to the one of the target host. We define and evaluate three similarity models. Experiments show that the previously adopted Euclidean distance is outperformed by other similarity models, resulting in a more accurate Internet host location from delay measurements.
I. I NTRODUCTION
A
PPLYING the concept of location-awareness to the Internet allows us to envisage the development of locationbased services that take into account where the users are accessing from. Examples of such new Internet services are local advertising on web pages, automatic selection of a language to first display the content, or authorization of transactions only when performed from pre-established locations. In the Internet context, however, there is no direct relationship between a host identification and the host physical location. Frameworks for estimating distance between two Internet hosts have been recently proposed, such as IDMaps [1] and Global Network Positioning (GNP) [2]. Nevertheless, such frameworks provide distance between two hosts in terms of delay, not geographic distance. A DNS-based approach to register the geographic location of Internet hosts is proposed in RFC 1876 [3]. In spite of that, the adoption of the DNSbased approach is restricted since it requires changes in the DNS records and administrators have no motivation to register new location records. Padmanabhan and Subramanian [4] investigate three important techniques to infer the geographic location of an Internet host. The first technique infers the location of a host based on the DNS name of the host or another nearby node. Quite often network operators assign names to routers
Jos´e F. de Rezende†, Otto Carlos M. B. Duarte† † Grupo
de Teleinform´atica e Automac¸a˜ o (GTA) COPPE/EE – Universidade Federal do Rio de Janeiro Rio de Janeiro, Brazil Email: {rezende, otto}@gta.ufrj.br
that have some geographic meaning, presumably for administrative convenience. For example, the name bcr1-so-20-0.Paris.cw.net indicates a router located in Paris, France. Nevertheless, not all names contain an indication of location. Furthermore, since there is no standard, operators commonly develop their own rules for naming their routers even if the names are geographically meaningful. Therefore, the creation and management of such rules is a challenging task as there is no common standard to follow. The second technique splits the IP address space into clusters such that all hosts with an IP address within a cluster are likely to be co-located. Knowing the location of some hosts in the cluster and assuming they are in agreement, the technique infers the location of the entire cluster. This technique, however, relies on information that tends to be partial and possibly inaccurate. The information is partial as it comprises location information for a relatively small subset of the IP address space. Moreover, such an information may be inaccurate as the databases rely on data provided by users, which may not necessarily provide accurate information. The third technique relies on delay measurements and the exploitation of a possible correlation between geographic distance and network delay. The location estimation of a host is based on the assumption that hosts with similar network delays to some fixed probe machines tend to be located near each other. Therefore, evaluating how similar the delay patterns from the geographic reference hosts are with respect to the delay pattern of the host to be located is a key point for the accuracy. In this paper, we investigate different similarity models and how accurate they are for the Internet host location from measurements. Such similarity models compare the delay patterns of the concerned hosts and indicate the most similar geographic reference host with respect to the host to be located. Padmanabhan and Subramanian [4] have adopted Euclidean distance as a means to assess the similarity of the observed delay patterns. One of our similarity models includes the previously adopted Euclidean distance and we use this distance as a reference for evaluation. Results show that Euclidean distance is outperformed by other similarity models that provide more accurate estimations for the measurementbased Internet host location. This paper is organized as follows. In Section II, we study
700
250 1 Possible outliers
600
2
3
200
RTT (ms)
RTT (ms)
500 400 300
150
North America Cluster
100 R = 0.7283
200
R = 0.8534 50
100 Western Europe Cluster 0
0 0
Fig. 1.
2000
4000
6000
8000 10000 12000 14000 16000 18000 Distance (km)
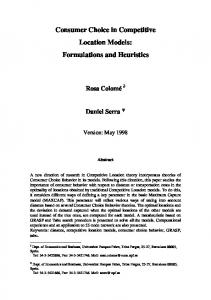
Scatter plot of geographic distance and network delay.
the correlation between geographic distance and network delay. Section III introduces a formalization of the host location inference from delay measurements. Section IV presents the similarity models we evaluate. Results on the assessment of such similarity models are shown in Section V. In Section VI, we present our conclusions. II. C ORRELATION
BETWEEN
D ISTANCE
AND
D ELAY
In order to study the correlation between geographic distance and network delay, we performed measurements from the LIP6 laboratory located in Paris, France, to 135 target hosts with well-known locations all over the world. The set of target hosts is mainly composed of university sites extracted from library servers around the world [5]. The geographic distribution of the target hosts is as follows: 56 in North America, 44 in Western Europe, 11 in Asia, seven in Eastern Europe, seven in Latin America, four in the Middle East, three in Africa, and three in Oceania. From the 135 original target hosts, 109 hosts (approximately 80%) have answered the ping requests. The considered delay is the minimum of several measurements to avoid delays due to congestion in intermediate routers. Fig. 1 presents the scatter plot of the geographic distance and the minimum delay between our probe machine and each target host. A weak correlation is observed between geographic distance and network delay worldwide, resulting in a coefficient of correlation R = 0.2971. Some points are significantly away from the remaining ones. For about the same geographic distance, the observed delay may be greater by one order of magnitude. For example, points 1, 2, and 3 correspond to hosts located in Algeria, Turkey, and Iran, respectively. The ping packets from our probe machine located in Paris to Algeria (point 1), for instance, actually make their way through routers located in New York City. Routes toward some locations may take directions far from the straightforward physical direction because of the poor connectivity in certain regions. Geographic properties of Internet routing are further studied in [6].
0
Fig. 2.
2000
4000 6000 Distance (km)
8000
10000
Correlation between distance and delay (richer connectivity).
Poor connectivity weakens the correlation between geographic distance and network delay. From the set of 109 answering hosts, the 80 hosts located in North America and Western Europe have been identified. Such regions are likely to have the richest connectivity linking their hosts. Fig. 2 shows the correlation between geographic distance and network delay considering only the hosts located in North America and Western Europe. The regions likely to have a richer connectivity have a much stronger correlation between geographic distance and network delay. Even if there are a few isolated points away from the remaining points, one clearly identifies two main clusters in Fig. 2. Such clusters correspond to hosts located in Western Europe and North America. Excluding the points that clearly remain out of the pack for both clusters (one outlier for the Western Europe cluster and two outliers for the North America cluster) results in the following coefficients of correlation: R = 0.7283 for the Western Europe cluster and R = 0.8534 for the North America cluster. From our study we observe a weak correlation between geographic distance and network delay worldwide. Nevertheless, we observe a much stronger correlation on regions presenting richer connectivity, indicating that the correlation becomes stronger as connectivity becomes richer. Furthermore, within regions with richer connectivity, hosts located in nearby areas have similar delays to the fixed measurement point. Recent findings [7], [8] indicate a strong correlation between population and router density in economically developed countries. Moreover, most users and consequently most hosts to be located are likely to be in regions presenting richer connectivity, whereby a stronger correlation between distance and delay holds. III. M EASUREMENT-BASED H OST L OCATION In general, there is no strong enough correlation between geographic distance and network delay to capture such a relationship under a mathematical model. GeoPing [4] adopts an empirical approach based on the observation that hosts
P1
P1
L1
P1
L1 T
P2
L1
P1
T P2
T
L1 T
P2
Delay_P1
P2 Location Estimation
T Delay_P2 L2
L2 L3
Location Server
(a)
L2 L3
(b) Fig. 3.
d11 d21 D = ... dK1 dT 1
d12 d22 .. . dK2 dT 2
Location Server
L3
(d)
Inferring a host location from delay measurements.
d1N d2N .. . . . . dKN . . . dT N
... ... .. .
L2
L3
(c)
sharing similar delays to other fixed hosts tend to be near each other geographically. Here we formalize the problem of inferring a host location from delay measurements. Consider a set L = {L1 , L2 , . . . , LK } of K landmarks. Landmarks are reference hosts with a well known geographic location. Consider a set P = {P1 , P2 , . . . , PN } of N probe machines. Fig. 3 illustrates the steps in inferring a host location from delay measurements, which are detailed along this section. The probe machines determine periodically the network delay (actually the minimum delay of several measurements) to each landmark (Fig. 3(a)). Therefore, each probe machine Px , 1 ≤ x ≤ N , keeps a delay vector dx = (d1x , d2x , . . . , dKx ), where dix is the delay between the landmark Li ∈ L and the probe machine Px . Suppose one wants to determine the location of a given target host T . A location server that knows the sets of landmarks L and of probe machines P is then contacted. The location server asks the N probe machines to measure the delay to host T (Fig. 3(b)). Each probe machine Px , 1 ≤ x ≤ N , returns a delay vector d′x = (d1x , d2x , . . . , dKx , dT x ), i.e., the delay vector dx plus the just measured delay to host T (Fig. 3(c)). After receiving the delay vectors from the N probe machines, the location server is able to construct the delay matrix D with dimensions (K + 1) × N :
Location Server
(1)
The delay vectors gathered by the location server from the probe machines correspond to the columns of the delay matrix D. The location server then compares the lines of the delay matrix D to estimate the location of host T . To infer the location of host T , the landmark L presenting the most similar delay pattern with respect to the delay pattern of host T is determined. The corresponding location of the landmark L is the location estimation of host T (Fig. 3(d)). The delay matrix D combined with the knowledge of the location of the landmarks from the set L compose a delay
map recording the relationship between network delay and geographic location. We propose a demographic approach to place landmarks and probe machines in [9]. Two main aspects contribute to the robustness of this technique against factors that may weaken the correlation between geographic distance and network delay. First, delay is measured from multiple geographically distributed probe machines rather than from one single location. Second, the minimum among several delay samples is considered rather than one individual delay sample. Geoping [4] adopts Euclidean distance as a similarity model to measure how similar the delay vectors of the K landmarks and the delay vector of host T are. The landmark L providing the smallest Euclidean distance e = p (dy1 − dT 1 )2 + . . . + (dyN − dT N )2 from host T , for 1 ≤ y ≤ K, is the nearest landmark with respect to host T . How to evaluate the most similar delay pattern from a landmark with respect to the one of host T is a key point for the accuracy. Therefore, we are interested in investigating alternative similarity models to better select the landmark that will provide the location estimation of the host T to be located. IV. S IMILARITY M ODELS We define three similarity models to evaluate how similar the delay patterns of a particular landmark and of the target host to be located are. The similarity function S(x, y) : RN → [0, 1] is defined to measure the degree of similarity between two delay patterns x and y. We adopt such a function to evaluate the degree of similarity between the delay patterns gathered by the probe machines from each landmark and the target host. The landmark that presents the most similar delay pattern with respect to the one of the target host provides the location estimation of that host. A. Cosine-based Similarity In the first similarity model, the two delay patterns are thought of as two vectors in a N -dimensional delay space. The similarity between them is measured by computing the cosine of the angle θ between the delay vectors x and y as cos θ =
x·y kxkkyk
(2)
450
where “·” denotes the dot-product of the two vectors. Formally, the cosine-based similarity between the delay patterns x and y, denoted by Scos (x, y), is given by cos θ + 1 · 2
(3)
B. Correlation-based Similarity
350 300 Delay (ms)
Scos (x, y) =
400
In this case, similarity is measured by computing the coefficient of correlation between the two delay patterns x and y. σ2 This coefficient of correlation is defined as corr(x, y) = σxxy σy , 2 where σxy denotes the covariance between x and y, and σx is the standard deviation of x. The correlation-based similarity, denoted by Scor (x, y), is thus given by Scor (x, y) =
corr(x, y) + 1 · 2
250 200 150 100 R = 0.6272
50
y = 0.011587 * x
0 0
Fig. 4.
2000
4000
6000
8000 10000 12000 14000 16000 18000 20000 Distance (km)
Correlation between distance and delay for the RIPE data set.
(4) 250
C. Distance-based Similarity We represent the distance u(x, y) between the two delay patterns x and y by N X
γ
|xi − yi |
i=1
# γ1
,
γ > 0.
(5)
Delay (ms)
u(x, y) =
"
200
150
100
When γ = 1, we have the Manhattan or city-block distance. In contrast, for γ = 2, we have the Euclidean distance. Furthermore, 0 < γ < 1 results in a non-metric distance function adequate to be used if distances do not satisfy the triangle inequality. The distance-based similarity, denoted by Sdis (x, y), is given by
50 R = 0.8983 0
Sdis (x, y) = e
,
β > 1, α > 0,
(6)
where β is a scaling factor defined as β = max 1, i,j
1 2
P �! y x j i j i · + kxk kyk
�P
(7)
V. E XPERIMENTAL R ESULTS A. Data Set We perform our evaluation of the different similarity models on data collected from the Test Traffic Measurements (TTM) project of the RIPE network [10]. The RIPE data set is composed by the 2.5 percentile of the delay observed from each RIPE host to each other host in the set during a period of 10 weeks from early December 2002 until February 2003. All 55 hosts on the RIPE network are equipped with a GPS card, thus allowing their exact geographic position to be known. The hosts in the RIPE network are geographically distributed as follows: 42 in Western Europe, five in the US, three in Eastern Europe, two in the Middle East, two in Oceania, and one in Asia. In contrast with the data set used in the experiment of Section II, where we had one probe machine gathering delay measurements from 135 landmarks, the RIPE data set gives
2000
4000
6000
8000 10000 12000 14000 16000 18000 20000 Distance (km)
Fig. 5. −(u(x,y)/β)α
y = 0.010756 * x
0
Correlation disregarding the outlier host in the RIPE data set.
us the possibility of considering multiple points of measure. As we have the measured delay from each single host to any other host in the RIPE network, any host in the set may be viewed as a probe machine, as a landmark, or both. We select one of the hosts to act as the target host to be located. The remaining hosts in the set are then used as probe machines and landmarks to perform the location estimation of that target host. B. Correlation between Distance and Delay We study the correlation between geographic distance and network delay within the RIPE data set. The delays observed between each pair of RIPE hosts are asymmetric, presumably due to asymmetries in routing and in concurrent traffic load. As a consequence, we consider individually the point of view of each host toward the other hosts in the set. The correlation between geographic distance and network delay within the whole RIPE data set is shown in Fig. 4. For the whole RIPE data set, there is a moderate correlation between distance and delay (R = 0.6272). Nevertheless, we have observed that one single host in the RIPE network significantly contributes to weaken such a correlation. Fig. 5 presents the correlation for the RIPE data set without the out-
Sdis (α = 0.1)
20
15
10
C. Effects on Ranking Landmarks
5
Fig. 6.
Scos
Scor
γ=6
γ=5
γ=4
γ=3
γ=2
γ=1
γ = 0.5
γ = 0.75
γ = 0.25
γ=6
γ=5
γ=4
γ=3
γ=2
γ=1
γ = 0.5
γ = 0.75
γ = 0.25
0
Average rank of the ideal landmark.
100
80 Cumulative Probability (%)
In this subsection, we analyze the performance of the different similarity models in ranking the landmarks to provide a location estimation of a target host to be located. Each host in the RIPE data set is considered one at a time a target host to be located. The remaining hosts are then used as probe machines and landmarks to perform the location estimation of the target host. We repeat this procedure to evaluate the location estimation of each host in the RIPE data set. As we know the geographic position of each host due to the GPS cards, we are able to determine the ideal landmark to be chosen by the similarity models. The ideal landmark is the geographically closest landmark to the target host. We analyze the performance of the similarity models in ranking the ideal landmark for each target host. Each similarity model provides us with an ordered list of landmarks in terms of the similarity presented by their delay patterns with respect to the delay pattern of the target host. We then observe the rank the ideal landmark scores on the ordered list resulting from each evaluated similarity model. Fig. 6 presents the average rank of the ideal landmark for the analyzed similarity models. The best performance is obtained by the distance-based similarity model when γ = 1, equivalent to the city-block distance. The city-block distance also has the lowest sensitivity to the considered values of α since it presents a similar performance independent of the value of this parameter. Moreover, the city-block distance outperforms the Euclidean distance previously adopted in [4] as well as the cosine-based and correlation-based similarity models. The previously adopted Euclidean distance performs similarly to the correlation-based similarity model. The distance-based similarity model is more sensitive to the variation of the distance parameter γ for larger values of α. The adopted values of γ and α exert a great influence on the performance of the distance-based similarity model. The results obtained by the correlation-based and cosinebased similarity models are embraced within the performance range of the distance-based model. For α = 0.1, good performances are achieved by the distance-based model with non-metric distances (0 < γ < 1). Some experiments show that the triangle inequality does not hold over all parts of the Internet [1], indicating that the adoption of non-metric distances may be suitable in some cases. The cumulative probability of ranking the ideal landmark for different similarity models is depicted in Fig. 7. We
Sdis (α = 1)
25
Average Rank
lier host. A significantly stronger correlation between distance and delay (R = 0.8983) is observed disregarding the outlier host. Performing a traceroute toward the outlier host, one single link on the path strongly contributes to the end-toend delay. In accordance with the experiments presented in Section II, we observe once more that a richer connectivity strengths the correlation between geographic distance and network delay.
60
40
Sdis-1-1 Sdis-2-1 Scor Scos
20
0 1
5
10
15
20
25
30
Rank
Fig. 7.
Cumulative probability of the rank of the ideal landmark.
compare the distance-based similarity model (presented in the form Sdis –γ–α) for city-block and Euclidean distances with the correlation-based and cosine-based similarity models. As the Euclidean distance has been previously adopted, we use it as a performance reference for comparison. We observe that the distance-based similarity model with city-block distances outperforms the remaining ones. The correlation-based similarity model provides an equivalent performance to the distance-based similarity model with Euclidean distance. D. Effects on Distance Accuracy In this subsection, we evaluate the distance accuracy from the target host and the location estimation provided by each considered similarity model. The provided location estimation corresponds to the location of the landmark chosen by each similarity model as having the most similar delay pattern with respect to the delay pattern of the target host. Therefore, we compare the performance of the different similarity models in terms of the error distance from the selected landmark and the target host to be located. Fig. 8 presents the average distance between the target host and the elected closest landmark. Such results are the average of each element of the RIPE data set being considered one at a
100 Sdis (α = 0.1)
Sdis (α = 1)
2000
Cumulative Probability (%)
80
Average Distance (km)
1750 1500 1250 1000 750 500
60
40 Upper Bound Sdis-1-1 Sdis-2-1 Scos Scor
20
250
Fig. 8.
Scos
Scor
γ=6
γ=5
γ=4
γ=3
γ=2
γ=1
γ = 0.5
γ = 0.75
γ = 0.25
γ=6
γ=5
γ=4
γ=3
γ=2
γ=1
γ = 0.5
γ = 0.75
γ = 0.25
0
Average distance from the target to the location estimation.
time a target host. The remaining hosts are then used as landmarks and probe machines to perform the location estimation. As in the ranking landmarks evaluation, the best performance is achieved by the distance-based similarity model for the cityblock distance (γ = 1) and α = 1. However, the insensitivity to α is not the same for the distance accuracy as in the evaluation of ranking the ideal landmark. The correlationbased similarity model presents a similar performance to the non-metric distances with α = 0.1, outperforming the distance-based similarity model with Euclidean distance. It should be noted that the RIPE data set is relatively small. Using one host as the target host results in 54 landmarks to choose from to infer a location estimation. Even if the elected landmark is the geographically closest landmark to the target host, not necessarily it is nearby the target host. For example, the RIPE host in Tokyo is the only one in Asia and its ideal landmark is located in Finland, 7819 kilometers away. The average distance from the ideal landmarks to their respective target hosts is 405 kilometers, which is the best result the similarity models can reach for this data set. The cumulative probability of the distance between the target host and the selected closest landmark is shown in Fig. 9. Again, we compare the correlation-based and the cosine-based similarity models with the distance-based similarity model for city-block and Euclidean distances. The “Upper Bound” for the RIPE data set is the best possible performance for this relatively small data set. Such an upper bound consists of the distances from the ideal landmarks to their respective target hosts. One observes that the city-block distance within the distance-based similarity model (Sdis –1– 1) slightly outperforms the remaining models, presenting the closest performance to the upper bound. VI. C ONCLUSION The contribution of this paper is twofold. First, we study the correlation between geographic distance and network delay. Poor connectivity weakens such a correlation. We observe for two different data sets that the correlation between distance and delay becomes stronger as connectivity becomes richer.
0 0 250 500
Fig. 9.
1000
1500 2000 Distance (km)
3000
4000
Cumulative probability of the distance (km).
Second, we investigate different similarity models and their accuracy in Internet host location from delay measurements. The similarity models select the landmark that provides the location estimation of the target host to be located, thus being a key component for accuracy. Despite such a fact, Euclidean distance was the only similarity model that has been previously adopted. Our findings show that the distancebased similarity model with α = 1 and city-block distance outperforms the remaining similarity models, resulting in a more accurate geographic location estimation of Internet hosts from delay measurements. ACKNOWLEDGMENT This work is supported by CAPES/COFECUB, FUJB, and CNPq. Artur Ziviani has a scholarship from CAPES/Brazil. R EFERENCES [1] P. Francis, S. Jamin, C. Jin, Y. Jin, D. Raz, Y. Shavitt, and L. Zhang, “IDMaps: A global Internet host distance estimation service,” IEEE/ACM Transactions on Networking, vol. 9, no. 5, pp. 525–540, Oct. 2001. [2] T. S. E. Ng and H. Zhang, “Predicting Internet network distance with coordinates-based approaches,” in Proc. of the IEEE INFOCOM’2002, New York, NY, USA, June 2002. [3] C. Davis, P. Vixie, T. Goowin, and I. Dickinson, “A means for expressing location information in the domain name system,” Internet RFC 1876, Jan. 1996. [4] V. N. Padmanabhan and L. Subramanian, “An investigation of geographic mapping techniques for Internet hosts,” in Proc. of the ACM SIGCOMM’2001, San Diego, CA, USA, Aug. 2001. [5] LibWeb, http://sunsite.berkeley.edu/Libweb. [6] L. Subramanian, V. N. Padmanabhan, and R. Katz, “Geographic properties of Internet routing: Analysis and implications,” in Proc. of USENIX 2002, Monterey, CA, USA, June 2002. [7] S.-H. Yook, H. Jeong, and A.-L. Barab´asi, “Modeling the Internet’s large-scale topology,” Proc. of the National Academy of Sciences (PNAS), vol. 99, pp. 13 382–13 386, Oct. 2002. [8] A. Lakhina, J. W. Byers, M. Crovella, and I. Matta, “On the geographic location of Internet resources,” IEEE Journal on Selected Areas in Communications, 2003, – Special Issue on Internet and WWW Measurement, Mapping, and Modeling, in press. [9] A. Ziviani, S. Fdida, J. F. de Rezende, and O. C. M. B. Duarte, “Demographic placement for Internet host location,” in Proc. of the IEEE Global Communications Conference - GLOBECOM’2003, San Francisco, CA, USA, Dec. 2003. [10] RIPE Test Traffic Measurements, http://www.ripe.net/ttm/.