SIMPLE AGENT-BASED COMPUTATIONAL MODEL OF MARKET WITHOUT INTERMEDIATION Michal Kvasniˇcka Masaryk University, Faculty of Economics
[email protected]
Abstract. This paper describes an agent-based computational model of a market with reservation prices without intermediation. The market institutions are parameterized, and cover Smith’s CDA market, Chamberlin’s unorganized market, and many other types of markets. The model allows us to estimate the relative contribution of the individual institutional elements to the market efficiency. Keywords. Simulation, agent-based economics, market, market institutions, market efficiency, mechanism design. JEL C150 D020 D400 D440 D490 D800
1
Introduction
The goal of this study is to explore the impact of institutions on the efficiency of a market with reservation prices without intermediation. Specifically, we try to explore how much the individual institutional elements contribute to the experimentally known efficiency of the continuous double auction. For the reasons explained bellow, we use an agent-based computational model for this. The structure of the paper is as follows: 1) we review the relevant literature, 2) we describe our model, and 3) we present the results of the simulations.
2
Literature Review
Hayek [5] claimed that knowledge is dispersed in the society and that “[w]e must look at the price system as such a mechanism for communicating information. . . ” (p. 526). However, there had been no way to test the hypothesis that markets are able to gather, process, and spread information in the way described by the competitive price theory until the first experiments were conducted. The first market experiment was conducted by Chamberlin [3]. He divided students into buyers and sellers, gave each of them one unit to trade, a secret reservation price (the lowest price for which a seller can sell, or the highest price for which a buyer can buy), and asked them to trade. Neither speculative purchases, nor short sales were allowed. Beside these, he imposed no market institutions. The students were going around the class, meeting in pairs or small groups, and haggling. As soon as they traded, they dropped from the market, and the price was recorded. The market was closed when no transaction took place for some time. The outcomes did not support the Hayek’s hypothesis: 1) the quantity traded was bigger than equilibrium, 2) the prices were in average below equilibrium, and 3) there was no tendency toward equilibrium. Chamberlin claimed: “My own skepticism as to why actual prices should in any literal sense tend toward equilibrium during the course of a market has been increased not so much by the actual data of the experiment . . . as by failure . . . to find any reason why it should be so” (p. 102). Later, Smith [7] conducted other experiments. They were similar to the Chamberlin’s one with two important differences: 1) there were many trading days, i.e. when the market was closed, the traders were given new units to trade and the market was reopened, which allowed the traders to learn from the past, and 2) he imposed a peculiar market organization: the continuous double auction (CDA). In this kind of auction all traders stand together, can ask or bid at any time, accept the last proposal, and hear what is going on on the market. Smith reported radically different outcomes than Chamberlin: he claimed that “[e]ven where numbers are ‘small’, there are strong tendencies for a supply and demand competitive equilibrium to be attained. . . ” (p. 134). Thus from Smith [7] and subsequent experiments we know that markets are indeed able to communicate private knowledge (reservation prices) efficiently, and reach the competitive equilibrium. However, for many decades we lacked a formal model explaining how the equilibrium is attained. The neoclassical models cannot explain this because they presuppose the equilibrium. Another modeling technique was needed that would be able to model the adjusting processed explicitly. One such technique is the agentbased computational economics (ACE). In ACE we proceed in two steps: 1) we describe the behavior of 204
the economic agents. The agents are not optimizing units, but software robots pursuing their goals based on their reaction functions which need to be neither optimal, nor analytically tractable. 2) We simulate interactions among the robots and observe both their behavior and the behavior of the overall system consisting of them. The interactions may, or may not lead to an equilibrium. The model provides no analytical solution, only simulation data to be statistically analyzed. For more information on ACE see [8]. The first ACE model of the CDA market with reservation prices was created by Gode and Sunder [4]. Their software robots submitted random bids and asks within the limits of their reservation prices, and gained surprisingly high market efficiency measured by total surplus gained. They claimed that “[a]llocative efficiency of a double auction derives largely from its structure, independent of traders’ motivation, intelligence, or learning” (p. 119). Later Cliff and Bruten [1, 2] criticized this approach, and proposed software robots able to learn. They claimed that “[m]ore than zero intelligence [is] needed for continuous double-auction markets” [2]. So far, the literature can be summarized in this way: it is the market institution (e.g. CDA) what makes markets efficient. However, the CDA is a complex institution consisting of many elements. The goal of this paper is to test the hypothesis that the market efficiency depends on the market institutions (it decreases as we depart from the CDA market) and explore how much the individual elements of the CDA contribute to its efficiency.
3
Description of the Model
Our model consists of a rectangular toroid world on which traders (Cliff and Bruten’s software robots) are randomly positioned. The space allows us to define a simple metric of distance between the traders. The traders have a private reservation price, and one unit to trade in each trading day. They trade directly (without intermediation). Each trader has his private haggling price—if he quotes, he quotes this price; if he is asked or bid, he accepts it if the ask or bid price is better or equal to his haggling price. The initial value of the haggling price is the seller’s (buyer’s) reservation price plus (minus) a random margin in percents. The trader is said to be active if he has not yet traded his unit. The market institution is described by four parameters: 1) the vision% parameter (0–100 %) describes how much of the world can each trader see. This describes the market integration. If the vision% is 100 %, each trader can see all other traders, and the market if fully integrated. If the vision% is lower (e.g. 30 %), then each trader can see only a circle area in which center he stands and which covers 30 % of the world— thus he can see in average only 30 % of other traders. Then the total market consists of many overlapping sub-markets. 2) The moving-type parameter (moving / not-moving) describes whether the traders can move; if they can move, the market is integrated in this way too. 3) The public-offers? parameter (true / false) determines whether a trader can ask or bid publicly (i.e. every trader in his vision range can possibly accept it, true value), or privately (i.e. he must select one other agent of the opposite type to trade with, false value). And 4) the public-hearing? parameter (true / false) determines whether all traders within the vision range of the asking or bidding trader can hear whether the proposal was accepted, and at what price (true value). Thus this parameter determines whether the trader can learn from the experience of the whole market (true value), or from his own experience only (false value). These parameters allow us to mix many types of markets. For instance,the CDA means vision% = 100 %, public-offers? = public-hearing? = true. The Chamberlin’s market means lower vision%, uncertain public-offers? and public-hearing?, and moving-type = moving. Each simulation consists of many trading days. At the beginning of each simulation, traders are created and randomly positioned in the world. They are assigned their reservation price derived from a given supply or demand curve. Their haggling prices and behavioral parameters are assigned their initial values. Other traders’ state variables are reset to zero. At the beginning of each trading day, each trader is given a new quantity to trade (one unit), and traders’ state variables other than quantity to trade, reservation, haggling price, and behavioral parameters are reset to zero. A trading day proceeds like this: 1) if moving-type = moving, all traders move. 2) One active trader is randomly selected. If public-offers? = false, he randomly selects one active trader of the opposite type within his vision-range as his partner; otherwise he tries all active traders within his vision-range. 3) If there is a partner, and their haggling prices allow them to trade, they trade and drop out of the market. The price is recorded. 4) If public-hearing? = true, then the selected trader and all traders within his vision-range update their haggling prices; otherwise only the selected trader and his partner adjust them. The steps 1–4 are repeated unless there is no room for trade or no deal takes place for some time; then the day is over, the market is closed, and reopened for the next trading day. 205
The haggling price adjustment proceeds in two steps (see [1]): 1) the trader determines whether to rise, or lower his haggling price, and 2) he determines how much to change it. We will describe the algorithm for a seller; the buyer’s algorithm is similar. Let us suppose that the seller’s haggling price is pt and the last quotation price was qt . If the last quotation was accepted, then if pt ≤ qt , the seller raises his price because he can ask more; if pt ≥ qt and he is still active, he lowers his price because otherwise he would be undercut by a competitive seller (if he has already sold, he does not change the price since he can hope he would sell at the same price the next trading day). On the other hand, if the last quotation was not accepted, it was an offer, the seller is still active, and pt ≥ qt , then the seller lowers his price because he would not get the deal either. Otherwise, he does not change the price. The new haggling price pt+1 is then determined by equations 1–3: τt+1 = Rt+1 · qt + At+1 , Γt+1 = (1 − γ) · β · (τt+1 − pt ) + γ · Γt , pt+1 = pt + Γt+1 ,
(1) (2) (3)
First, the seller sets his target price τt+1 to “test” the market (the Rt+1 and At+1 are random numbers generated each time; if he is raising the price, they are positive, otherwise they are negative). The Γt+1 is the motion of the haggling price. It has two features: 1) the seller does not want to move to his target price τt+1 at once, but only the proportion β ∈ h0, 1i, and 2) there is inertia in price changes governed by the behavioral parameter γ ∈ h0, 1i. The initial momentum Γ0 = 0. The pt+1 is rounded. If the pt+1 is not allowed by the reservation price, it is reset to its old value pt . The overall market efficiency is measured by Smith’s coefficient α [7]. He defined it in the manner similar to the coefficient of variation as v uP n u (Pi −P ∗ )2 t i=1
α=
n−1
P∗
· 100 %,
(4)
where Pi is the i-th market price within the trading day, P ∗ is the equilibrium price predicted by the competitive market theory, and n is the number of transactions within the trading day. The model was implemented in NetLogo (see [6]), the data was analyzed in MatLab. The interactive web version of the model and its source code are available at http://www.econ.muni.cz/˜qasar/marketmodel/.
4
Results of Simulations
We have simulated the model with 19 buyers and 19 sellers. Their reservation prices were generated from symmetric linear demand and supply curves such that their reservation prices were 5, 10, 15, . . . , 100. There were 10 intra-marginal pairs of traders, the equilibrium price was 55. Traders’ behavioral parameters were randomly generated for each trader; their distributions and distributions of Rt and At in eq. 1 were taken from [1]. We simulated 50 trading days, and ran the simulation ten times for each combination of parameters (vision% being 10 %, 20 %, . . . , 100 %). We explored the market efficiency in two ways. 1) We measured with the α how close the market prices converge to the equilibrium price P ∗ ; for the average eventual levels of the α see tab. 1. This should be Table 1. The average eventual levels of the α. “T” in the first column stands for true, “F” for false. The order of parameters is public-offers?, public-hearing?, and moving-type. Thus “T/T/F” means public-offers? = public-hearing? = true and moving-type = not-moving. The minimal value in the row is typeset in boldface. vision%
10 %
20 %
30 %
40 %
50 %
60 %
70 %
80 %
90 %
100 %
T/T/T T/F/T F/T/T F/F/T T/T/F T/F/F F/T/F F/F/F
4.43 6.57 6.50 7.94 35.19 35.43 37.26 35.45
2.19 2.88 4.28 6.63 24.54 30.06 20.84 29.52
1.24 1.58 3.70 5.27 11.71 20.88 18.37 24.21
0.87 1.15 2.96 5.22 6.42 13.25 10.64 20.29
0.78 1.06 3.47 5.69 5.13 9.84 8.11 13.85
0.88 0.76 2.86 4.89 3.52 7.32 5.69 9.83
0.92 0.67 2.64 4.82 2.16 4.93 4.59 9.63
0.96 0.60 2.60 5.03 1.80 1.88 3.13 6.23
0.94 0.63 2.60 4.70 1.24 1.23 2.95 5.33
1.08 0.55 2.59 5.10 1.01 0.53 2.84 4.97
206
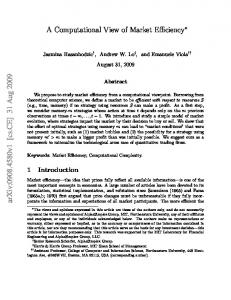
Fig. 1. The left panel shows a typical evolution of prices (red line) and the α (green line) on the CDA market. The trading days are separated with blue lines. The right panel shows the time evolution of the α under various institutions with vision% = 100 %. 100
40
offers offers offers offers offers
35 30 25
60
alpha
price / alpha
80
40
public, hearing publig, moving public, hearing publig, standing private, hearing publig, moving public, hearing private, moving private, hearing private, moving
20 15 10
20
5 0 0
10
20
30 40 trading days
50
60
0 0
10
20 30 trading day
40
50
compared with results of Smith’s experiments 1–7 [7, p. 117] where the eventual α lied between 0.6 % and 9.4 % with median 3.5 % on the CDA markets. 2) We examined the speed of convergence of prices to their stationary values; for this see the right panel of fig. 1. Generally, the integrated markets provided relatively high efficiency, regardless whether they were integrated through traders’ “walking”, or through formal market integration (vision%). However, even when traders could not walk and the vision was limited, the markets were still quite efficient for most combinations of the other institutional elements. We expected that public-offers = false would slow the price convergence down and not affect the eventual α. However, the opposite happened. With public-hearing = false, we expected both a slower convergence and a lower eventual α. The price convergence was indeed slower, but the eventual α was surprisingly lower than on the CDA market. The combination public-offers = public-hearing = false led both to slow convergence and to lower efficiency. Surprisingly, the CDA was not the most efficient market institution: the limited hearing and limited market integration, which both limited the traders’ ability to learn from the experience of the others, improved the eventual α significantly. A probable explanation is that the traders’ ability to learn from each other leads to “bubbles” in prices. This is confirmed by fact, that the CDA prices were much more strongly autocorrelated. The prices in the first trading day were in average below equilibrium (e.g. on the CDA market 76 % of simulations had the average price below equilibrium in the first day), which agrees with the experimental findings [3]. It could be easily explained from the initial setting of the haggling prices: if the margin is given in percents, the intra-marginal sellers (those with the lowest reservation prices) add low margins (e.g. 30 % × $5) while the intra-marginal buyers (those with the highest reservation prices) subtract high margins (e.g. 30 % × $100). Thus the equilibrium given by the haggling-price supply and demand is downward-biased. Moreover, if a transaction takes place below the competitive equilibrium, the next one is likely to be there as well because of the learning.
References 1. Cliff, D.: Minimal-Intelligence Agents for Bargaining Behaviors in Market-Based Environments, HP Laboratories Bristol, 1997. 2. Cliff, D., Bruten, J.: “More than Zero Intelligence Needed for Continuous Double-Auction Trading”, HP Laboratories Bristol, 1997. 3. Chamberlin, E. H.: “An Experimental Imperfect Market”, The Journal of Political Economy, 1948, vol. 56, no. 2, pp. 95–108. 4. Gode, D. K., Sunder, S.: “Allocative Efficiency of Markets with Zero-Intelligence Traders: Market as a Partial Substitute for Individual Rationality”, The Journal of Political Economy, 1993, vol. 101, no. 1, pp. 119–137. 5. Hayek, F. A.: “The Use of Knowledge in Society The Use of Knowledge in Society”, The American Economic Review, 1945, vol. 35, no. 4, pp. 519–530. 6. NetLogo Homepage, http://ccl.northwestern.edu/netlogo/. 7. Smith, V. L.: “An Experimental Study of Competitive Market Behavior”, The Journal of Political Economy, 1962, vol. 70, no. 3, pp. 322–323. 8. Tesfatsion, L.: “Agent-Based Computational Economics: Growing Economies from the Bottom Up”, http://www.econ.iastate.edu/tesfatsi/ace.htm.
207