Jul 28, 2008 - satisfying the predictions of these CPS as well as investi- gations into the ..... 2 ) exhibits a mod- est peak before the first order phase transition point (Ï = â .... region of the IBA, intersecting it almost exactly for NB. = 250. Thus ...
Simple, empirical order parameter for a first order quantum phase transition in atomic nuclei Dennis Bonatsos1 , E.A. McCutchan2 , R.F. Casten2 and R.J. Casperson2 Institute of Nuclear Physics, N.C.S.R. “Demokritos”, GR-15310 Aghia Paraskevi, Attiki, Greece and 2 Wright Nuclear Structure Laboratory, Yale University, New Haven, CT 06520, USA A simple, empirical signature of a first order phase transition in atomic nuclei is presented, the ratio of the energy of the 6+ level of the ground state band to the energy of the first excited 0+ state. This ratio provides an effective order parameter which is not only easy to measure, but also distinguishes between first and second order phase transitions and takes on a special value in the critical region. Data in the Nd-Dy region show these characteristics. In addition, a repeating degeneracy between alternate yrast states and successive excited 0+ states is found to correspond closely to the line of a first order phase transition in the framework of the Interacting Boson Approximation (IBA) model in the large N limit, pointing to a possible underlying symmetry in the critical region.
a) NB = 15
χ = -1.32 χ = 0.00
+
E(61) / E(02)
χ = -0.75
1.5
1.0
st
1 order
+
0.08
ν2
0.06 ,
nd
χ = -0.75
0.02 0.00
2 order
χ = -1.32
0.04
0.5
χ = 0.00 0.2
0.4
ζ
0.6
0.8
0.0
b) N = 100 B
χ = -1.32 χ = -0.75
1.5
+
χ = 0.00
1.0
+
The study of structural evolution in atomic nuclei has witnessed significant developments in recent years. One of the most important has been the discovery of empirical evidence [1, 2] for quantum phase transitions (QPT) in the equilibrium shape as a function of nucleon number. This has led to the proposal [3, 4] and empirical verification [5, 6] of a new class of models, called critical point symmetries (CPS). These, in turn have spurred an abundance of experimental searches [7, 8, 9] for nuclei satisfying the predictions of these CPS as well as investigations into the presence of quasidynamical and partial dynamical symmetries at the critical point [10, 11]. In contrast to the usual thermodynamic phase transitions [12], QPT occur at zero temperature as a parameter in the Hamiltonian is varied [13]. They are attracting much attention in a variety of physical systems, including Josephson-junction arrays and quantum Hall-effect systems [14]. The transition from BardeenCooper-Schrieffer (BCS) pairing correlations [15] to Bose-Einstein condensation (BEC) as a result of increasing the strength of the pairing interaction in ultracold alkali atoms has been recently seen experimentally [16, 17, 18]. In nonrigid polyatomic molecules, a transition from rigidly-linear to rigidly-bent shapes has also been studied [19]. A relationship between QPT and quantum entanglement has also attracted much attention [20, 21]. Central to this active field is the search for simple empirical signatures of QPT and the identification of their order. The properties of QPT in atomic nuclei are therefore of quite broad interest, especially since nuclei are finite-body systems in which the number of constituents can be varied experimentally and theoretically. It is the purpose of this Letter to identify a new, easyto-measure, observable in one such system, atomic nuclei, that acts as an order parameter for QPT in nuclei and which can distinguish first and second order phase transitions. Further, we will show that a particular value of this observable identifies the entire critical region, even for structures not satisfying a specific CPS. Finally we use this value to point to the possible existence of a heretofore undefined new symmetry at the critical point. In the context of an algebraic approach to nuclear
E(61) / E(02)
arXiv:0807.4388v1 [nucl-th] 28 Jul 2008
1
0.5
0.0 0.0
0.2
0.4
ζ
0.6
0.8
1.0
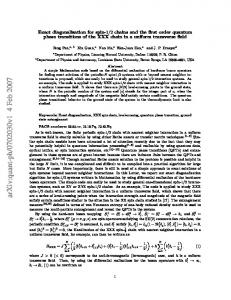
+ FIG. 1: (Color online) The ratio E(6+ 1 )/E(02 ) as a function of ζ for three values of χ for (a) NB = 15 and (b) NB = 100. The inset to (a) shows the corresponding behavior for ν2′ [28].
structure, the concept of phase transitions was developed a number of years ago using the intrinsic state formalism [13, 22, 23] of the Interacting Boson Approximation (IBA) model [24]. This model, constructed in terms of the group U(6), has three dynamical symmetries corresponding to different nuclear shapes: a spherical nucleus that can vibrate [U(5)]; an ellipsoidal deformed axially symmetric rotor [SU(3)], and an axially asymmetric rotor [O(6)]. Nuclei exist which manifest these symmetries but most nuclei deviate from them. Spherical to deformed transition regions in the IBA from U(5) to SU(3) and U(5) to O(6) undergo, in the large boson number
2 (large valence nucleon number) limit, first and second order phase transitions, respectively.
With increased interest in QPT in nuclei, several investigations have sought order parameters to distinguish first and second order phase transitions. Two of these are [28] ν2 , the difference between the expectation values of the number of d-bosons in the IBA, nd , in the first excited 0+ state and the ground state, and ν2′ , proportional to the isomer shift between the first 2+ state and the ground state. Both have sharp changes in phase transitional regions and exhibit a different behavior for first and second order phase transitions (see inset to Fig. 1(a)) for small NB . However, these differences do not persist in the large NB thermodynamic limit [29]. In a more practical vein, Ref. [30] considered the ratio of electromagnetic transi+ + + tion strengths, B4/2 ≡ B(E2;4+ 1 → 21 )/B(E2;21 → 01 ), in the IBA which exhibits a peak prior to the critical region for the U(5)-SU(3) transition, similar to ν2′ . Ref. [31] determined that a difference between U(5)-SU(3) and U(5)-O(6) transitions persists for B4/2 and another B(E2) ratio up to NB = 50. These signatures however, are often difficult to measure, and have substantial uncertainties, particularly far off stability. Moreover, the B4/2 ratio varies only slightly as a function of structure, typically in the range 1.4-1.7 only. The present work presents four key results. We identify an order parameter based on the energies of the first excited 0+ state and the 6+ level of the ground state band. + We show that the ratio E(6+ 1 )/E(02 ) can distinguish between first and second order phase transitions and that this distinction persists in the large NB limit. We also identify, for the first time, a signature of the entire critical region which closely characterizes the line of the first order phase transition in the IBA in the large NB limit, that is a signature which identifies a nucleus as lying near the critical point, regardless of the γ-dependence of the potential. Finally, we also discuss a possible underlying symmetry in the critical region of the IBA. Calculations for this study were performed using the extended consistent Q [32, 33] formalism (ECQF) of the IBA with a Hamiltonian given by [34]
+
+
E(61) / E(02)
Nd Sm Gd Dy
1.5 1.0 0.5 0.0
84
86
88 90 92 94 Neutron Number
96
98
b) +
1.5 1.0
+
The critical points in the IBA characterize the points in shape transitional regions where various observables [25] + such as R4/2 ≡ E(4+ 1 )/E(21 ) or electromagnetic transi+ tion strengths, B(E2; 21 → 0+ 1 ), Q invariants [26], as well as a measure of the wave function entropy [27] vary most rapidly: their first derivatives have an extremum and their second derivative reverses sign.
E(61) / E(02,3)
More recently, critical point transitions have been described in a geometrical framework, in terms of the Bohr Hamiltonian. These new CPS, E(5) [3] and X(5) [4], correspond to second and first order phase transitions between a vibrator and a rotor, differing in the γ degree of freedom. In both cases, an infinite square well potential in the deformation, β, allows for analytic solutions.
2.0 a)
0.5 0.0
Ba Xe 74
76
78
80
Neutron Number + FIG. 2: (Color online)(a) Experimental E(6+ 1 )/E(02 ) ratio as a function of neutron number for the Nd, Sm, Gd, and Dy isotopes. (b) Same for the Xe and Ba isotopes. For smaller neutron numbers, the 0+ 3 state was taken in the ratio if its B(E2) decay was consistent with the σ = N − 2 state. This corresponds to N = 74 in Xe and N = 76,78 in Ba.
� H(ζ, χ) = c (1 − ζ)ˆ nd −
� ζ ˆχ ˆχ Q ·Q , 4NB
(1)
˜ (2) , NB is ˜ Q ˆ χ = (s† d˜ + d† s) + χ(d† d) where n ˆ d = d† · d, the number of valence bosons, and c is a scaling factor. The above Hamiltonian contains two parameters, ζ and χ,√with ζ ranging from 0 to 1, and χ ranging from 0 to − 7/2. In this parameterization, the three dynamical symmetries √ are given by ζ = 0, any χ for U(5), ζ = 1, χ = − 7/2 for SU(3) and ζ = 1.0, χ = 0.0 for O(6). Calculations were performed with the code IBAR [35] which allows boson numbers up to 250. In Fig. 1, the results of calculations for the ratio + E(6+ calcu1 )/E(02 ) are given for NB = 15 and 100. The√ lations include the U(5)-SU(3) transition (χ = − 7/2), the U(5)-O(6) transition (χ = 0.0) and an intermediate χ value. This ratio is 1.5 in the U(5) limit and approaches zero in the large NB limit of SU(3) as the 0+ 2 state rises in energy. For the case of the U(5)-O(6) transition (χ = 0), we present two sets of calculations. For NB = 15, above ζ ∼ 0.6, the dotted line follows the 0+ state belonging to the σ = N -2 family of the O(6) symmetry whereas, the dash-dotted line follows the 0+ belonging to the σ = N family (the actual 0+ 2 level).
3 8+
O(6)
40.0
O(6)
NB = 10
35.0
NB = 40
18+
12+
16+
10+
E(6 ) = E(0 )
SU(3)
U(5)
O(6)
+ 1
+ 2
E(6 ) = E(0 )
SU(3)
O(6) NB = 250
NB = 100
E HMeVL
U(5)
+ 2
25.0
14+
20.0
12+
+
+
E(61 ) = E(02 )
SU(3)
U(5)
O(6)
+
+
E(61 ) = E(02 ) O(6)
NB = 250
U(5)
+
SU(3)
+
E(101 ) = E(03)
SU(3)
NB = 250
U(5)
+
+
E(141) = E(04 )
SU(3)
FIG. 3: (Color online) (Top) Line of degeneracy between the + 0+ 2 and 61 levels (solid red) for NB = 10, 40, 100, and 250 in the IBA triangle. (Bottom) Line of degeneracy between + the 0+ 3 and 101 levels (solid blue) for NB = 250 (left) and + between the 04 and 14+ 1 levels (solid green line) for NB = 250 (right) in the IBA triangle. The dashed lines denote the critical region in the IBA obtained in the large NB limit from the intrinsic state formalism [13, 22, 23].
+ For small NB , Fig. 1(a), E(6+ 1 )/E(02 ) exhibits a modest√peak before the first order phase transition point (χ = − 7/2, solid curve) followed by a sharp decrease across the phase transition. For the second order case, it maximizes at U(5) and gradually decreases with increasing ζ. This behavior is identical to that for ν2′ in Fig. 1(a) [inset]. The intermediate χ value also exhibits a small rise before the phase transition. Thus, as χ approaches the second order case, the unique features of the first order phase transition diminish, but are still present, although they may be difficult to distinguish in finite nuclei. Figure 1(b) illustrates that the above behavior persists and is enhanced in the large NB limit. The features of + E(6+ 1 )/E(02 ) are almost identical to the behavior of the B4/2 ratio discussed in Ref. [30]. The transition region becomes sharper and occurs for a narrower range of ζ values, while the peak prior to the phase transition increases + in magnitude. With increasing NB , the E(6+ 1 )/E(02 ) ratio has values close to the ζ = 0 and ζ = 1 limiting cases for ζ values just outside of the transition region. It is also important to determine if this behavior is ob+ served in nuclei. In Fig. 2 (a), the E(6+ 1 )/E(02 ) ratio for the Nd-Dy isotopes is plotted as a function of neutron number. The Nd, Sm, and Gd isotopic chains are well established as undergoing a transition from spher-
8+ 6+
2+ 4+
0+
2+
+
15.0
10+
10.0
8+
5.0 0.0
U(5)
0+
6+
30.0
+ 1
4+
6+ 4++ 2+ 0
4
0+
2+ 0+
NB = 250, z = 0.4729
FIG. 4: (Color online) Energies of low-lying states (nor+ malized √ to E(21 )=1) of the Hamiltonian of Eq. (1) with χ=− 7/2, ζ=0.4729, and NB =250. The parameter ζ was chosen to reproduce the approximate degeneracy of E(0+ 2 ) and E(6+ 1 ).
ical to deformed shapes, with 150 Nd, 152 Sm, and 154 Gd lying close to the phase transitional point [6, 7, 9] and approximately manifesting X(5). Interestingly, as in Fig. 1, + E(6+ 1 )/E(02 ) peaks just prior to the phase transitional nuclei, followed by a sharp drop occurring for the proposed critical point nuclei. (In 150 Nd, the rise occurs somewhat earlier.) The Dy isotopes behave similarly to the Sm and Gd isotopes, although data on N ≤ 86 is + lacking. Figure 2 (b) shows the E(6+ 1 )/E(02,3 ) ratio for the Xe and Ba isotopes which lie in a γ-soft region between the U(5) and O(6) symmetries that contains only a second order phase transition. Consistent with this, no discontinuity is observed. One key signature of the X(5) critical point symmetry is a near degeneracy of the 6+ 1 level of the ground state band and the first excited 0+ state. Close in+ spection of Fig. 1(b) shows that the E(6+ 1 )/E(02 ) ratio passes through a value of 1.0 close to the phase transition point. This suggests that a degeneracy between E(6+ 1) and E(0+ ) is related to the critical point. We note that 2 this is reflected empirically in Fig. 2, where the N = + 90 nuclei also have E(6+ 1 )/E(02 ) very close to unity. In + Fig. 3(top), the line of E(02 ) = E(6+ 1 ) is given in the IBA triangle for NB = 10, 40, 100, and 250. For each boson number, there is a single trajectory in the triangle which corresponds to this degeneracy condition. With increasing NB , this line quickly approaches the phase transition region of the IBA, intersecting it almost exactly for NB = 250. Thus, it appears that a degeneracy of E(0+ 2 ) and E(6+ 1 ) is a signature of the line of first order phase transitions in the IBA in the large NB limit. Degeneracies are often associated with underlying symmetries. It is therefore of considerable interest that the critical point of the IBA in the large NB limit exhibits + the same degeneracy between E(0+ 2 ) and E(61 ) as approximately given by X(5). To further investigate the presence of underlying symmetries in the phase transition region of the IBA, Fig. 4 √ gives a detailed level scheme from the IBA with χ = − 7/2 and ζ = 0.4729 (which
4 approximately reproduces the degeneracy of E(0+ 2 ) and E(6+ )). This point lies very close to the critical point, 1 ζcrit = 0.4721, obtained in the exact infinite NB limit. Clearly, additional degeneracies are also present. Successive ground band members with J > 2 with J/2 odd, are nearly degenerate with successive excited 0+ states + + + + + [e.g., (6+ 1 , 02 ), (101 , 03 ), (141 , 04 )]. Included in Fig. 3 + (bottom) are lines of degeneracy between the 0+ 3 and 101 + + levels (left) and the 04 and 141 levels (right). They too persist along the entire phase transition region. The continuation of the degeneracies, that appear at the intersection of the critical line and the U(5)-SU(3) leg of the triangle, into the interior of the triangle is reminiscent of the quasi-dynamical symmetries [36, 37] associated with the U(5)-O(6) and U(5)-SU(3) transitions in the IBA, as well as in the vibrator to γ-unstable rotor transition in the Bohr model [38]. If the degeneracies in the interior can indeed be explained by quasi-dynamical symmetries, it would significantly expand the relevance of such ideas. In the present case, of course, the underlying symmetry, exact or approximate, has not yet been identified and needs further investigation. In conclusion, we have identified a simple, empirical + observable, the ratio E(6+ 1 )/E(02 ) of the energies of the + + 61 state and the 02 state which can serve as an order
parameter identifying phase transitional behavior, and whose behavior can distinguish between first and second order phase transitions. Experimental data on the Sm and Gd isotopes, which are well known to exhibit first order phase transitional behavior, exhibit exactly the be+ havior predicted by the IBA for the E(6+ 1 )/E(02 ) ratio. Nuclei in second order transitional regions do not. Beyond its applicability as an effective order parameter, it was also found that a particular value of the ratio, + E(6+ 1 )/E(02 ) = 1.0, provides a signature of the critical region which persists along the line of a first order phase transition cutting across the triangle in the IBA in the large NB limit. The predicted degeneracy of E(6+ 1 ) and E(0+ ) in the IBA critical region for large N is consisB 2 tent with the X(5) critical point symmetry. Finally, the possibility of an underlying quasi-dynamical symmetry, reflected in a recurring pattern of degeneracies, in the critical region of the IBA was discussed. Useful discussions with F. Iachello and N.V. Zamfir are acknowledged. We are grateful to E. Williams and V. Werner for discussions of their work on the IBA model for very large boson numbers, including their role in the development of the code IBAR, which made the present study possible. This work was supported by U.S. DOE Grant No. DE-FG02-91ER-40609.
[1] F. Iachello, N.V. Zamfir, and R.F. Casten, Phys. Rev. Lett. 81, 1191 (1999). [2] R.F. Casten, Dimitri Kusnezov, and N.V. Zamfir, Phys. Rev. Lett. 82, 5000 (1999). [3] F. Iachello, Phys. Rev. Lett. 85, 3580 (2000). [4] F. Iachello, Phys. Rev. Lett. 87, 052502 (2001). [5] R.F. Casten and N.V. Zamfir, Phys. Rev. Lett. 85 3584 (2000). [6] R.F. Casten and N.V. Zamfir, Phys. Rev. Lett. 85 052503 (2001). [7] R. Kr¨ ucken et al., Phys. Rev. Lett. 88, 232501 (2002). [8] P.G. Bizzeti and A.M. Bizzeti-Sona, Phys. Rev. C 66, 031301(R) (2002). [9] D. Tonev et al., Phys. Rev. C. 69, 034334 (2004). [10] D.J. Rowe, Phys. Rev. Lett. 93, 122502 (2004). [11] A. Leviatan, Phys. Rev. Lett. 98, 242502 (2007). [12] L.D. Landau and E.M. Lifshitz, Statistical Physics (Butterworth-Heinemann, Oxford, England, 1951). [13] D.H. Feng, R. Gilmore, and S.R. Deans, Phys. Rev. C 23, 1254 (1981). [14] S.L. Sondhi, S.M. Girvin, J.P. Carini, and D. Shahar, Rev. Mod. Phys. 69, 315 (1997). [15] J. Bardeen, L.N. Cooper, and J.R. Schrieffer, Phys. Rev. 106, 162 (1957); 108, 1175 (1957). [16] M. Greiner, C.A. Regal, and D.S. Jin, Nature (London) 426, 537 (2003). [17] S. Jochim et al., Science 302, 2101 (2003). [18] M.W. Zwierlein et al., Phys. Rev. Lett. 91, 250401 (2003). [19] F. Iachello, F. P´erez-Bernal, and P.H. Vaccaro, Chem. Phys. Lett. 375, 309 (2003). [20] A. Osterloh et al., Nature 416, 608 (2002). [21] S.J. Gu, S.S. Deng, Y.Q. Li, and H.Q. Lin, Phys. Rev.
Lett. 93, 086402 (2004). [22] J.N. Ginocchio and M.W. Kirson, Phys. Rev. Lett. 44, 1744 (1980). [23] A.E.L. Dieperink, O. Scholten, and F. Iachello, Phys. Rev. Lett. 44, 1747 (1980). [24] F. Iachello and A. Arima, The Interacting Boson Model (Cambridge University, Cambridge, England, 1987). [25] Feng Pan, J.P. Draayer, and Yanan Luo, Phys. Lett. B 576, 297 (2003). [26] V. Werner, P. von Brentano, R.F. Casten, and J. Jolie, Phys. Lett. B 527, 55 (2002). [27] P. Cejnar and J. Jolie, Phys. Rev. E 58, 387 (1998). [28] F. Iachello and N.V. Zamfir, Phys. Rev. Lett. 92, 212501 (2004). [29] Feng Pan, Yu Zhang, and J.P. Draayer, J. Phys. G: Nucl. Part. Phys. 31, 1039 (2005). [30] D.J. Rowe, P.S. Turner, and G. Rosensteel, Phys. Rev. Lett. 93, 232502 (2004). [31] Yu Zhang, Zhan-feng Hou, and Yu-xin Liu, Phys. Rev. C 76, 011305(R) (2007). [32] D.D. Warner and R.F. Casten, Phys. Rev. Lett. 48, 1385 (1985). [33] P.O. Lipas, P. Toivonen, and D.D. Warner, Phys. Lett. B 155, 295 (1985). [34] V. Werner et al., Phys. Rev. C 61, 021301(R) (2000). [35] R.J. Casperson, IBAR code (unpublished). [36] D.J. Rowe, Nucl. Phys. A 745, 47 (2004). [37] G. Rosensteel and D.J. Rowe, Nucl. Phys. A 759, 92 (2005). [38] P.S. Turner and D.J. Rowe, Nucl. Phys. A 756, 333 (2005).