Utah State University
DigitalCommons@USU CEE Faculty Publications
Civil and Environmental Engineering
1-2-2012
Simple Optimization Method to Determine Best Management Practices to Reduce Phosphorus Loading in Echo Reservoir, Utah Omar Alminagorta Utah State University
Bereket Tesfatsion Utah State University
David E. Rosenberg Utah State University
Bethany T. Neilson Utah State University
Follow this and additional works at: http://digitalcommons.usu.edu/cee_facpub Part of the Civil and Environmental Engineering Commons Recommended Citation Alminagorta*, O., B. Tesfatsion*, D. Rosenberg, B.T. Neilson. 2012. "Simple Optimization Method to Determine Best Management Practices to Reduce Phosphorus Loading in Echo Reservoir, Utah." Journal of Water Resources Planning and Management, doi:10.1061/(ASCE)WR.1943-5452.0000224. (IF = 1.164)
This Article is brought to you for free and open access by the Civil and Environmental Engineering at DigitalCommons@USU. It has been accepted for inclusion in CEE Faculty Publications by an authorized administrator of DigitalCommons@USU. For more information, please contact
[email protected].
1
Simple Optimization Method to Determine Best Management Practices to
2
Reduce Phosphorus Loading in Echo Reservoir, Utah
3
Omar Alminagorta1, Bereket Tesfatsion2, David E. Rosenberg3, Bethany Neilson4
4
Abstract: This study develops and applies a simple linear optimization program to
5
identify cost effective Best Management Practices (BMPs) to reduce phosphorus loading
6
to Echo Reservoir, Utah. The optimization program tests the feasibility of proposed Total
7
Maximum Daily Load (TMDL) allocations based on potential BMP options and provides
8
information regarding the spatial redistribution of loads among sub-watersheds. The
9
current version of the TMDL for Echo reservoir allocates phosphorus loads to existing
10
non-point phosphorus sources in different sub-watersheds to meet a specified total load.
11
Optimization results show that it is feasible to implement BMPs for non-point sources in
12
each sub-watershed to meet reduction targets at a cost of $1.0 million. However, relaxing
13
these targets can achieve the overall target at lower cost. The optimization program and
14
results provide a simple tool to test the feasibility of proposed TMDL allocations based
15
on potential BMP options and can also recommend spatial redistributions of loads among
16
sub-watersheds to lower costs.
1
Graduate Research Assistant, Department of Civil and Environmental Engineering, Utah State University ,4110 Old Main, Logan, UT 84322-4110.
[email protected] 2 Graduate Research Assistant, Department of Civil and Environmental Engineering, Utah State University, 4110 Old Main, Logan, UT 84322-4110.
[email protected] 3 Assistant Professor, Department of Civil and Environmental Engineering, Utah State University, 4110 Old Main, Logan, UT 84322-4110.
[email protected] 4 Assistant Professor, Department of Civil and Environmental Engineering, Utah State University, 4110 Old Main, Logan, UT 84322-4110.
[email protected]
17
Keywords: Phosphorus; Total Maximum Daily Load; Best Management Practice; Optimization
18
Introduction
19
Many U.S. water bodies are impaired due to excessive nutrients. Excess nutrients such as
20
phosphorus and nitrogen stimulate algae growth, reduce dissolved oxygen, and negatively impact
21
aquatic habitat and water supplies for downstream urban and agricultural users. The Total
22
Maximum Daily Load (TMDL) program provides a mechanism to improve the water quality of
23
impaired water bodies and meet the associated in-stream water quality standards and designated
24
uses. Typically TMDLs provide information regarding the current pollutant loads to an impaired
25
water body and then present a plan to reduce and reallocate loads among pollutant sources to
26
meet the in-stream water quality standard. TMDLs often require the use of best management
27
practices (BMPs) to reduce contaminant loads from non-point sources such as farms, range land,
28
and animal feeding operations. In these instances, identifying, selecting, and locating BMPs is a
29
concern (Maringanti et al. 2009).
30
To address this issue, researchers have applied optimization techniques to select BMPs and
31
determine load allocation strategies at the farm and field scale. These techniques include a
32
multiobjective genetic algorithm (GA) and a watershed simulation model to select and place
33
BMPs (Maringanti et al. 2009), a GA to search the combination of BMPs that minimized cost to
34
meet pollution reduction requirements (Veith et al. 2004), and an optimization model based on
35
discrete differential dynamic programming to locate BMPs in a watershed considering economic
36
analysis (Hsieh et al. 2007). While useful, the approaches require complex solution techniques,
37
long computation times, and have seen limited use by decision makers and regulators. Here, we
38
present a simple linear optimization tool to identify cost-effective BMPs to implement at the sub-
39
watershed scale that meet the allocation required by a TMDL. We also test allocation feasibility
40
and show how to spatially reallocate loads among sub-watersheds to improve feasibility and
41
lower costs.
42
phosphorus at Echo Reservoir in Utah, U.S. Here, we consider the non-point sources and load-
43
reduction strategies identified by the pending TMDL for Echo Reservoir; however our tool is
44
general and can accommodate other point- and non-point sources and remediation strategies.
45
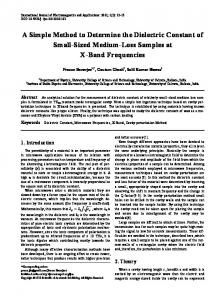
Study Area and Pending TMDL
46
Echo Reservoir is located on the Weber River in northeastern Utah (Figure 1). There are two
47
upstream reservoirs, Wanship and Smith & Morehouse, and three main sub-watersheds that drain
48
to Echo: Weber River above Wanship, Weber River below Wanship, and Chalk Creek. In
49
response to sustained dissolved oxygen concentrations below 4 mg/L and phosphorus
50
concentrations above the state standard of 0.025 mg/L in Echo Reservoir, the Utah Department
51
of Environmental Quality (UDEQ), Division of Water Quality has submitted a TMDL for Echo
52
Reservoir (Adams and Whitehead, 2006; hereafter, the “pending TMDL”). The pending TMDL
53
identifies several major non-point sources of phosphorus (Table 1). Additional phosphorus
54
sources to the reservoir were identified as internal reservoir loading and several point sources.
55
According to the pending TMDL, the target load reduction for the three primary non-point
56
sources (Land Applied Manure, Private Land Grazing and Diffuse Runoff) is 8,067 kg per year.
57
Here, loads refer to total sub-watershed loads delivered to the sub-watershed outlet rather than
58
loads delivered to the receiving water body of concern (i.e., Echo Reservoir). The load reduction
59
is calculated based on a permissible load of 19,800 kg phosphorus per year at the inlet to the
60
Echo Reservoir to restore or maintain its beneficial use. This permissible load was identified
The utility of this tool is presented in the context of a pending TMDL for
61
through a modeling effort (hereafter referred to as the instream water quality model) that
62
simulates the major physical, chemical, and biological processes affecting total phosphorus and
63
dissolved oxygen concentrations within the stream and reservoir (Adams and Whitehead, 2006).
64
After determining the permissible load, UDEQ sought public involvement and investigated
65
existing plans in the study area to implement Best Available Technologies (BATs) and BMPs
66
(for point and non-point sources, respectively). Using available BATs and BMPs, they allocated
67
phosphorus loads among sources and between the three sub-watersheds. Interestingly, the
68
pending TMDL allows point sources to maintain their current discharges (many have already
69
implemented BATs) and focuses phosphorus reduction efforts only on non-point sources. While
70
the pending TMDL prescribes the total load allocations for non-point sources at the sub-
71
watershed level, it does not present a specific plan to achieve these load reductions nor does it
72
consider the feasibility to meet required reductions.
73
Simple Optimization Tool
74
We developed a simple optimization tool that identifies the cost minimizing mix of BMPs to
75
implement within sub-watersheds to achieve required phosphorus load reduction targets for non-
76
point phosphorus sources in a watershed. Two scenarios were analyzed: first, include reduction
77
targets for each non-point source in each sub-watershed as specified in the TMDL. Second, we
78
relax and combine the sub-watershed reduction targets to generate global, watershed-wide
79
reduction targets for sources across all sub-watersheds. Both scenarios can be formulated as a
80
linear program as follows:
81
1. Identify phosphorus sources and reduction targets by sub-watershed,
82
2. Identify potential BMPs for each source, characterize BMP unit cost and reduction
83
efficiency, and determine the available land area or reach length to implement BMPs in
84
each sub-watershed, and
85
3. Formulate and implement the linear optimization program.
86
Step 1 was prescribed in the pending TMDL and our analysis considers reduction targets (p; kg
87
P/year) for three non-point phosphorus source types s in three sub-watersheds w as mentioned
88
above.
89
Potential BMPs to reduce phosphorus from non-point sources in the Echo watershed include
90
actions such as (i) retiring land, protecting grazing land, cover cropping, grass filter strips,
91
conservation tillage, managing agricultural nutrients, and switching to sprinkler irrigation. All of
92
these BMPs can be implemented on available land (Table 1). Additionally, we consider, (ii)
93
fencing and bank stabilization that can be implemented along river and stream reaches (Table 1).
94
Horsburgh et al. (2009) present estimates for unit phosphorus removal costs of each BMP i (ui;
95
$/kg P) and efficiencies (ei ; kg P/km2 or kg P/km) applied in the nearby Bear River basin. We
96
use these estimates in this study to demonstrate the simple optimization analysis.
97
BMP effectiveness to reduce phosphorus also depends on the resources available to implement
98
BMPs in a particular sub-watershed w (bgw; km2 or km). Here, g indicates available land area or
99
stream bank length. For example, to reduce phosphorus loading from private land grazing in the
100
Chalk Creek sub-watershed, we need to identify the area of this specific land use available within
101
the sub-watershed. Similarly, to reduce phosphorus loading from these same land uses by
102
fencing streams, the length of stream that can be fenced must be identified. For this case study,
103
land use areas were taken from the pending TMDL and stream lengths were estimated from
104
widely available stream reach coverage.
105
With known phosphorus load reduction targets, BMP costs, effectiveness, and available land
106
area or stream length for implementation, we can formulate and implement the linear
107
optimization program. The program determines phosphorus mass removed (Piws; kg P/year) and
108
implementation levels (Biws; km2 or km) for each BMP in each sub-watershed for each source to
109
minimize costs and achieve the phosphorus load reduction target. Mathematically, the objective
110
function minimizes the sums of removal costs for all BMPs i in all sub-watersheds w and for all
111
sources s,
min∑(ui × Piws )
(1)
iws
112 113
and is subject to: •
114
Definition of phosphorus mass removed by each BMP i in each sub-watershed w and at each phosphorus source s,
Piws = ei × Biws ;∀ i, s, w 115
•
116
(2)
Phosphorus removal must meet or exceed load reduction targets for each source s in each sub-watershed w,
∑(c
is
× Piws ) ≥p ws ;∀w, s
(3)
i
117 118
•
BMP implementation is limited by available land area or stream length g in each subwatershed w as well as other BMPs already implemented,
∑∑ (c
is
s
119
•
120
)
xgi Biws ≤bgw ;∀g, w
(4)
i
Phosphorus removal must not exceed the existing load (lws; kg) in each sub-watershed w and for each source s, and
∑(c
is
× Piws ) ≤ lws ;∀w, s
(5)
i
121
•
Non-negative decision variables
Piws ≥0;∀ i, w, s ; Biws ≥0;∀ i, w, s
(6)
122
In Equations (3-5), cis is a matrix whose elements take the binary value 1 if BMP i can be applied
123
to source s and 0 otherwise. Each column of c has at least one non-zero element because at least
124
one BMP can be implemented for each source. xgi is also a matrix whose elements take the
125
binary value 1 if implementing BMP i precludes implementing another BMP on the same land
126
parcel or stream reach segment g, and 0 otherwise. Each row g also has at least one non-zero
127
element corresponding to one or more BMPs. Note, BMPs are applied on either an area or stream
128
length basis. Corresponding implementation levels and removal units must be used in Equations
129
(2) and (4).
130
As presented in the pending TMDL, phosphorus reduction targets in Equation (3) are source and
131
sub-watershed specific. However, these sub-watershed specific reduction targets can be relaxed
132
and combined to give global reduction targets across the entire watershed for each source
133
(Equation 7).
∑∑(c
is
i
w
× Piws ) ≥∑p ws ;∀s w
(7)
134
These global targets allow reductions and re-allocations among sub-watersheds and assume
135
phosphorus loadings from each sub-watershed strictly and linearly add to produce the total load
136
to the receiving body, Echo Reservoir. This assumption is appropriate since the TMDL sub-
137
watershed targets were determined by linearly decomposing the target load for the reservoir
138
(Adams, pers. comm., 2010).
139
Equations (1) through (6) represent the sub-watershed specific load reduction scenario 1, dictated
140
by the pending TMDL whereas Equations (1), (2), and (4 – 7) represent scenario 2, a more
141
relaxed scenario, where reductions can be shifted across sub-watersheds. Equations for both
142
scenarios can be solved using either the Excel add-in Solver or other linear program software
143
packages.
144
Results and Discussion
145
The optimization program results for the first scenario suggest that BMPs for private land
146
grazing, diffuse runoff, and land applied manure phosphorus sources can feasibly reduce
147
phosphorus loads in Chalk Creek, Weber River below, and Weber River above Wanship sub-
148
watersheds to targets prescribed by the pending TMDL (Table 2, Scenario 1). These reductions
149
are achieved by implementing protecting grazing land, stabilizing stream banks, and managing
150
agricultural nutrients BMPs in all sub-watersheds and conservation tillage in Chalk Creek. When
151
considering reduction targets specific for each sub-watershed, the available BMPs can achieve
152
the overall reduction target at a cost of $1.0 million. Sensitivity range-of-basis results indicate all
153
BMP cost and removal efficiency parameters (except conservation tillage in Chalk Creek) can
154
increase by factors of 1.7 and more before changing the optimal mix of BMPs (results not shown
155
for brevity).
156
There may be cases where there is insufficient land area or stream length to implement BMPs in
157
a specific sub-watershed. Or, it may be more cost effective to implement BMPs in other
158
locations. When considering these instances, we can relax sub-watershed specific reduction
159
targets, and instead specify an overall reduction target for the entire watershed. For the Echo
160
Reservoir watershed, we can feasibly achieve the watershed-wide reduction target at a lower cost
161
(Table 2, Scenario 2) by curtailing more expensive conservation tillage and increasing the less
162
expensive BMP to manage agricultural nutrients in the Weber Basin below Wanship.
163
Additionally, the program shifts protecting grazing land, stream bank stabilization, and some
164
managing agricultural nutrients to the Chalk Creek and Weber below Wanship sub-watersheds.
165
However these later shifts do not affect the overall implementation costs since the model
166
assumes BMP costs are the same across sub-watersheds. These changes are all possible because
167
there is additional land area and stream length available to implement BMPs in the Chalk Creek
168
and Weber Basin below Wanship sub-watersheds beyond those needed to meet sub-watershed
169
reduction targets prescribed by the pending TMDL. Since this reallocation of loads only provides
170
information regarding the total watershed loads to Echo Reservoir rather than delivered loads,
171
the second scenario requires further use of the instream water quality model to verify that the
172
reservoir standard is still met. In the case of Echo Reservoir, specifying overall source reduction
173
targets for the entire watershed may allow managers to shift BMP implementation among sub-
174
watersheds to meet the overall reduction target for Echo Reservoir at a lower cost.
175
Beyond verifying that shifting loads across sub-watersheds still meets the reservoir standard, we
176
note that these results rely on available linear estimates of BMP unit costs and effectiveness.
177
These linear estimates mean that the model assumes the load at a sub-watershed outlet scales
178
linearly irrespective of where the BMP will be located in the sub-watershed. While this
179
assumption is likely appropriate when a BMP is implemented over all the available land or
180
stream bank resource in a sub-watershed, there are cases where locating a BMP near a stream
181
and/or the sub-watershed outlet can significantly affect load reductions. In this case, we assume
182
that each site contributes a variable load reduction that, on average, reflects the modeled unit
183
effectiveness value. However, when model results suggest available land or stream-bank
184
resources go unused, managers and regulators must apply their local expert knowledge to select
185
farm, field, or stream bank sites where BMP implementation will most effectively reduce the
186
load at the sub-watershed outlet.
187
We further note that implementing a watershed BMP program may allow for some economies of
188
scales. These economies are readily included in the optimization tool with integer decisions and
189
filling constraints. However, economies-of-scale data are not currently available and sensitivity
190
analyses on the cost and efficiency parameters suggest this level of detail may not be needed.
191
Obviously, the model outputs and results are as good as the input data describing BMP costs,
192
efficiencies, existing loads, reduction targets, and available land and stream bank lengths to
193
implement BMPs; gathering additional information within the Echo Reservoir watershed can
194
increase accuracy and confidence in the optimization results.
195
Conclusion
196
We developed a simple linear optimization tool that identifies cost-effective strategies to reduce
197
phosphorus loads from sources to prescribed targets. We applied this tool to Echo Reservoir on
198
Weber River, Utah and showed that BMPs for non-point private land grazing, diffuse runoff, and
199
land applied manure sources can feasibly reduce phosphorus loads to sub-watershed target levels
200
identified within the pending TMDL. Relaxing the sub-watershed reduction targets suggests a
201
global reduction target for the reservoir, which can be reached at lower cost. This global strategy
202
still requires further verification using more detailed instream water quality modeling. This
203
optimization tool offers a simple way to test the implementation feasibility of a proposed TMDL
204
allocation, and suggest how loads can be spatially redistributed among sub-watersheds to lower
205
phosphorus loads and reduce costs.
206
Acknowledgments
207
We thank Carl Adams and Kari Lundeen from the Utah Division of Water Quality for the
208
information they provided, comments, and feedback.
209
Notation
210
The following symbols are used in this technical note:
211
bgw
=
resources available to implement BMPs in a particular sub-watershed w.
212
Biws
=
implementation levels for each BMP i in each sub-watershed w for each source s.
213 214
cis
=
215 216 217
xgi
=
218
ei
=
estimate for unit phosphorus removal efficiencies for each BMP i
219
g
=
row on the model to select available resource (parcel area or reach length).
220
i
=
best management practice.
221
lws
=
existing phosphorus load in sub-watershed w from source s.
222
pws
=
phosphorus reduction targets for sub-watersheds w and non-point source s.
223 224
Piws
=
phosphorus mass removed by each BMP i in each sub-watershed w targeted at each phosphorus source s.
225
s
=
non-point phosphorus source.
226
ui
=
estimate for unit phosphorus removal costs for each BMP i
227
w
=
sub-watershed
a binary parameter that takes the value 1 if BMP i can be applied to source s and 0 otherwise. a binary parameter that takes the value 1 if implementing BMP i precludes implementing another BMP on the same land parcel or stream reach segment g, and 0 otherwise.
228
References
229 230 231 232 233 234 235 236 237 238 239 240 241 242 243 244 245 246 247 248
Adams, C. and Whitehead, J. (2006). “Echo Reservoir TMDL Water Quality Study.” Utah Department of Environmental Quality – Division of Water Quality, Salt Lake City, Utah. http://www.waterquality.utah.gov/TMDL/Echo_Reservoir_TMDL.pdf. Horsburgh, J. S., Mesner N. O., Stevens D. K., Caplan A., Glover T., Neilson B. T. (2009). "USEPA Targeted Watersheds Grant Bear River Basin." Final Project Report. Project # WS97807301. Utah State University. Logan, UT. Hsieh, C. and W. Yang (2007). "Optimal nonpoint source pollution control strategies for a reservoir watershed in Taiwan." Journal of environmental management 85(4): 908-917. Maringanti, C., I. Chaubey and J. Popp (2009). “Development of a multiobjective optimization tool for the selection and placement of best management practices for nonpoint source pollution control.” Water Resour. Res, 45, 1-15. Stevens, D. K., T. B. Hardy, M. Miner, S. Peterson, R. Bird, K. Eggleston, S. Noyes, and L. Fluharty. (2006). Weber/Ogden Basin Final Report. Veith, T., M. Wolfe and C. Heatwole (2004). “Cost-effective BMP placement: Optimization versus targeting.” Transactions of the ASAE, 47(5), 1585-1594.
249 250
Table 1. Assignment of applicable BMPs to non-point sources Source Direct run off from AFOs Land applied manure Public land grazing Private land grazing Septic Systems Diffuse Runoff
Description Animal wastes containing phosphorus from watershed animal feeding operations (AFOs) directly runoff into nearby water bodies. Animal waste applied on agricultural land as a fertilizer is incorporated into the soil and subsequently washed into a nearby water body. Animals grazed on public lands leave waste containing phosphorus that is subsequently washed into a nearby water body. Animals grazed on private lands leave waste containing phosphorus that is subsequently washed into a nearby water body. Domestic leak wastewater into nearby waterways when septic tanks are installed incorrectly or are too close to a waterway. Phosphorus loading that arises from fertilizers, pesticides, trails, roads, dispersed camping sites and erosion from up slopes areas.
Applicable BMPs None
Grass filter strips, Conservation tillage, Manage agricultural nutrients. Protect grazing land, Fence streams, Grass filter strips. Protect grazing land, Fence streams, Grass filter strips. None
Retire land, Stabilize stream banks, Cover crops, Grass filter strips, Conservation tillage, Manage agricultural nutrients, Sprinkler irrigation.
251 252 253
Table 2. Summary of required phosphorus load reductions, model-recommended BMPs, load reductions achieved, and costs.
Scen.
Required reduction (kg/yr) 2,038
Protect grazing landb (kg/yr) 354
Stabilize stream banksc (kg/yr) 915
1,458
155
WAW
4,572
Total
8,067
Subwatersheda Chalk creek WBW
Manage Ag. Nutrientsd (kg/yr) 682
Total reduction (kg/yr) 2,038
Total cost ($1000) 242
549
754
1,458
172
372
1,352
2,848
4,572
587
880
2,816
4,283
8,067
1,000
880
2,816
682
4,379
367
942
942
158
2,747
2,747
460
4,370
8,067
985
Conservation tillaged (kg/yr) 87
1
Chalk creek WBW 2
87
WAW Total
8,067
880
2,816
254
a
255
b
BMP to reduce phosphorus loading from private land grazing source.
256
c
BMP to reduce phosphorus loading from diffuse runoff source.
257
d
BMP to reduce phosphorus loading from land applied manure source.
WBW= Weber below Wanship, WAW= Weber above Wanship.