of sugar isomers and provide sensitive detection, although derivatization can ... aqueous mobile phases with volatile additives, which are ideal for nebulizer-.
Simple Separation and Detection Techniques for the Analysis of Carbohydrates Michael G. Hvizd,1 Bruce Bailey, 2 Christopher Crafts, 2 Marc Plante, 2 and Ian Acworth2 1 Thermo Fisher Scientific, Bannockburn, IL, USA; 2Thermo Fisher Scientific, Chelmsford, MA, USA
Abstract
Carbohydrates are difficult to analyze because they are very polar compounds, exhibit similar structural characteristics, and do not have a suitable chromophore. Their analysis is often performed directly using high-performance anion-exchange chromatography with pulsed amperometric detection (HPAE-PAD) with a high pH mobile phase. This technique has been approved for use in a variety of official methods for the analysis of carbohydrates in foods. Another common technique is to derivatize the sample with a suitable fluorescent tag and use HPLC with fluorescence detection for the analysis. This approach can assist with the separation of sugar isomers and provide sensitive detection, although derivatization can contribute to increased assay variability. HPLC column technology for the separation of carbohydrates has advanced during the past several years. New hydrophilic interaction liquid chromatography (HILIC) mode separations are providing a unique way to separate polar carbohydrates using simple organic/water mobile phases. This chromatographic approach not only provides suitable separation, but also enables the use of sensitive nebulizer-based detectors (i.e., mass spectrometry [MS] or charged aerosol detection). The work presented here describes the use of the Thermo Scientific Dionex Corona™ Charged Aerosol Detector (CAD™) for the measurement of simple carbohydrates. The method has a limit of detection of 40 min N-Linked glycans were released by standard procedures using recombinant N-glycanase or endoglycosidase H. O-Glycans were chemically released either by traditional reductive β-elimination (RBE),4 or by nonreductive ammonia/ammonium carbonate (NAC).5
Sample Prep.:
mple carbohydrates.
UHPLC Method Conditions Column:
BEH HILIC, 2.1 × 50 mm, 1.7 µm
Mobile Phase:
Acetonitrile/5 mM ammonium formate, pH 3, (91:9)
Flow Rate:
1.8 mL/min
Column Temp.:
40 °C
Injection Volume:
2 µL
Detector:
Corona ultra™; nitrogen 35 psi; filter medium
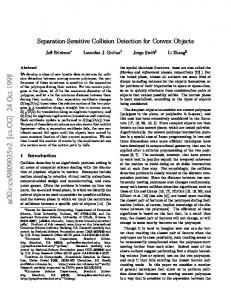
Results and Discussion Analysis of Carbohydrates in Fruit Juices The analysis of fruit juice samples was performed using a polymeric amino column in HILIC mode. This column provided adequate separation while offering good stability and low column bleed characteristics compared to silica-based support materials, which was important for good sensitivity using charged aerosol detection. Improved selectivity and speed of separation of the various carbohydrate species present in these samples were achieved by decreasing water content and elevating the column temperature. Figure 2 illustrates the separation of fructose, glucose, sucrose, lactose, and maltose in less than 10 min. The limit of detection (LOD) for carbohydrate analysis using charged aerosol detection is approximately 5 ng on column (1 µg/mL using a 5 µL injection), thereby providing much better sensitivity than RI or ELSD detection.
Analysis of Carbohydrates Found i
This work also describes use of the Corona C number of sugars typically found in honey. Th sugar abundance in different varieties of hone detection of analytes that only possess weak
Thermo Scientific Poster Note • LPN2954-01_e 11/11SV 3
r is a universal detector capable of measuring is mass sensitive and can be added to HPLC or ctor provides the most consistent response for all olatile analytes of all nebulizer-based HPLC detection orks by charging particles and is not dependent on light ariability and generally lower sensitivity.
FIGURE 2. Calibration standards for fruit juice carbohydrate analysis (25–1000 ng on column).
FIGURE 4. Comparison of carbohydrates
d to illustrate the separation of various carbohydrates ng HILIC. Direct and reproducible detection was CAD. Glycoprotein analysis was conducted using a C) with combined charged aerosol and MS detection.
y and Sample Preparation
hod Conditions
Asahipak® NH2P-50 4E, 250 × 4.6 mm, 5 µm
etonitrile, 22% water
min
HILIC chromatography with the Corona CAD of different corn syrups e.g., 43/43 carbon-re are often used in the production of table syru excellent sensitivity (components typically 40 min d glycans were released by standard procedures combinant N-glycanase or endoglycosidase H. ans were chemically released either ional reductive β-elimination (RBE),4 or by uctive ammonia/ammonium carbonate (NAC).5
Figure 6 shows another example of the use measurement of oligosaccharides. The meth (Figure 6), and a dynamic range that covers factors for the various oligosaccharides are detection, because the slopes of these calib (data not shown).
tions
LIC, 2.1 × 50 mm, 1.7 µm
rile/5 mM ammonium formate, pH 3, (91:9)
min
FIGURE 6. Analysis of oligosaccharide st
ultra™; nitrogen 35 psi; filter medium
cussion
rates in Fruit Juices
mples was performed using a polymeric amino column provided adequate separation while offering good d characteristics compared to silica-based support ant for good sensitivity using charged aerosol detection. ed of separation of the various carbohydrate species re achieved by decreasing water content and elevating ure 2 illustrates the separation of fructose, glucose, e in less than 10 min. The limit of detection (LOD) for charged aerosol detection is approximately 5 ng on L injection), thereby providing much better sensitivity
Analysis of Carbohydrates Found in Food Products This work also describes use of the Corona CAD detector for measurement of a number of sugars typically found in honey. The method can be used to determine sugar abundance in different varieties of honey (Figure 4). This is an example of detection of analytes that only possess weak chromophores.
4 Simple Separation and Detection Techniques for the Analysis of Carbohydrates
dards for fruit juice carbohydrate analysis
s fruit juice samples for analysis using this technique of juice sample was weighed and diluted in a solution HILIC mobile phase conditions. After centrifugation, transferred to an autosampler vial for direct analysis wn in Figure 3. Trace levels of several unknown peaks
FIGURE 4. Comparison of carbohydrates found in different honey products.
Profiling and Characterization of N Released from Glycoproteins
The analysis of the carbohydrate structures increasingly important for many pharmaceut peptide-based biological therapeutics are be glycans, released from bovine fetuin and oth RP-HPLC with charged aerosol detection, an online MS (Figure 7). This approach provide release, cleanup, routine profiling, and online universal detector, the glycans do not require as is currently practiced in the biopharmaceu sample preparation and eliminate artifactual labeling chemistry.
FIGURE 7. Fetuin: reductive β-elimination PGC (Hypercarb) column. HILIC chromatography with the Corona CAD was also used for the measurement of different corn syrups e.g., 43/43 carbon-refined syrup (Figure 5). These products are often used in the production of table syrups, jams, and jellies. The method has excellent sensitivity (components typically