2010 DoD High Performance Computing Modernization Program Users Group Conference
Simplifying Memory, I/O, and Communication Performance Assessment Using TAU Sameer Shende, Allen D. Malony, Alan Morris ParaTools, Inc., Eugene, OR {sameer, malony, amorris}@paratools.com
Andrew Wissink US Army Aeroflightdynamics Directorate, Ames Research Center (ARMDEC), Moffett Field, CA
[email protected]
We introduce a tool that simplifies the performance assessment of input/output (I/O), memory, and Message Passing Interface (MPI) operations in a program under Linux. It describes how TAU improves the accuracy of measuring the extent of heap memory usage, and captures the volume and bandwidth of POSIX I/O performed in an un-instrumented program simply by modifying the command line for launching the parallel application. We describe the application of this tool to the Helios Rotorcraft Simulation Framework.
performance without requiring recompilation of components. Helios uses different components implemented with different languages, all orchestrated by a high-level Python script. To ensure efficient scalability and execution performance when Helios runs on hundreds to thousands of processors, a high-level comprehensive analysis of the I/O, memory usage and communication performance of the coupled components is required. The work reported in this paper demonstrates how TAU can simplify the performance instrumentation tasks, while returning a high-value assessment of critical performance features.
1. Introduction
2. Design
The TAU Performance System® is an integrated suite of tools for instrumentation, measurement, and analysis of parallel programs with particular focus on large-scale, high performance computing (HPC) platforms. It provides a flexible, robust, portable, and scalable set of technologies for performance evaluation on HPC systems. Because TAU is based on probe-based measurement, extending the instrumentation and measurement capabilities for accessing additional sources of performance information is important. This paper describes the design and implementation of a new tool, tau_exec, intended to simplify the performance evaluation tasks for tracking POSIX input/output (I/O), memory, and communication operations. The goal is to allow TAU to spawn un-instrumented dynamic executables and perform measurements during execution using run-time interception and interposition of system calls under Linux. For applications such as Helios, a high-fidelity multidisciplinary software framework for rotorcraft analysis1, tau_exec makes it possible to easily and flexibly assess
The TAU framework architecture, shown in Figure 1, consists of three layers: instrumentation, measurement, and analysis. Each layer uses multiple modules that can be configured in a flexible manner under user control. This design makes it possible for TAU to easily provide alternative instrumentation techniques that target a common measurement API. The role of the instrumentation layer is to insert code (a.k.a. probes) to make performance events visible to the measurement layer. Performance events can be defined, and instrumentation inserted in a program at several levels of the program transformation process. A complete performance view may require contribution of event information across code levels. To support this, TAU’s instrumentation mechanisms are based on the code type and transformation level: source (manual, pre-processor), object (compiler-based instrumentation), library interposition, binary/dynamic, interpreter, virtual machine, and operating system (kernel-level instrumentation).
Abstract
1 Helios is being developed by the HPC Institute for Advanced Rotorcraft Modeling and Simulation (HI-ARMS)[1,2] as part of the CREATE Air Vehicles (CREATE-AV) program.
978-0-7695-4392-5/10 $26.00 © 2010 IEEE DOI 10.1109/HPCMP-UGC.2010.29
508
standard C++ library or the FORTRAN runtime library in the application. These operations internally call the POSIX I/O and the system-level memory allocation/deallocation calls. Our first goal for designing tau_exec was to simplify tracking of POSIX I/O, memory, and communication operations. All the issues above are effectively addressed by pre-loading a wrapper interposition library that intercepts calls made by all the layers of the un-instrumented application. For tracking the time spent in Message Passing Interface (MPI) routines, we integrate TAU’s MPI wrapper interposition library[3] with the shared objects that are pre-loaded. The second goal was to provide greater accuracy of heap memory usage and detect memory leaks automatically. To evaluate the heap memory usage, tools typically rely on the Linux mallinfo system call. This call internally uses 32-bit counters that roll over and generate inaccurate results for applications that use over 4GB of memory. To improve the accuracy of the heap memory usage, we created wrapper libraries for malloc and free and used 64-bit counters that keep track of the heap memory utilization. This information is available to all layers of TAU that require this information. Any tool performs I/O and memory operations itself. To accurately report the statistics from the application, TAU was modified to not update the I/O and memory counters, and thus compensate for any effects caused by the instrumentation. This improves the accuracy of the recorded data. The accuracy of these measurements was validated using standard benchmarks such as IOR[16] and b_eff_io[17] and TAU’s simple validation tests. The third goal of the tau_exec design was to improve the resolution and mapping of performance data for an instrumented executable. When an application is instrumented, we can observe the time spent in loops and instrumented routines. To improve the resolution of tracking I/O and memory operations within the context of an instrumented application, more work is required because we need to resolve the I/O instrumentation with the pre-existing TAU instrumentation in the application. We do this by identifying the presence of TAU’s instrumentation and integrating streams of POSIX I/O instrumentation calls to form a common performance data source. If the user creates an instrumented executable by linking in TAU’s dynamic shared object (DSO) (a.k.a. dynamically-linked library or DLL), the pre-loaded wrapper interposition library easily blends in with the TAU’s dynamic shared object. However, when the application uses TAU’s static library, the process is complicated by the fact that the wrapper DSO internally links with TAU’s DSO. Two streams of performance data can potentially be created and can overlap. To avoid this, TAU was modified to export the symbols from the static library during linking to create an executable that interfaces correctly with the wrapper interposition library
Figure 1. TAU framework architecture – instrumentation and measurement
For POSIX I/O and memory allocation and deallocation operations, we can apply a library interposition approach that uses the Linux library pre-loading mechanism for injecting and instantiating a wrapper interposition library in the address space of the executing application. When a dynamic shared-object is preloaded, each routine in the wrapper library internally searches for the corresponding call from the given library, and calls it with the appropriate arguments. Instrumentation calls are inserted in the body of the wrapper library to measure the exclusive and inclusive duration of the routine, as well as trigger key events that characterize the performance of the application, as determined by the arguments passed to the given routine. In this manner, wrapper interposition libraries capture all invocations of a given routine and require no recompilation of the application source code or re-linking. The Linux run-time linker resolves all symbols during execution, and performance data streams from one or more instrumentation sources flow into a common performance data repository in the context of the executing application.
3. Issues Previously, TAU provided support for tracking POSIX I/O and memory operations by re-directing calls to the I/O library with equivalent calls in a wrapper interposition library using a pre-processor. However, this approach only worked for C and C++ codes that directly called these routines, and it required re-compiling the source code. Also, memory and I/O calls that took place in un-instrumented libraries that were linked in to the application were not counted, providing only partial coverage. This includes stream-based I/O and new and delete-based memory operations performed using the 509
that is introduced prior to execution in each context of the executing binary image. This scheme provides wider coverage for the tool, and allows it to operate in cases where the user may desire more extensive performance coverage that includes support for multi-level instrumentation. Capturing the duration of the entire execution requires us to time the entry- and exit-points of the application. To do this, we created a second library that is also pre-loaded in the application. This library intercepts the initialization and finalization events and creates a toplevel timer (.TAU Application) that measures the total execution time spent in each context. To identify each context (process) of an application to a higher-level entity that describes the execution of the parallel application, we used the MPI rank and thread identifiers from TAU’s measurement library. This requires pre-loading TAU’s MPI wrapper interposition library and the pthread wrapper library. Each configuration of TAU creates a unique set of libraries based on the packages configured (e.g., MPI, PAPI, PDT) and the runtime options (e.g., MPI, MPI with OpenMP, MPI with threads, sequential execution) chosen by the user. To provide the maximum flexibility and choice of performance measurement, the tau_exec tool provides a command line option that allows a user to choose a given library by either specifying the package and run-time parameters (-T ) or by specifying the name of the TAU shared library (-XrunTAU ) as shown in Figure 2.
operations using the Linux pre-loading scheme used in tau_exec. Scalasca[11] is a portable and scalable profiling and tracing system that can automate the detection of performance bottlenecks in message-passing and sharedmemory programs. Like many other tools, including VampirTrace, it uses library wrapping for MPI. TAU may be configured to use Scalasca or VampirTrace internally. TAU, VampirTrace, and Scalasca internally use the PAPI[4] library to access hardware performance counters present on most modern processors. However, only the tau_exec scheme provides the level of integration of all sources of performance information—MPI, I/O, and memory—of interest to us, with the rich context provided by TAU. With this support, we can utilize the VampirServer[10] robust parallel trace visualization system to show the performance data through scalable time-line displays of the state of transitions of each process along a global timeline. Profile performance data can also be easily stored in the PerfDMF database[11]. TAU’s profile browser, ParaProf, and its cross-experiment analysis and data-mining tool PerfExplorer,[10] can interface with the performance database to help evaluate the scalability of an application.
5. Performance Evaluation of Helios Using TAU As described in Reference 15, Helios is a code being developed for high-fidelity modeling of rotorcraft aero and structural dynamics. It consists of multiple modules written in different languages—FORTRAN90, C, and C++—that are integrated through a high-level Pythonbased infrastructure. This loosely coupled implementation has the advantage that each module can be developed separately from one another, but as with any parallel code, a single poor-performing module can hinder the performance and scalability of the suite as a whole. Figure 3 shows the architecture of the Helios software integration framework (SIF). Instead of the traditional model where different physics are coupled together within a single code, Helios links together separate physics modules—computational fluid dynamics (CFD), computational structural dynamics (CSD), six degrees-offreedom dynamics (6DOF), and various interface routines—through a high-level Python-based integration framework.
Figure 2. Usage of tau_exec
4. Related Work To better understand the performance characteristics of an application, both profiling and tracing are relevant. While profiling shows summary statistics, tracing can reveal the temporal variation in application performance. Among tools that use the direct measurement approach, the VampirTrace[16] package provides a wrapper interposition library that can capture the traces of I/O 510
Figure 3. Architecture of Helios
The Helios software consists of multiple modules, some legacy, and some new. The CFD modules use a mixed-grid overset solution strategy. Near the body surface, the Reynolds-averaged Navier-Stokes solver NSU3D[6] is applied. The far-field wake is resolved using a high-order block-structured adaptive Cartesian Euler solver SAMARC. SAMARC couples the SAMRAI[7] package from Lawrence Livermore National Laboratory to manage adaptive grid generation, parallel load balancing, and inter-processor, with the high-order ARC3DC[8] Cartesian block solver from NASA Ames. A domain connectivity module manages chimera-style interpolation between the different grid systems. The RCAS software[9] supplies structural loads and sixdegree-of-freedom information to Helios. Further details on the implementation and validation of Helios are in References 1 and 2. To assess the performance of Helios, we execute the single-block test case using tau_exec as shown in Figure 4. We specify the instrumentation of I/O and memory operations, and choose the Python-based bindings with pthreads to match the execution model with the performance evaluation tool library, by setting a set of environment variables. It is important to note that by simply modifying the command line to launch the Helios test case, we can generate performance data using TAU. We create a wrapper script that internally imports the Python script used in the test case. No other modification is made to either pyMPI[14], the Python interpreter, or the shared objects that are loaded by Helios. This example generates profiles that contain I/O, memory, and communication data.
Figure 4. To measure the performance of Helios, it is executed under tau_exec
Figure 5 shows the overall profile of the application. There are four MPI ranks, and each rank has three threads of execution which are identified by their respective nodes (n), contexts (c), and threads (t) (e.g., n,c,t 1,0,2 refers to MPI rank 1, context 0, thread 2). To simplify the performance views, we chose to execute the application on four cores. The main window shows the performance data from each thread on a separate row. By clicking on a given label (n,c,t 0,0,0), we see the details of that rank. Figure 6 shows the time spent in each routine on rank 0, thread 0 corresponding to this node. Here we see that roughly 37.9 % of the total wall-clock time is spent in the POSIX I/O routine write(). It also shows the time spent in other I/O and MPI routines, as well as the time spent in the Python routines instrumented by the Python interpreter. Figure 7 shows the time spent in write() across all threads. Figure 10 shows the three-dimensional (3D) window that highlights the distribution of time across all ranks. TAU generates profiles and traces of the application. The profiles describe the aggregate performance metrics such as the time spent in instrumented routines, and the volume and bandwidth of I/O operations based on the bytes transferred. Aggregate summaries of performance metrics across all invocations of a POSIX I/O routine (such as read or write) provide a good basis for performance investigation, although it is important to note that these routines often operate on a variety of different entities (such as files, sockets, pipes). Aggregating volume and bandwidth can often obfuscate the performance associated with a given file. To provide insights into each file, we partitioned the performance space based on file descriptors and mapped these back to the call that was used to create the file descriptors. POSIX I/O also comes in two flavors: buffered and un-buffered. While un-buffered POSIX I/O calls (open, creat, read, write) are associated with integer file descriptors, buffered calls (fopen, fwrite, fprintf) are typically associated with file streams. We mapped the file streams to their underlying file descriptors to create a common file identifier space. This space includes pipes 511
and sockets as well. The file descriptors themselves may be associated with a given file during execution, and when the file is closed, these file descriptors (limited by the total inodes open during the execution), may be reused, and further complicating the mappings between the identifiers and the files they represent. Also, the file descriptors may be duplicated (dup, dup2), or set (fcntl) during execution. Thus, we needed to extend the coverage to control operations on the files as well as miscellaneous calls (mkstep, tmpfile). Also, POSIX supports asynchronous I/O constructs (aio_read, aio_write) that TAU will also instrument.
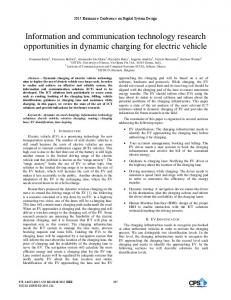
Figure 7. The time spent in the write() system call is shows across multiple threads of execution
File descriptor management operations form an important part of keeping track of the performance data on a per-file descriptor basis. The creation calls (such as fopen, creat, socket, connect, bind) provide key arguments that reveal the names of files, ports and addresses associated with sockets, AF_UNIX sockets based on files, and pipes. By mapping the file descriptor to its name, we can observe the performance effects (such as the read and write bandwidth) based on file system types (Lustre, NFS-mounted file system, or local scratch partition). We further partitioned this space by tracking the instrumented entities along their calling path, providing details of volume and bandwidth observed along the chain of events that represents the edge in a call graph. We extended TAU’s ParaProf profile browser to visualize the total volume of atomic event data associated with the bytes read or written along the calling path. With these extensions, it shows the nature and extent of I/O operations along a calling tree. The nodes of this tree may be expanded or contracted to progressively zoom into performance space represented by the profile. Figure 6 shows ParaProf’s context event window that highlights the I/O operations on a per-file basis for MPI rank 1. It shows the average write bandwidth (76.08 MB/s) and the bandwidth for each file, as well as the total bytes written for each file in the samarcWriteRestartData routine in Helios. This tool can be potentially used for a variety of purposes for visualizing the complete set of files and sockets used by an application.
Figure 5. The time spent in each MPI rank and thread for each instrumented routine is shown in ParaProf’s main window
Figure 6. TAU’s ParaProf profile browser shows the breakdown of time spent in each routine for MPI rank 0, thread 0
Figure 8. The volume of I/O operations, their type and the I/O bandwidth is recorded for each file along each calling path
512
The total bytes written by the application is shown in Figure 9. Here we see that MPI rank 0, thread 0 performs more I/O than the other threads. By combining the I/O and memory profiles, we can simultaneously observe the heap memory allocated and de-allocated by individual modules in Helios along its calling path. The user may extend this calling sequence by progressively adding more TAU instrumentation in a given application module. By setting an environment variable (TAU_TRACK_MEMORY_LEAKS=1), TAU can also track memory leaks in the code. Figure 11 shows the memory leaks detected by TAU in OpenMPI 1.3 in its MPI_Finalize() routine. It also shows the volume and bandwidth of I/O operations performed on each system file in this module. This can simplify detection of memory leaks in applications with minimal instrumentation and run-time dilation. TAU defines a memory leak as allocated memory that is not freed-up upon termination.
6. Significance to DoD
Figure 9. ParaProf shows the volume of data written by each thread of execution
We have extended TAU to simplify assessment of I/O and memory operations for un-instrumented and instrumented applications. It allows the users to ask questions such as: x What is the heap memory utilization in an application? x Are there memory leaks in the application? x How much memory is allocated, freed and leaked, and where does it occur? x How much time does the application spend in I/O, and communication operations? x How do I/O and communication operations scale with number of cores and problem size? x What is the volume/BW of I/O for each file/socket/pipe for each thread along each calling path? It is now possible to answer these questions under Linux without re-compiling or re-linking the application. It is possible to evaluate the performance of codes that use multiple languages such as Python, FORTRAN, C, and C++. Computational scientists can easily assess memory, I/O and communication performance. This capability is aligned with the Department of Defense (DoD) High Performance Computing Modernization Program’s (HPCMP’s) goal “to provide high- performance computing environments and software applications that enable critical DoD research, development and test problems to be solved.” The software developed in this project is released in the BSD-style licensed TAU Performance System® that is installed on all User Productivity, Enhancement, Technology Transfer and
Figure 10. ParaProf’s 3D browser shows the time spent in all routines across all ranks
Figure 11. ParaProf shows a memory leak in the OpenMPI 1.3 MPI_Finalize() routine as well as I/O data on a per-file basis
513
Training (PETTT)-supported $PET_HOME directory.
systems
in
5. Knupfer, A., R. Brendel, H. Brunst, H. Mix, and W. Nagel, “Introducing the Open Trace Format (OTF).” Proc. ICCS 2006, LNCS 3992, Springer, 2006. 6. Mavriplis, D.J., “Results from the Third Drag Prediction Workshop using the NSU3D Unstructured Mesh Solver.” AIAA2007-0256, 45th AIAA Aerosciences Conference, Reno, NV, Jan. 2007. 7. Hornung, R.D., A.M. Wissink, and S.R. Kohn, “Managing Complex Data and Geometry in Parallel Structured AMR Applications.” Engineering with Computers, Vol. 22, No. 3–4, pp. 181–195, Dec. 2006 (see http://www.llnl.gov/casc/samrai). 8. Pulliam, T.H., “Euler and Thin-Layer Navier-Stokes Codes: ARC2D and ARC3D.” Computational Fluid Dynamics Users Workshop, University of Tennessee Space Institute, Tullahoma, TN, Mar. 1984. 9. RCAS Theory Manual, Version 2.0, United States Army Aviation and Missile Command, AeroFlightDynamics Directorate (USAAMCOM/AFDD), Technical Report 02-A-005, US Army Aviation and Missile Command, Moffett Field, CA, Jun. 2002. 10. Huck, K. and A. Malony, “PerfExplorer: A Performance Data-Mining Framework for Large-Scale Parallel Computing.” Proc. ACM/IEEE Conference on Supercomputing (SC’05), 2005. 11. Huck, K., A. Malony, R. Bell, L. Li, and A. Morris, “PerfDMF: Design and Implementation of a Parallel Performance Data Management Framework.” Proc. ICPP 2005, IEEE Computer Society, 2005. 12. Knupfer, A., H. Brunst, and W. Nagel, “High-Performance Event Trace Visualization.” Proc. PDP 2005, IEEE, 2005. http://www.vampir.eu. 13. Geimer, M., F. Wolf, B. Wylie, and B. Mohr, “Scalable Parallel Trace-Based Performance Analysis.” Proc. EuroPVM/MPI 2006, LNCS 4192, Springer, pp. 303–312, 2006, http://www.scalasca.org. 14. SourceForge, pyMPI: Putting the py in MPI, http://pympi.sourceforge.net, 2008. 15. Wissink, A. and S. Shende, “Performance Evaluation of the Multi-Language Helios Rotorcraft Simulation Software.” Proc. DoD HPCMP UGC 2007 Conference, 2007. 16. IOR HPC Benchmark, http://sourceforge.net/projects/ior-sio, 2010. 17. Effective Bandwidth (beff) Benchmark, https://fs.hlrs.de/ projects/ par/mpi//b_eff/b_eff_3.2, 2010.
the
7. Conclusions The complexity of the applications and high-end computer systems on which they run demand a high level of sophistication in the performance evaluation tools to observe them. In this paper, we describe how we have successfully created and demonstrated a new tool to easily assess the POSIX I/O, memory, and communication performance of an un-instrumented application using TAU. We intend to apply these new capabilities to assess the performance of key DoD codes.
Acknowledgements This work was supported by the DoD HPCMP PETTT program (PP-ACE-KY01-002-P3) and through support provided by the DoD HPCMP to the HI-ARMS Institute.
References 1. Wissink, A.M., J. Sitaraman, V. Sankaran, T. Pulliam, and D. Mavriplis, “A Multi-Code Python-Based Infrastructure for Overset CFD with Adaptive Cartesian Grids.” AIAA-2008-0927, 46th AIAA Aerosciences Conference, Reno, NV, Jan. 2008. 2. Sitaraman, J., A. Katz, B. Jayaraman, A. Wissink, and V. Sankaran, “Evaluation of a Multi-Solver Paradigm for CFD using Unstructured and Structured Adaptive Cartesian Grids.” AIAA-2008-0660, 46th AIAA Aerosciences Conference, Reno, NV, Jan. 2008. 3. Shende, S. and A.D. Malony, “The TAU Parallel Performance System.” Int’l Journal of High Performance Computing Applications, SAGE Publishers, 20(2), pp. 287–311, Summer 2006, http://tau.uoregon.edu. 4. Browne, S., J. Dongarra, N. Garner, G. Ho, and P. Mucci, “A Portable Programming Interface for Performance Evaluation on Modern Processors.” Int’l Journal of High Performance Computing Applications, 14(3), pp. 189–204, 2000, http://icl.cs.utk.edu/papi/.
514