Simulating DNA Coding Sequence Evolution with EvolveAGene 3 Barry G. Hall Bellingham Research Institute, Bellingham, WA Phylogenetic reconstruction based upon multiple alignments of molecular sequences is important to most branches of modern biology and is central to molecular evolution. Understanding the historical relationships among macromolecules depends upon computer programs that implement a variety of analytical methods. Because it is impossible to know those historical relationships with certainty, assessment of the accuracy of methods and the programs that implement them requires the use of programs that realistically simulate the evolution of DNA sequences. EvolveAGene 3 is a realistic coding sequence simulation program that separates mutation from selection and allows the user to set selection conditions, including variable regions of selection intensity within the sequence and variation in intensity of selection over branches. Variation includes base substitutions, insertions, and deletions. To the best of my knowledge, it is the only program available that simulates the evolution of intact coding sequences. Output includes the true tree and true alignments of the resulting coding sequence and corresponding protein sequences. A log file reports the frequencies of each kind of base substitution, the ratio of transition to transversion substitutions, the ratio of indel to base substitution mutations, and the numbers of silent and amino acid replacement mutations. The realism of the data sets has been assessed by comparing the dN/dS ratio, the ratio of transition to transversion substitutions, and the ratio of indel to base substitution mutations of the simulated data sets with those parameters of real data sets from the ‘‘gold standard’’ BaliBase collection of structural alignments. Results show that the data sets produced by EvolveAGene 3 are very similar to real data sets, and EvolveAGene 3 is therefore a realistic simulation program that can be used to evaluate a variety of programs and methods in molecular evolution.
Introduction A variety of methods exist for the purpose of reconstructing evolutionary histories from molecular sequence data; and for each method, a variety of computer programs exist to implement that method. Those methods are designed to reconstruct phylogenetic trees, ancestral sequences of common ancestors at the inner nodes of those trees, and to tease out aspects of adaptive evolution—both positive and purifying selection—along the branches of those trees. All those methods depend upon data in the form of multiple alignments of the molecular sequences, and a variety of programs exist to estimate those multiple alignments. The problems of multiple alignment and phylogenetic reconstruction are very intertwined; phylogenetic reconstruction depends on correct multiple alignments, and multiple alignment reconstruction depends upon correct phylogenetic reconstruction. There are several sets of proteins that have been aligned on the basis of tertiary structures of the proteins. Those protein alignments (Raghava et al. 2003; Edgar 2004; Thompson et al. 2005) and their corresponding DNA coding sequence alignments (Carroll et al. 2007), although they are not ‘‘true’’ alignments, now serve as gold standards for assessing the accuracies of multiple sequence alignments. There is little in the way of known ‘‘true’’ phylogenies or multiple alignments that can be used to measure and compare the accuracies of phylogenetic methods and programs. There are a few experimental evolution studies that provide known phylogenies (Hillis et al. 1992), but the small scale of the data sets, 9 taxa in the study by Hillis et al. (1992), limits their usefulness as test beds forcomparingmethodsandprograms.Intheabsenceofknown phylogenies, ancestral sequences, etc., simulations must be used to test the accuracies of the methods and programs. Simulation programs generate true trees that can be compared with estimated trees and can generate true alignKey words: simulation, coding sequence evolution, indels. E-mail:
[email protected]. Mol. Biol. Evol. 25(4):688–695. 2008 doi:10.1093/molbev/msn008 Advance Access publication January 12, 2008 Ó The Author 2008. Published by Oxford University Press on behalf of the Society for Molecular Biology and Evolution. All rights reserved. For permissions, please e-mail:
[email protected]
ments that can be compared with estimated alignments. The value of simulated data sets is directly proportional to their biological realism. Unfortunately, most simulation programs are not very realistic. Genes evolve by nucleotide substitutions, insertions, and deletions. Most programs, such as the popular Seq-Gen (Rambaut and Grassly 1997) and Evolver (Yang 1997), do not include insertions and deletions that result in gaps in alignments. When simulated data do not include insertions and deletions, there is no need to align the sequences, eliminating an important step that contributes significantly to topological errors in phylogenetic trees. Obviously, such programs cannot be used to evaluate the effectiveness of multiple alignment methods. ROSE (Stoye et al. 1998), MySSP (Rosenberg 2005), and DAWG (Cartwright 2005) are exceptions, but none of these programs are capable of simulating the evolution of coding sequences. ROSE simulates the evolution of protein sequences but not of the coding sequences that underlie those protein sequences. ROSE and MySSP simulate the evolution of DNA sequences, but because indel lengths are unconstrained, the resulting DNA sequences are replete with terminations, and translation of the simulated sequences produces protein fragments rather than realistic proteins. DAWG can constrain indel lengths to multiples of 3, but because it was not designed with coding sequences in mind (Cartwright RA, personal communication), DAWG does not restrict the appearance of internal termination codons. As a result, DAWG also generates DNA sequences that translate to protein fragments. ROSE, MySSP, and DAWG all employ mathematical models of nucleotide substitution (HKY, GTR, etc.) to simulate the process of sequence evolution. Because the evolutionary models are predefined, the methods and models that return the best trees, those most similar to the true tree, are the methods and models that best match the assumptions of the models used in the simulations. In reality, sequence evolution is a 2-step process in which spontaneous mutations occur and are then fixed into populations by selection and drift. Mutations occur as the results of replication and DNA repair errors, and the relative proportions of the
Simulating DNA Coding Sequence Evolution 689
various kinds of mutations are called the ‘‘mutation spectrum.’’ Among those mutations that are base substitutions, there are different proportions of each kind of substitution, for example, AT to TA, AT to CG, etc. Within insertions and deletions, there are different proportions of the various lengths. Selection acts on those mutations and greatly changes the proportions of the various mutations that are fixed into populations and thus appear in DNA sequences; that is, the observed proportion of transitions relative to transversions is usually very different from their proportions in the mutational spectrum (Li 1997; Hall 2005). EvolveAGene 3 is a sequence evolution simulation programthatcloselymimicsrealevolutionbyseparatingmutation from selection; by including insertions, deletions, and base substitutions based upon a known mutational spectrum; and by allowing the user to realistically specify the way selection operatesonthose mutations.Inaddition, EvolveAGeneallows the user to specify that some region of a gene will be strongly conserved or that a region will be subject to positive (diversifying) selection. Similarly, the program can simulate differing adaptive constraints during the history of the sequences by allowing the user to specify that some branches will be subject to more intense purifying selection or to positive selection. The quality and value of a sequence evolution simulation should be measured by the realism of the data sets that it generates: How similar are the simulated data sets to real data sets? Simulated data sets should closely resemble real data sets in terms of indel distribution and in terms of nucleotide substitution patterns. Here, I compare data sets simulated by EvolveAGene with real data sets in the BaliBase collection of structure-based alignments. Methods Sequence Evolution Was Simulated by EvolveAGene 3 as Described below Real data sets were taken from the BaliBase collection of structure-based alignments. Those alignments are available in 2 versions: 1) alignments of the complete sequences and 2) alignments of the homologous portions of the sequences. The homologous portion versions were used in this study. Phylogenetic trees of the real data sets were estimated by the maximum likelihood (ML) method by Phyml-aLRT (http://atgc.lirmm.fr/alrt/) (Anisimova and Gascuel 2006) using a GTR þ InvGamma model. The dN/dS ratio (ratio of replacement mutations per replacement site to silent mutations per silent site) and kappa, the ratio of transition to transversion substitutions, were estimated by codeml, which is part of the PAML 4.0 (Yang 2007) package. Lambda, the ratio of indel mutations to base substitution mutations, was estimated by the program lambda.pl that is part of the DAWG package (Cartwright 2005). Results EvolveAGene Overview Earlier versions of EvolveAGene have been used to compare the accuracies of phylogenetic methods (Hall
2005) and to assess the accuracy of a new ancestral sequence reconstruction approach (Hall 2006). EvolveAGene 3 considerably expands the potential uses of EvolveAGene by reporting, in addition to the True tree, the True alignment, True dN/dS ratio, True ratio of indels to base substitutions, True ratio of transition to transversion substitutions, and proportions of each of the 6 possible base substitutions (AT 5 GC, AT 5 TA, etc). In addition, by allowing selection intensity and direction to vary both over branches and over the sequences, EvolveAGene 3 can be used to assess the accuracy with which various methods detect adaptive evolution. EvolveAGene 3 is written in Perl and can now be used either interactively or by the command line. Mac OS X, Windows executables, and Perl source code plus a detailed manual are available from http:// homepage.mac.com/barryghall/Software.html. The user specifies the number of taxa (sequences) to be evolved. To create the true tree, EvolveAGene takes a userspecified topology and then assigns to each branch a random branch length that is between zero and twice the userdefined mean branch length. The topology must be strictly bifurcating, which is biologically realistic because we believe that speciation is a bifurcating process even though we may sometimes be unable to resolve the branching order. Because zero-length branches are permitted, functional trifurcations do occur, although they are rare. The topology may be balanced or random; random in the sense that each branch has an equal probability of leading to an external (terminal or leaf) node or to an internal node. Alternatively, the topology may be supplied as an input tree, allowing the user to specify any desired topology; for example, a topology identical to that of a phylogeny based on a real data set. Once the tree is determined, EvolveAGene starts with a user-specified sequence, usually an actual coding sequence and moves outward from that root sequence along each branch for the required number of steps. At each step, a random site in the sequence is chosen, and EvolveAGene proposes a mutation according to the spontaneous mutational spectrum of Escherichia coli, which is better understood than that of any other organism (Glickman et al. 1986; Hall 1999). The probabilities of proposing each kind of mutation are discussed in Hall (2005). The selection portion of the simulation consists of determining whether the proposed mutation will be accepted. If the mutation is an insertion or deletion (an indel), it is rejected if the proposed indel length is not a multiple of 3 because, in reality, such frameshift mutations almost always result in loss of function and are not fixed into populations. Nonframeshift indels are accepted with probabilities that are specified by the user. The user can thus generate a data set that is as ‘‘gappy’’ as is desired. If the mutation is a silent mutation (a base substitution that does not result in an amino acid replacement), it is accepted with a probability that is set by the user, usually 1.0. If a base substitution mutation results in a termination codon, it is rejected because nonsense mutations almost universally result in loss of function. Otherwise, it is accepted with a probability that is specified by the user. The user specifies the probability of accepting a replacement relative to the probability of accepting a silent mutation. The
690 Hall
user-specified value turns out to be very close to the resulting dN/dS ratio of the data set (see tables 2 and 3). The user can thus specify a realistic probability of accepting replacements based on actual dN/dS ratios from the literature. By default, EvolveAGene assumes that amino acid replacement mutations are subject to a constant level of selection across the entire gene. In reality, we know that some regions of a gene can be highly conserved, for example, near an active site of an enzyme, whereas others can be quite tolerant of amino acid substitutions. Likewise, by default, EvolveAGene assumes that selection on amino acid replacements is constant over all the branches, that is, over time. In reality, we know that there can be periods when a gene is subject to more intense negative (purifying) selection than at other times, and there can be times when it is subject to positive (diversifying) selection that favors amino acid replacements. The user can override those simplifying assumptions by choosing variable selection. If variable selection is chosen, the user specifies the magnitude of either positive selection or more intense purifying selection, and a random 10% segment of the gene is subjected to that selection. Similarly, the user may specify that selection conditions are constant over branches or that they vary. If they vary, a random 10% of the branches will be subjected to either positive or more intense purifying selection in a manner similar to that described above. Proposed amino acid replacement mutations are thus accepted or rejected according to the probability that is set and, if variable selection is chosen, according to whether the mutation is on a branch or in a region that is subject to variable selection. If a mutation is rejected, the process begins again by proposing a new mutation at a new site. When the required number of mutations has been accepted, according to the length of that branch, the resulting sequence is recorded either as an internal node or as an external (leaf) node. As indels are accepted, all the sequences are updated so that the program maintains the true alignment of all sequences. The input is a text file that contains a simple coding sequence. Ten output files are written. These include 1) a log file that records the simulation conditions, details of the mutations along each branch, specific regions and/or branches that have been subjected to positive or more intense purifying selection, and the total number of insertions, deletions, silent and replacement base substitutions, transition/transversion ratio, ratio of indels to base substitutions, and proportions of each kind of base substitution; 2) and 3) true trees, in Newick format, as rooted and unrooted trees with branch lengths and with and without interior node numbers as node labels; 4) and 5) DNA and corresponding protein sequences of the external (leaf) nodes; 6) and 7) DNA and protein sequences of the internal nodes; 8) and 9) the true alignments of the external and internal DNA node sequences; and 10) the true alignment of the external node protein sequences. The user may choose to have alignment in Fasta, PHYLIP (relaxed), or Nexus formats. True trees can be compared with estimated trees to evaluate phylogenetic methods and models, and true alignments can be compared with estimated alignments to evaluate alignment
programs. Sequences of internal nodes are useful for evaluating ancestral sequence reconstruction programs. Properties of Real Data Sets from the BaliBase Collection The BaliBase set of tertiary structure–based alignments (Thompson et al. 1999; Bahr et al. 2001; Thompson et al. 2005) has served as a ‘‘gold standard’’ for evaluating the performance of multiple sequence alignment programs in several studies (Thompson et al. 1999, 2005; Lassmann and Sonnhammer 2002, 2005; Carroll et al. 2007; Landan and Graur 2007). Because the alignments are based on protein structures, homologous amino acids are defined on the basis of the position occupied in the structure, and these alignments are considered to be as accurate as is currently possible. Recently, the coding sequences corresponding to those alignments were made available (Carroll et al. 2007), and 107 of those coding sequence alignments derived from BaliBase sets 11, 12, 20, and 30 were surveyed for this study. Phyml-aLRT (Anisimova and Gascuel 2006) was used to estimate ML trees. The number of sequences in those sets ranged from 4 to 142, and the mean branch lengths of the phylogenies ranged from 0.166 to 4.02. The ML trees and corresponding alignments were used by codeml (Yang 2007) to estimate the dN/dS ratios. The dN/dS ratio (ratio of replacement mutations per replacement site to silent mutations per silent site) is a measure of the average selection on a set of sequences as they diverged from a common ancestor. A dN/dS , 1 is evidence for the operation of purifying selection, whereas that .1 is evidence for positive or diversifying selection (discussed extensively in Yang [2006]). Codeml was also used to estimate kappa, the ratio of transition to transversion substitutions, and lambda.pl (Cartwright 2005) was used to estimate lambda, the ratio of indels to base substitutions (fig. 1 and table 1). Kappa, lambda, and the dN/dS ratio are thus the criteria by which these real data sets can be compared with EvolveAGene 3–simulated data sets. Properties of Simulated Data Sets Twenty of the BaliBase data sets were selected as models upon which to base EvolveAGene 3 simulations. Data sets were selected to include those with between 10 and 142 sequences and to roughly represent the range between the 90th percentile and 10th percentile of the dN/dS, kappa, and lambda distributions (table 1). Ten simulations were based on each of the 20 BaliBase models. For each simulation, the tree topology was that of the ML tree based on the BaliBase model data set. Because EvolveAGene requires a rooted tree, the ML tree was arbitrarily rooted on the last sequence in the BaliBase alignment. The input, or root sequence, for the simulation was the first sequence in the alignment (with gaps removed). The probability of accepting a replacement mutation was set to the dN/dS estimated by codeml for the BaliBase model alignment, and the average branch length was set to the average branch length of the ML tree. EvolveAGene reports the true alignment, the true tree, the true kappa (ts/tv ratio), and the true lambda (ratio of
Simulating DNA Coding Sequence Evolution 691
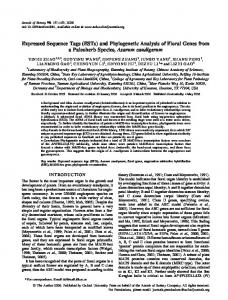
FIG. 1.—Properties of 107 BaliBase alignments. Panel (A), distribution of dN/dS ratios estimated by codeml. Panel (B), distribution of transition/ transversion ratios estimated by codeml. Panel (C), Distribution of indel/base substitution ratios estimated by lambda.pl.
indels to base substitutions). The true dN/dS ratio was calculated from the number of silent and replacement mutations reported by EvolveAGene and the number of silent and replacement sites in the true alignment. To evaluate the accuracy with which codeml and lambda.pl estimate dN/dS, Kappa, and lambda, those parameters were estimated from the true tree and the true alignment from each simulation. Table 2 shows the properties of the replica data sets estimated from a typical BaliBase model, BBS20021. Comparison of the True parameters with the estimated parameters shows that codeml overestimated kappa by 30% and underestimated dN/dS by 4%, whereas lambda.pl overestimated lambda by 47%. The average branch lengths of the simulated trees (0.367) were very close to the set mean branch length (0.369), whereas the average True dN/dS (0.1167) was 0.93 of the set probability of accepting an amino acid replacement mutation (0.1254). Table 3 shows the mean values of those parameters for the 20 sets of simulations, that is, equivalent to the last line in table 2. Comparison of Real and Simulated Data Sets Table 4 compares True values with estimated values and True values with those of the BaliBase model. The av-
erage branch lengths of the simulated trees were very close to those of the model BaliBase trees. The probabilities of accepting an amino acid replacement were set to the dN/dS ratios estimated for the BaliBase model trees. The actual dN/dS ratios turned out to be quite close (0.955) of those probabilities; thus, the user can easily set realistic probabilities of accepting replacement mutations by setting those probabilities to 1.05 times a real dN/dS from the literature. Codeml underestimates dN/dS by 15% and overestimates kappa by 13%, whereas lambda.pl overestimates
Table 1 Distribution of Properties of BaliBase Data Sets
Value Maximum Minimum 90% Median 10% Mean ± standard error Skewness Kurtosis
dN/dS
Kappa (ts/tv)
Lambda (indels/base substitution)
0.3365 0.0048 0.1964 0.0164 0.00738
2.5087 0.3342 1.5484 1.2908 1.1017
0.0206 0.0000 0.0094 0.0050 0.0024
0.0593 ± 0.0075 1.838 2.79
1.2894 ± 0.0260 0.871 5.46
0.0054 ± 0.0003 1.409 4.96
0.0030 ± 0.0001 0.9575 ± 0.0040 0.1121 ± 0.0018 0.367 ± 0.005
1.2416 ± 0.0108
0.0044 ± 0.0002
0.1167 ± 0.0008
— 0.0028 0.0033 0.0032 0.0027 0.0023 0.0032 0.0029 0.0033 0.0032 0.0030 — 0.9592 0.9765 0.9746 0.9454 0.9420 0.9555 0.9496 0.9718 0.9458 0.9547 0.1254 0.1084 0.1062 0.1204 0.1097 0.1130 0.1170 0.1097 0.1222 0.1071 0.1077
BBS20021 Simulation 1 Simulation 2 Simulation 3 Simulation 4 Simulation 5 Simulation 6 Simulation 7 Simulation 8 Simulation 9 Simulation 10 Mean ± standard error (simulations)
0.369 0.359 0.403 0.358 0.372 0.346 0.370 0.372 0.369 0.372 0.348
1.0725 1.2745 1.2713 1.1725 1.2307 1.2659 1.2597 1.2064 1.2754 1.2360 1.2235
0.0022 0.0042 0.0050 0.0047 0.0038 0.0030 0.0049 0.0041 0.0051 0.0048 0.0042
— 0.1195 0.1159 0.1149 0.1144 0.1168 0.1174 0.1186 0.1213 0.1136 0.1149
True Lambda Estimated dN/dS Mean Branch Length
Table 2 Results of Simulation Based on BBS20021 Model (53 sequences)
Estimated Kappa
Estimated Lambda
True dN/dS
True Kappa
692 Hall
lambda by 40%. To compare the True dN/dS, True kappa, and True lambda of the simulated data sets with the real dN/dS, kappa, and lambda estimated for the BaliBase data sets, it is necessary to correct those under- and overestimates. Figure 2 shows the distributions of those corrected estimates for the BaliBase data sets and the True values for the simulated data sets. Although the True values for the simulated data sets are somewhat more narrowly distributed, they closely resemble the values for the real BaliBase data sets. Discussion Because EvolveAGene 3 takes a very nontraditional approach to simulating the evolution of DNA coding sequences, it is appropriate to ask whether the simulated data sets are realistic. Simulated data sets were compared with real data sets on the bases of 3 criteria: dN/dS ratio, the transition/transversion ratio (kappa), and the ratio of indels to base substitutions (lambda). As shown in figure 2, the distributions of values for the simulated data sets are very similar to the distributions for the real data sets. It is, perhaps, a bit disingenuous to attribute much significance to the similarity of the distributions of dN/dS because the dN/dS of the simulations were set to be very close to the dN/dS of the real data sets. The distribution of the transition/transversion ratios (kappa) for the simulated data sets was not directly set. Instead, they are the result of the interplay of the probabilities of the individual base substitutions, that is, the E. coli mutational spectrum and the probabilities of accepting replacement mutations. Thus, the observation that kappas of the simulated data sets are very similar to those of real data sets strongly suggests that the simulated data sets are realistic. Similarly, lambda, the ratio of indels to base substitutions, was not set directly but was determined by the interplay between the probabilities of base substitution and indel mutations and the probabilities of those mutations being accepted. The narrow distribution of kappa for the simulated data sets (fig. 2F) is the result of using the same probabilities of accepting insertions and deletions for all 200 simulations. Again, the observation that kappas of the simulated data sets closely resemble those of the real BaliBase data sets supports the realism of the simulated data sets. The simulated data sets are quite realistic, despite not taking advantage of all the options available in EvolveAGene 3. In particular, selection was constant over all branches and over the entire length of each sequence. Realism might have been increased by allowing variable selection intensity. It would be desirable to conduct similar studies with other simulation programs to determine whether programs based on mathematical models of nucleotide substitution patterns are any more or less realistic than EvolveAGene, but I am not aware of any such programs that are capable of simulating the evolution of coding sequences. Most modelbased programs, such as Seq-Gen, do not simulate the occurrence of indels, and those that do so do not simulate the evolution of intact coding sequences. The EvolveAGene 3 simulation, like all other simulations, is an oversimplification of reality. For instance, the selective effect of all amino acid substitutions is assumed
Simulating DNA Coding Sequence Evolution 693
Table 3 Mean Results of Simulation Sets Based on 20 BaliBase Data Set Models BaliBase Num Seqa
Estc dN/dS
Estc Kappa
Estc Lambda
Mean Br Lenb
Estc dN/dS
Estc Kappa
Estc Lambda
True dN/dS
True Kappa
True Lambda
14 14 10 10 11 11 13 12 18 13 27 74 29 37 53 47 59 142 140 62
0.633 0.607 0.638 0.994 0.609 0.689 0.415 0.618 0.401 0.521 0.348 0.270 0.364 0.381 0.369 0.565 0.296 0.246 0.204 0.321
0.0138 0.0097 0.0127 0.0186 0.0133 0.0115 0.0140 0.0070 0.0080 0.0079 0.1351 0.1512 0.0805 0.0673 0.1254 0.1092 0.2040 0.0731 0.1427 0.0319
1.505 1.394 1.515 1.309 1.363 1.292 1.183 1.183 1.628 1.382 1.255 1.106 1.218 1.405 1.073 1.009 1.051 1.239 1.095 1.360
0.0081 0.0091 0.0076 0.0050 0.0094 0.0086 0.0034 0.0033 0.0044 0.0042 0.0071 0.0016 0.0019 0.0028 0.0022 0.0012 0.0046 0.0043 0.0039 0.0040
0.633 0.640 0.660 1.009 0.637 0.621 0.432 0.638 0.426 0.545 0.347 0.273 0.361 0.360 0.367 0.545 0.294 0.253 0.204 0.311
0.0082 0.0074 0.0092 0.0186 0.0094 0.0112 0.0100 0.0050 0.0062 0.0033 0.1157 0.1204 0.0750 0.0885 0.1121 0.0863 0.1743 0.0578 0.1260 0.0238
1.260 1.153 1.167 1.151 1.162 1.169 1.158 1.034 1.084 1.102 1.241 1.195 1.250 1.271 1.242 1.220 1.216 1.180 1.197 1.192
0.0055 0.0060 0.0051 0.0055 0.0057 0.0070 0.0052 0.0058 0.0054 0.0051 0.0039 0.0044 0.0050 0.0049 0.0044 0.0057 0.0037 0.0063 0.0049 0.0063
0.0135 0.0098 0.0131 0.0184 0.0123 0.0116 0.0141 0.0069 0.0071 0.0070 0.1238 0.1379 0.0779 0.0661 0.1167 0.1005 0.1899 0.0680 0.1333 0.0313
1.163 1.180 1.052 1.071 1.209 1.224 1.124 1.107 1.187 1.164 0.932 0.908 0.993 1.009 0.958 0.966 0.860 1.018 0.917 1.099
0.0043 0.0046 0.0042 0.0042 0.0046 0.0055 0.0044 0.0045 0.0044 0.0042 0.0032 0.0029 0.0038 0.0036 0.0030 0.0032 0.0026 0.0031 0.0028 0.0039
BBS11005 BBS11018 BBS11019 BBS11028 BBS11031 BBS11033 BBS12008 BBS12015 BBS12026 BBS12027 BBS12035 BBS20003 BBS20009 BBS20015 BBS20021 BBS20030 BBS20034 BBS30003 BBS30021 BBS30030 a b c
Simulations
Mean Br Lenb
Num Seq: number of sequences in the alignment. Mean Br Len: mean branch length of the ML tree. Est: estimated by codeml or lambda.pl.
to be equal. In reality, some substitutions, such as an isoleucine for valine substitution, often have much less selective effect than, for instance, a histidine for proline substitution. Likewise, EvolveAGene 3 does not permit designating a specific region of the sequence or specific codons as being highly conserved. In reality, it is specific re-
gions, such as active sites, not randomly selected regions that are highly conserved. EvolveAGene employs the E. coli mutagenic spectrum because it is the best-known mutagenic spectrum. It is not known whether doing so actually improves the reality of the simulation compared with, say, all nucleotide substitutions having equal probabilities.
Table 4 Comparisons of Estimated and True Values in Simulations
BBS11005 BBS11018 BBS11019 BBS11028 BBS11031 BBS11033 BBS12008 BBS12015 BBS12026 BBS12027 BBS12035 BBS20003 BBS20009 BBS20015 BBS20021 BBS20030 BBS20034 BBS30003 BBS30021 BBS30030 Mean Standard error a b c
True Br Lena O BaliBase Br Len
True dN/dS O Prob.b Accepting Replacement Mutation
Est.c dN/dS O True dN/dS
Est. Kappa O True Kappa
Est Lambda O True Lambda
0.9997 1.0543 1.0336 1.0157 1.0460 0.9009 1.0403 1.0326 1.0625 1.0447 0.9982 1.0110 0.9942 0.9457 0.9940 0.9642 0.9934 1.0303 1.0039 0.9705 1.0068 0.0089
0.978 1.007 1.034 0.987 0.923 1.010 1.004 0.979 0.891 0.889 0.916 0.912 0.968 0.982 0.931 0.920 0.931 0.930 0.934 0.980 0.955 0.010
0.608 0.754 0.699 1.013 0.765 0.967 0.711 0.735 0.876 0.464 0.935 0.873 0.962 1.338 0.961 0.859 0.918 0.850 0.945 0.762 0.850 0.040
1.083 0.977 1.109 1.075 0.961 0.955 1.030 0.934 0.913 0.947 1.331 1.316 1.258 1.259 1.297 1.263 1.414 1.159 1.306 1.085 1.134 0.036
1.281 1.312 1.232 1.333 1.226 1.281 1.165 1.289 1.239 1.217 1.228 1.519 1.312 1.372 1.464 1.811 1.400 2.028 1.740 1.633 1.404 0.052
Br Len: mean branch length. Prob: probability of. Est: estimated by codeml of lambda.pl.
694 Hall
FIG. 2.—Comparison of properties of real data sets with simulated data sets. Panels (A), (B), and (C) are corrected estimates for 20 BaliBase data sets used as models for the simulations in panels (D), (E), and (F). Panels (D), (E), and (F) are the True values of those simulations.
Because the source code is distributed, it is easy to modify the program to substitute any other mutagenic spectrum should sufficient information become available. Despite these oversimplifications, EvolveAGene 3 produces realistic data sets and should be a valuable tool for evaluating a variety of computational biology and phylogenetic programs.
Literature Cited Anisimova M, Gascuel O. 2006. Approximate likelihood-ratio test for branches: a fast, accurate, and powerful alternative. Syst Biol. 55:539–552. Bahr A, Thompson JD, Thierry JC, Poch O. 2001. BAliBASE (Benchmark Alignment dataBASE): enhancements for repeats, transmembrane sequences and circular permutations. Nucleic Acids Res. 29:323–326. Carroll H, Beckstead W, O’Connor T, Ebbert M, Clement M, Snell Q, McClellan D. 2007. DNA reference alignment benchmarks based on tertiary structure of encoded proteins. Bioinformatics. 23:2648–2649. Cartwright RA. 2005. DNA assembly with gaps (Dawg): simulating sequence evolution. Bioinformatics. 21(Suppl 3): iii31–iii38. Edgar RC. 2004. MUSCLE: multiple sequence alignment with high accuracy and high throughput. Nucleic Acids Res. 32:1792–1797. Glickman BW, Burns PA, Fix DF. 1986. Mechanisms of spontaneous mutagenesis: clues from altered mutational
specificity in DNA repair-defective strains. In: Shankel DM, Hartman PE, Kada T, Hollender A, editors. Antimutagenesis and anticarcinogenesis mechanisms. New York: Plenum Press. p. 259–281. Hall BG. 1999. The spectra of spontaneous growth-dependent and adaptive mutations in ebgR. J Bacteriol. 181:1149–1155. Hall BG. 2005. Comparison of the accuracies of several phylogenetic methods using protein and DNA sequences. Mol Biol Evol. 22:792–802. Hall BG. 2006. Simple and accurate estimation of ancestral protein sequences. Proc Natl Acad Sci USA. 103:5431–5436. Hillis DM, Bull JJ, White ME, Badgett MR, Molineux IJ. 1992. Experimental phylogenetics: generation of a known phylogeny. Science. 255:589–592. Landan G, Graur D. 2007. Heads or tails: a simple reliability check for multiple sequence alignments. Mol Biol Evol. 24:1380–1383. Lassmann T, Sonnhammer EL. 2002. Quality assessment of multiple alignment programs. FEBS Lett. 529:126–130. Lassmann T, Sonnhammer EL. 2005. Automatic assessment of alignment quality. Nucleic Acids Res. 33:7120–7128. Li W-H. 1997. Molecular evolution. Sunderland (MA): Sinauer Assoc. Raghava GP, Searle SM, Audley PC, Barber JD, Barton GJ. 2003. OXBench: a benchmark for evaluation of protein multiple sequence alignment accuracy. BMC Bioinformatics. 4:47. Rambaut A, Grassly NC. 1997. Seq-Gen: an application for the Monte Carlo simulation of DNA sequence evolution along phylogenetic trees. Comput Appl Biosci. 13:235–238.
Simulating DNA Coding Sequence Evolution 695
Rosenberg MS. 2005. MySSP: non-stationary evolutionary sequence simulation, including indels. Evol Bioinform Online. 1:51–52. Stoye J, Evers D, Meyer F. 1998. Rose: generating sequence families. Bioinformatics. 14:157–163. Thompson JD, Koehl P, Ripp R, Poch O. 2005. BAliBASE 3.0: latest developments of the multiple sequence alignment benchmark. Proteins. 61:127–136. Thompson JD, Plewniak F, Poch O. 1999. BAliBASE: a benchmark alignment database for the evaluation of multiple alignment programs. Bioinformatics. 15:87–88.
Yang Z. 1997. PAML: a program package for phylogenetic analysis by maximum likelihood. Comput Appl Biosci. 13:555–556. Yang Z. 2006. Computational molecular evolution. Oxford: Oxford University Press. Yang Z. 2007. PAML 4: phylogenetic analysis by maximum likelihood. Mol Biol Evol. 24:1586–1591.
Sudhir Kumar, Associate Editor Accepted January 5, 2008