Available online at www.sciencedirect.com
ScienceDirect Procedia CIRP 41 (2016) 411 – 416
48th CIRP Conference on MANUFACTURING SYSTEMS - CIRP CMS 2015
Simulation Approach to Enhance Production Scheduling procedures at a Pharmaceutical Company with large Product mix Hazem Kaylania *, Anas M. Atieha a
German Jordanian University, Amman 11180, Jordan
* Corresponding author. Tel.: +962-798-309030; fax: +962-6-4300215. E-mail address:
[email protected]
Abstract One of the most challenging tasks for any industrial firm with a large product mix is the creation of a robust production schedule. In addition, it is not an unusual practice that last minute orders arriving with higher priorities will necessitate modifications to the existing schedule. The validity check of the production schedule is an important step, as it will affect the production plan, the allocation of resources, and may have a direct influence on the cost of subsequent setups. In this article, we introduce a discrete event simulation approach to obtain a reliable and fast scheduling analysis. The proposed methodology will evaluate the credibility of the generated schedule by measuring resources utilization, identifying bottlenecks, throughput, and evaluating the impact of each item in the product mix on these performance measures. The model will then highlight potential changes to the product mix and resources allocation as needed. The purpose of this research is to offer researchers a reliable and flexible approach to evaluate validity of modifications to production schedule. First, a parametric simulation model concept is introduced, and then the simulation results and analysis for a case study are presented. The proposed methodology was successfully applied to three production facilities at a major pharmaceutical company in Jordan. Monthly schedules at these facilities were analysed and the ability to meet production requirements were evaluated. Simulation results highlighted necessary changes to schedule and resources. © 2015 2015 The The Authors. Authors. Published Published by by Elsevier Elsevier B.V. B.V. This is an open access article under the CC BY-NC-ND license © Peer-review under responsibility of the Scientific Committee of 48th CIRP Conference on MANUFACTURING SYSTEMS - CIRP CMS (http://creativecommons.org/licenses/by-nc-nd/4.0/). 2015. Peer-review under responsibility of the scientific committee of 48th CIRP Conference on MANUFACTURING SYSTEMS - CIRP CMS 2015 Keywords: Discrete event Simulation; Production Scheduling; Product mix; Optimization
1. Introduction Due to the increase in global competition and the need to meet customer orders in a timely manner, pharmaceutical companies are forced to enhance their scheduling processes and improve the utilization of resources. Compared to other manufacturing industries, the pharmaceutical industry has unique characteristics; some of these characteristics include: x x x x
Large product mix with variable process times Batching of multiple lots that share common resources Industry standards that necessitate high cleanliness Sterilization requirements vary according to products sequence
This paper considers the planning and scheduling functions at a major pharmaceutical company in Jordan, which has a wide variety of over 180 products produced at their facilities. A monthly schedule is prepared to plan the activities during a one month production period, which covers a product mix of about 30 items. The company utilizes Enterprise Resources Planning (ERP) to identify production requirements; the ERP system is efficient in planning what needs to be produced, but not when to produce it. ERP systems do not perform well when scheduling raw materials and allocating resources, particularly when dealing with a large product mix that share a limited number of resources. Planning engineers will create production schedule and allocate required resources based on static process times and machine cleaning requirements. Different products have different process times on each machine and, additionally, cleaning requirements are sequence dependent. Regular cleaning is needed within certain groups of products; however
2212-8271 © 2015 The Authors. Published by Elsevier B.V. This is an open access article under the CC BY-NC-ND license (http://creativecommons.org/licenses/by-nc-nd/4.0/). Peer-review under responsibility of the scientific committee of 48th CIRP Conference on MANUFACTURING SYSTEMS - CIRP CMS 2015 doi:10.1016/j.procir.2015.12.072
412
Hazem Kaylani and Anas M. Atieh / Procedia CIRP 41 (2016) 411 – 416
deeper cleaning is needed between different groups of products. In addition, it is not an unusual practice that last minute orders arriving with higher priorities will necessitate modifications to the existing schedule. Considering the above unique requirements, creating a production schedule is a challenging task that requires several iterations with no guarantee that a robust schedule is reached, and usually some modifications may be applied to the schedule when the actual production starts. Scheduling can be defined as allocating of shared resources during a planning period to competing products in order to meet production requirements. It has been the subject of a significant amount of literature in the field of operations research [1, 2]. Scheduling problems are considered NP-hard, as there isn't any known algorithm that can find an optimal solution in any reasonable time [3, 4]. All existing algorithms can handle specific types of production systems, but they become less efficient when the size of the system gets larger and uncertainties increase [5]. In addition, the vast majority of the scheduling research does not explicitly consider execution issues such as uncertainty, but implicitly assumes that the global schedule will be executed exactly as it emerges from the algorithm generating it. Expanding the schedule to include more constraints will significantly increase the complexity, and hence, schedule creation and execution will be a very difficult task [6]. Discrete-event simulation analysis becomes necessary because of its capability for studying the complex dynamics of the system and its random behavior [7]. Simulation is defined as "the process of designing a mathematical or logical model of an actual real system and experimenting with the model on a computer to describe, explain, and predict the behavior of the real system" [8]. In this article, we introduce a discrete event simulation approach to obtain a reliable and fast scheduling analysis. The proposed methodology will evaluate the credibility of the generated schedule by measuring resources utilization, identifying bottlenecks, throughput, and evaluating the impact of each item in the product mix on these performance measures. The model will then highlight potential changes to the product mix and resources allocation as needed. 2. Methodology Due to the complexity and time consuming process of creating the monthly production schedules, and to help higher management to evaluate schedule efficiency and assess different alternatives, the validity check of the production schedule is an important step, as it will affect the production plan, the allocation of resources and may have direct influence on the cost of subsequent setups.
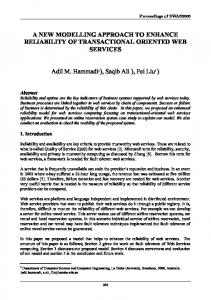
A parameterized simulation model is developed and used to mimic the behaviour of the production facility under any given schedule. The model comprises of two components; the computer simulation model and an external Excel file which will interface with the simulation model and is utilized to read/write data. A case study based on a production facility of a pharmaceutical company in Jordan will be used to demonstrate the methodology. The facility consists of five main departments: Warehouse, Powder department, Tableting department, Coating department, and packaging department. The general flow of products is shown in Figure 1. The sequence inside the facility varies from one product to another; in addition, there are several pieces of equipment in each department. This equipment might have similar functions within the same department but not necessarily the same capacity. Based on machine capacity and production requirements, orders will be divided into suitable batches and a schedule will be created. Furthermore, after processing a batch on any of the machines, certain cleaning must be performed. Cleaning requirements vary based on the types of the current product and the following product according to strict standards used for this industry. A project team had 15 members, consisting of external four researchers and company representatives, including plant GM, mangers of industrial engineering department, production department, and planning department, in addition to production and scheduling personnel. The project was sponsored by the GM. Team responsibilities included: x x x x x x x x
Identifying the Model performance measures (KPI’s) that enable to evaluate the validity and robustness of production Schedule Providing the organizational objectives that need to be realized as project goals Ensuring project scope is aligned with the organizational objectives and approve change to project scope Demonstrating senior level commitment through active and visible participation Committing the required resources to the project Resolving escalated issues Empowering the core project team to make decisions Monitoring the progress and the organizational impacts of the project
The project was carried for a time span of nine months during which data were collected, analysed, and validated. A simulation model was successfully created and implemented, and new procedures to create monthly schedule were implemented.
Hazem Kaylani and Anas M. Atieh / Procedia CIRP 41 (2016) 411 – 416
Fig.1. General flow of products inside the production facility.
2.1 Simulation Model: Arena-Rockwell software v. 14 was used to create a discrete event simulation model. The model was constructed with flexible parameters to facilitate introducing modifications to the schedule quickly and with minimal effort. These parameters will be loaded from an external file prepared by the user. Two types of data will be read from this file: 1. Fixed Data: - General Standard Times x Machine setup time x Machine runtime x Cleaning time (full, dry) -
Number of Premixes for each product (Including Batch size) x Mixing stage x Coating stage
2. Schedule based data: - List of products names and codes for each month - Days of entity creation (starting day of production for each product) including two shifts - Sequence of process flow (with days of production) including machines used - Batch size - Number of premixes - Calendar of the month A user friendly template is developed that transforms different parameters of the schedule into data that is readable by the simulation software. After a schedule is created, it will then be compiled into a list of parameters readable by the simulation model. These parameters are read by the model and stored in variables arrays. These variables will determine how the schedule is arranged and the sequence that will be followed by each part, as well as when to start a batch and at what machine.
413
414
Hazem Kaylani and Anas M. Atieh / Procedia CIRP 41 (2016) 411 – 416
The simulation model will run for one month of simulation time and the following performance measures will be evaluated: 1.
2. 3.
4.
Product cycle time: total time spent in model (manufacturing cycle time), and time spent at each department. Start delay; the difference between the scheduled process start time and the simulated start time Identify time periods for each process during which this process is highly busy with utilization values exceeding 90%; and potentially causing delays to the schedule Resource utilization: a. Operators utilization, identify redundant operators during each shift, day or total monthly plan. b. Machine utilization and frequency of machine idle time
The simulation results will be exported to an external file that highlights potential areas of improvement. A list of resources that were considered bottlenecks during specified time periods of the schedule time span will be generated. The model will also show cycle per product at every visited process. A sample of the overall outputs generated is shown in Table 1.
Figure 2 shows a simulation run with animation for the created model, Users of the model can benefit, not only from final results, but also by the ability to monitor the progress of the schedule execution and observe the activities taking place at each department with time progress. Figure 3 shows sample of modules used in creating simulation logic.
Table 1 Cycle Time for the Blending Process
Product
Cycle Time (hrs)
Blending CT Pro11
41.5084
Blending CT Pro14
27.9939
Blending CT Pro10
27.0093
Blending CT Pro26
27.0003
Blending CT Pro13
23.5001
Blending CT Pro7
19.9712
Blending CT Pro16
18.8176
Blending CT Pro20
17.3893
Blending CT Pro5
16.5004
Blending CT Pro9
14.5004
Blending CT Pro6
14.5001
Blending CT Pro21
9.0007
Blending CT Pro22
7.9990
Blending CT Pro3
7.5006
Blending CT Pro19
7.5001
Blending CT Pro1
6.0006
Blending CT Pro4
4.5000
Blending CT Pro24
4.0018
Blending CT Pro25
3.0015
2.2 Model Verification and Validation: The model building procedures included: problem formulation, collecting data related to process times, resources, schedule information, etc. After the computer model was created, the verification and validation were checked.
Fig. 2 Simulation runs animation
Hazem Kaylani and Anas M. Atieh / Procedia CIRP 41 (2016) 411 – 416
415
Fig.3 Simulation model logic
Verification Verification is to confirm that the model is a true representation of the system and that it will run according to a given schedule. Verification was achieved by working closely with all stakeholders and observing the flow through animated runs. Validation Validation was achieved by comparing simulation results to output of real system. Previous schedules were loaded to the simulation model and results obtained from the model run were compared to actual system behavior. Validation showed better than 80% similarity. 3. Results and Discussion: A schedule for all planned activities for the month of February was created using the specially formatted excel data file. The schedule was compiled into a list of parameters readable by the simulation model. The data was then loaded into the model and an initial run was performed. The results of the first run showed that cycle time varied among different products, but for certain items it reached about 120 hours, which is considered pretty large. The results of this run identified processes that were the busiest and the time periods during which this occurred. As a result; a number of products were adjusted by shifting their scheduled start time at these processes to reduce the load at peak hours. A second simulation run was performed. The results from the second run were evaluated and the schedule parameters were adjusted accordingly and the simulation was executed one more time. The results of the three runs are shown in Figures 4 and 5 below. Figure 4 shows cycle times for the 31 products obtained from the three scenarios. This Figure shows that cycle times obtained in second schedule of scenario 2 were reduced for most of the products. For example, cycle times for products P3 through P8were reduced 50% on average.
Fig.4 Cycle Time per Product
In general scenario 2 performed better for the majority of items. Although it caused an increase in cycle time for some items, cycle times were more levelled across all items. Figure 5 shows the instantaneous utilization of resources as the simulation time is progressing for the three scenarios.
Fig.5 Resources Utilizations
416
Hazem Kaylani and Anas M. Atieh / Procedia CIRP 41 (2016) 411 – 416
The chart shows that in scenario 2 that utilization is spread more evenly among all resources with less number of peaks indicating smaller chance of developing bottlenecks during the actual execution of the schedule. Table 2 shows waiting time at different processes for scenario 1. It shows that some waiting time is expected for some machines. This waiting will occur if the machine is unavailable due to either the machine being busy processing another batch or because a mandatory cleaning process is taking place. Either case attention is needed for these situations. A robust schedule will lead, on one hand, to utilizing all resources more evenly over the whole one month schedule, and on the other hand, to a careful sequencing of products will reduce the machines cleaning requirements. Table 2 Waiting Times at different Processes Queue Name Granulation @ MIXH.Queue Granulation @ MIXE.Queue Blending @ DCM03.Queue Cross Flow Blending.Queue Granulation @ MIX01.Queue Tablet Compressing @ Kilian 2.Queue Fluid Drying.Queue Blending @ DCM05.Queue Blending @ DCM07.Queue Coating @ Glatt Machine.Queue Encapsulation @ Bosch 1400.Queue P2200 Cleaning.Queue Tableting @ Fette P2200.Queue Coating @ Accela Cota Machine.Queue Coating @ Sejong Machine.Queue Air Drying C.Queue Air Drying A.Queue Batch 5.Queue Blending @ DCM04.Queue Blending @ DCM06.Queue Blending @ DCM08.Queue Blistering @ Blister 02.Queue Blistering @ Blister E.Queue Blistering @ Blister J.Queue Bosch 1400 Cleaning.Queue Coating @ T 150.Queue Coating @ T 300.Queue Collect Premixes.Queue Compaction.Queue Kilian 2 Cleaning.Queue Milling @ Miller Machines.Queue
These results make sense, since reducing the effect of bottleneck resources will lead to smoother flow of items, reducing cycle times.
The results also indicate that reduction in waiting times can be achieved by either levelling the machine utilization over the schedule period or by careful selection of product sequence such that less cleaning cycles will be needed. The original contributions of this research are to establish a parameterized simulation model that can be modified using external data and models, and to develop a user friendly template that will transform different parameters of the schedule into data that is readable by the simulation software. References
Waiting Time (hrs) 10.55 8.70 7.55 6.66 5.86 4.62 4.38 3.63 3.50 2.50 2.10 1.71 1.64 1.56 1.37 0.40 0.18 0.00 0.00 0.00 0.00 0.00 0.00 0.00 0.00 0.00 0.00 0.00 0.00 0.00 0.00
[1]
Mason, S., Fowler, J., Carlyle, W. & Montgomery, D., Heuristics for minimizing total weighted tardiness in complex job shops, International Journal of Production Research, 2005, 43:10, p. 1943-1963
[2]
Kulkarni H., Bhatwadekar S., Performance of decomposition procedures for job shop scheduling problems with bottleneck machines, International Journal of Latest Trends in Engineering and Technology, 2015, 5:1, p. 245-254
[3]
Uzsoy R., Wang C., Performance of decomposition procedures for job shop scheduling problems with bottleneck machines, International Journal of Production Research, 2000, 38:6, p. 12711286..
[4]
Mönch, L., and Zimmermann J., A computational study of a shifting bottleneck heuristic for multi-product complex job shops, Production Planning & Control, 2011, 22:1, p. 25-40.
[5]
Bartschi Wall, M., A Genetic Algorithm for Resource-Constrained Scheduling, PhD Thesis, Massachusetts Institute of Technology, MA, 1996.
[6]
Aytug, H., Lawley, M., McKay, K., Mohan, S., and Uzsoy, R., 2005, Executing production schedules in the face of uncertainties A review and some future directions, European Journal of Operational Research, 2005, 161 , p. 86–110.
[7]
Cochran, J., and Kaylani, H., Optimal Design of a Hybrid Push/Pull Serial Manufacturing System with Multiple Part Types, International Journal of Production Research , 2008, Vol. 46, No. 4, p. 949-965.
[8]
Hoover, V., and Ronald F., Simulation a Problem-Solving Approach. Reading, Massachusetts: Addison-Wesley Publishing Company, 1989.
4. Conclusion Results show that the schedule obtained in scenario 2 outperformed the other two scenarios in both cycle times and provided better distribution of utilization among all resources.