Jul 9, 2003 - Leland, Taqqu, Willinger and Wilson (1994) have shown that that ... a single fast link (see, for example, Taqqu, Willinger and Sherman (1997)).
To appear in the journal "Fractals" in 2003 or2004
Simulation methods for linear fractional stable motion and FARIMA using the Fast Fourier Transform ∗†‡ Stilian Stoev and Murad S. Taqqu Boston University July 9, 2003
Contents 1
Introduction
2
2
Simulation Methods 2.1 The case of linear fractional stable motion (LFSM) . . . . . . . . . . . . . . . . 2.2 The case of fractional autoregressive moving average (FARIMA) . . . . . . . . .
4 4 13
3
Implementation of the Algorithms 3.1 The case of linear fractional stable motion (LFSM) . . . . . . . . . . . . . . . . 3.2 The case of fractional autoregressive moving average (FARIMA) . . . . . . . . . 3.3 Conclusion . . . . . . . . . . . . . . . . . . . . . . . . . . . . . . . . . . . . . . .
18 18 21 30
4 MATLAB code and illustration of how to use it
30
Abstract We present efficient methods for simulation, using the Fast Fourier Transform (FFT) algorithm, of two classes of processes with symmetric α-stable (SαS) distributions. Namely, (i) the linear fractional stable motion (LFSM) process and (ii) the fractional autoregressive moving average (FARIMA) time series with SαS innovations. These two types of heavytailed processes have infinite variances and long-range dependence and they can be used in modeling the traffic of modern computer telecommunication networks. We generate paths of the LFSM process by using Riemann-sum approximations of its SαS stochastic integral representation and paths of the FARIMA time series by truncating their moving average representation. In both the LFSM and FARIMA cases, we compute the involved sums efficiently by using the Fast Fourier Transform algorithm and provide bounds and/or estimates of the approximation error. ∗
This research was partially supported by the NSF Grant DMS-0102410 at Boston University. AMS Subject classification. Primary 60G18, 60E07 ; secondary 62M10, 65C05. ‡ Keywords and phrases: simulation, linear fractional stable motion, self-similarity, Hurst parameter, FARIMA time series, heavy tails, wavelets, Mallat’s algorithm. †
We discuss different choices of the discretization and truncation parameters involved in our algorithms and illustrate our method. We include MATLAB implementations of these simulation algorithms and indicate how the practitioner can use them.
1
Introduction
Modern computer telecommunication networks present numerous challenges for researchers from the computer science, engineering and applied mathematics communities. One of the fundamental problems in the interdisciplinary field of Computer Networks is to understand the nature of the information traffic on networks with various types of links and topologies. Leland, Taqqu, Willinger and Wilson (1994) have shown that that the fluctuations in the Ethernet traffic of a Local Area Network do not obey the classical Poisson-type stochastic models. More precisely, by performing an extensive statistical analysis, these authors established that the Ethernet traffic is statistically self-similar (or asymptotically self-similar) and exhibits longrange dependence. Other authors have confirmed these observations in various other networking contexts, for example, Paxson and Floyd (1994) and Crovella and Bestavros (1996) (see also the collection of papers edited by Park and Willinger (2000), for further references). The continuous-time stochastic process X = {X(t), t ∈ R} is said to be self-similar with self-similarity parameter H > 0, if for all c > 0, {X(ct), t ∈ R} =d {cH X(t), t ∈ R},
(1.1)
where =d denotes equality in finite-dimensional distributions. On the other hand, a stationary and finite variance time series Y = {Y (k), k ∈ Z} is said to be long-range dependent when its covariances r(k) = Cov(X(k), X(0)) decay slowly, as k → ∞, so that ∞ X k=0
|r(k)| = ∞.
(1.2)
The slow decay of the covariances means that the values of the process X are strongly dependent over long periods of time. The fractional Brownian motion process (fBm) BH = {BH (t), t ∈ R} is a well-known example of a Gaussian self-similar stochastic process, which has stationary increments. In fact, up to a multiplicative constant the fBm is the only Gaussian processes with these two properties. It has the following covariance structure Cov(BH (s), BH (t)) =
´ σ 2 ³ 2H |t| + |s|2H − |t − s|2H , t, s ∈ R, 2
where Var(BH (1)) = σ 2 ∈ (0, ∞) and H ∈ (0, 1) denotes the self-similarity parameter of BH . The last relation implies that the increment process Y (k) := BH (k) − BH (k − 1), k ∈ Z of fBm is long-range dependent when the self-similarity parameter H is in the range (1/2, 1). For more details on the long-range dependence phenomenon and the fractional Brownian motion process see, for example, the collection of papers edited by Doukhan, Oppenheim and Taqqu (2003). The fBm process has been very useful in the context of network traffic modeling not only because it reproduces the observed statistical behavior. In fact, the fBm process appears as the 2
limiting process in a physical on-off type model, where traffic is generated by many users, sharing a single fast link (see, for example, Taqqu, Willinger and Sherman (1997)). In other networking scenarios however, when for example there are few users with very irregular pattern of behavior and unlimited access to link bandwidth one observes large peaks of traffic activity. These peaks or bursts in the traffic cannot be modeled by Gaussian or finite-variance processes. Heavy-tailed processes with possibly infinite variance distributions are more natural and appropriate models in such scenarios (see for example, Willinger, Paxson and Taqqu (1998), Mikosch, Resnick, Rootzen and Stegeman (2002) and also Levy and Taqqu (2000) and Pipiras, Taqqu and Levy (2000)). Large traffic fluctuations have serious impact on system performance and they should be taken into account when designing and managing computer networks. An important problem in this context is to estimate the amount of excess bandwidth required to accommodate bursty traffic. One of the approaches in investigating performance and quality of service issues is to simulate stochastic processes which reproduce well the nature of the traffic and then use them as performance benchmarks. Our goal, in this paper, is to provide practical tools for simulating α-stable (0 < α < 2), infinite variance processes, which exhibit asymptotic self-similarity and/or long-range dependence. The definition of long-range dependence given in (1.2) is formally incorrect in the case of infinite variance processes, because the covariances do not exist. However, many authors have studied processes, which are strongly dependent in time and have infinite variances (see, for example, the collection of papers edited by Adler, Feldman and Taqqu (1998)). Here we will focus on two classical models: (i) the linear fractional stable motion (LFSM) and (ii) the fractional autoregressive moving average (FARIMA) time series with symmetric α-stable (SαS) innovations. The linear fractional stable motion is a self-similar process with stationary increments and SαS distributions. It can be viewed as an extension of the fractional Brownian motion to the stable infinite-variance case, because it has an analogous stochastic integral representation (see (2.1) below or Ch. 7 in Samorodnitsky and Taqqu (1994), for more details). The FARIMA time series with SαS innovations and positive values of the fractional differencing exponent are asymptotically self-similar and exhibit long-range dependence. The FARIMA time series models are also flexible, because they can represent a wide variety of short-term dependence structures (for more details and further references see Sections 2.2 and 3.2 below). The ideas behind the methods of simulation, presented in this work, exploit well-known representations of the LFSM and FARIMA processes. Our algorithms, however, utilize the Fast Fourier Transform (FFT) algorithm and prove to be computationally efficient in practice. The paper is organized as follows. In Sections 2.1 and 2.2, we describe methods for simulation of the LFSM process and the FARIMA time series with SαS innovations, respectively. We also give estimates on the errors of approximation involved in the simulation algorithms. Sections 3.1 and 3.2 are devoted to a numerical study of the methods presented in Sections 2.1 and 2.2, respectively. Our main focus there is on the practical choice of the discretization parameters involved in the methods of simulation. Section 4 contains MATLAB implementations of our algorithms and indications on how to use them.
3
2 2.1
Simulation Methods The case of linear fractional stable motion (LFSM)
Consider the stochastic process XH,α = {XH,α (t), t ∈ R}, which is defined by the following stochastic integral Z ³ ´ H−1/α H−1/α −1 (t − s)+ − (−s)+ XH,α (t) = CH,α dLα (s), (2.1) R
where 0 < H < 1, α ∈ (0, 2) and where Lα = {Lα (s), s ∈ R} is a standard symmetric α-stable (SαS) L´evy motion. The stochastic integral in (2.1) is well-defined since for all H ∈ (0, 1) and R H−1/α H−1/α α α ∈ (0, 2), R |(t − s)+ − (−s)+ | ds < ∞. The process XH,α is called a linear fractional stable motion (LFSM, in short). It is selfsimilar with self-similarity parameter H, that is, it satisfies Relation (1.1). The process XH,α has also stationary increments. The normalization constant CH,α is such that kXH,α (1)kα = 1, more precisely ´1/α ³Z H−1/α H−1/α α . (2.2) |(1 − s)+ − (−s)+ | ds CH,α = R
We denote by kξkα the scale coefficient of a SαS random variable ξ, that is, the coefficient which appears in the characteristic function of ξ, α
α
ϕξ (λ) = Eeiξλ = e−kξkα |λ| , λ ∈ R. For more details on the class of LFSM and other α-stable stochastic integrals see, for example, the book of Samorodnitsky and Taqqu (1994). The parameter α ∈ (0, 2) controls the tails of the distribution of a SαS random variable ξ, that is, P(|ξ| ≥ x) ∼ const x−α , as x → ∞,
(2.3)
where an ∼ bn , n → ∞ means limn→∞ an /bn = 1. The greater the value of α, the lower the probability of extreme fluctuations of the SαS process XH,α . In the Gaussian case α = 2, Lα becomes Brownian motion and then the LFSM process XH,α is the fractional Brownian motion process. Here, however, we suppose 0 < α < 2. In this case, (2.3) holds and consequently Lα has infinite variance, and when α ≤ 1, infinite mean as well. This implies in practice that Lα and hence XH,α can, with high probability, take extremely high values. The simulation method in this section works also when α = 2. In the Gaussian case, however, there exist more efficient and, in fact, exact methods (see, for example, Bardet et al (2003)). In the stable infinite variance case exact simulation techniques for the LFSM process XH,α are not known. We now present an approximate simulation method for paths XH,α (k), k = 1, . . . , N, N ∈ N of the LFSM process XH,α , defined in (2.1). Observe that by self-similarity, we have ³ ´ ³ ´ XH,α (1), XH,α (2), . . . , XH,α (N ) =d N H XH,α (1/N ), XH,α (2/N ), . . . , XH,α (1) . The idea of the method is to use a Riemann sum approximation of the stochastic integral in the representation (2.1) (see e.g. p. 370 in Samorodnitsky and Taqqu (1994)). In practice, however, 4
it is essential to compute these Riemann sums efficiently. Indeed, a direct implementation yields a prohibitively slow algorithm and it cannot be used in practice to generate long and/or accurate approximations in real time. Our method uses the fast Fourier transform algorithm (FFT, in short), which improves significantly the speed of computation as compared to a direct summation. Let Y (k) := XH,α (k) − XH,α (k − 1), k ∈ Z be the sequence of the increments of the LFSM process XH,α . By (2.1), we have that Z Z −1 −1 g(s)dLα (k − s), (2.4) g(k − s)dLα (s) = −CH,α Y (k) = CH,α R
R
H−1/α
H−1/α
where g(s) = (s)+ − (s − 1)+ . The stationary sequence Y (k), k ∈ Z is called linear fractional stable noise. We will first generate an approximate path of the stationary linear fractional stable noise process Y = {Y (k), k ∈ Z} byPreplacing the integral in (2.4) with a Riemann sum. Then, by using the fact that XH,α (k) = kj=1 Y (j), k = 1, . . . , N we will obtain an approximate path of the LFSM process XH,α . Introduce the parameters m, M ∈ N and let −1 Ym,M (k) := CH,α (m, M )
mM X³
H−1/α
(j/m)+
j=1
H−1/α
− (j/m − 1)+
´ Zα,m (mk − j),
(2.5)
where Zα,m (j) := Lα ((j + 1)/m) − Lα (j/m), j ∈ Z and where the normalization constant CH,α (m, M ) is such that kYm,M (1)kα = 1 (see (2.7) below for an exact expression). The random variables Zα,m (j), j ∈ Z are independent with the same SαS distribution and scale parameter kZα,m (j)kα = m−1/α . The parameter m controls the mesh size and the parameter M the kernel function cut-off. For large values of the parameters m and M , the variables Ym,M (k) approximate well the variables Y (k), k ∈ Z in probability. A bound on the error of approximation kY (k) − Ym,M (k)kα in terms of the parameters m, M, H and α is given in Theorem 2.1 below. We will now describe a method for efficient computation of the path Ym,M (k), k = 1, 2, . . . , N, which involves the FFT algorithm. Consider the moving average W (n), n ∈ N, W (n) :=
mM X j=1
where
aH,m (j)Zα (n − j),
(2.6)
³ ´ H−1/α −1 aH,m (j) := CH,α (m, M ) (j/m)H−1/α − (j/m − 1)+ m−1/α , j ∈ N,
and where Zα (j), j ∈ Z is a sequence of independent identically distributed (iid) standard SαS random variables, that is kZα (1)kα = 1. Since {Zα,m (j), j ∈ Z} =d {m−1/α Zα (j), j ∈ Z}, Relations (2.5) and (2.6) imply {Ym,M (k), k = 1, . . . , N } =d {W (mk), k = 1, . . . , N }, and CH,α (m, M ) = m−1
¯ ´ ³ mM X ¯¯ H−1/α ¯α 1/α . ¯(j/m)H−1/α − (j/m − 1)+ ¯ j=1
5
(2.7)
We shall then focus on computing the moving average sequence W (n), n = 1, . . . , mN. Let eα (j), j ∈ Z be m(M + N )-periodic with Z and let
Then
Zeα (j) := Zα (j), for j = 1, 2, . . . , m(M + N ),
e aH,m (j) :=
½
aH,m (j) , for j = 1, . . . , mM . 0 , for j = mM + 1, . . . , m(M + N )
+N ) n omN n m(M omN X =d , W (n) e aH,m (j)Zeα (n − j) n=1
n=1
j=1
(2.8)
because for all n = 1, 2, . . . , mN, the sum in (2.6) involves only variables Zα (j), with indices j in the range −mM ≤ j ≤ mN − 1. Relation (2.8) suggests that the variables W (n), n = 1, 2, . . . , mN can be generated by using a (circular) convolution of the two m(M + N )-periodic eα , where e sequences e aH,m and Z aH,m denotes the m(M + N )-periodic extension of the sequence e aH,m (j), j = 1, 2, . . . , m(M + N ). eα can be computed The circular convolution of the m(M + N )-periodic sequences e aH,m and Z by using their Discrete Fourier Transforms (DFT). For convenience, we recall some standard definitions and results concerning the DFT of periodic sequences. Let a = (a(j), j ∈ Z) be a R-periodic sequence, that is, a(j + R) = a(j), for all j ∈ Z. The DFT, DR (a) = (DR (a)(k), k ∈ Z), of the sequence a is defined as follows b a(k) = DR (a)(k) =
R−1 X j=0
e2πijk/R a(j), k ∈ Z.
Thus the sequence b a is R-periodic and it satisfies the inversion formula a(j) =
−1 DR (b a)(j)
R−1 1 X −2πijk/R e b a(k), j ∈ Z. := R k=0
Furthermore, for any two R-periodic sequences a and b, we have the following convolution theorem DR (a)(k)DR (b)(k) = DR (a ∗ b)(k), k ∈ Z, where (a ∗ b)(n) :=
R−1 X j=0
a(n − j)b(j), n ∈ Z.
If R is an integer power of two, then the DFT of the R-periodic sequence a can be computed efficiently by using the FFT (radix-2) algorithm. The above discussion leads to the following algorithm. Algorithm 1. Pick large enough integers m and M , so that m(M + N ) is an integer power of two. 6
2. By using the radix-2 FFT algorithm, compute the DFT b a(k) := Dm(M +N ) (e aH,m )(k), k = 0, . . . , m(M + N ) − 1
of the m(M + N )−periodic sequence e aH,m .
3. Generate m(M + N ) iid standard SαS variates Z(j), j = 1, . . . , m(M + N ) and, by using the radix-2 FFT algorithm, compute b Z(k) := Dm(M +N ) (Z)(k), k = 0, . . . , m(M + N ) − 1.
b 4. Using the radix-2 FFT algorithm, compute the inverse DFT of the sequence b a(k)Z(k), k= 0, . . . , m(N + M ) − 1, and keep only −1 b W (n + 1) := Dm(M aZ)(n), where n = 0, . . . , mN − 1, +N ) (b
b b and where (b aZ)(k) =b a(k)Z(k), k = 0, 1, . . . , m(M + N ) − 1.
5. Set
Ym,M (k) = W (mk), k = 1, . . . , N and let X(n) :=
n X
Ym,M (k), n = 1, . . . , N.
(2.9) (2.10)
k=1
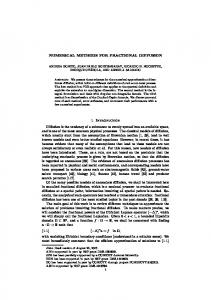
Ym,M (k), k = 1, . . . , N is the approximation of the linear fractional stable noise process Y and the sequence X(n), n = 1, . . . , N is the desired approximate path of the linear fractional stable motion process XH,α . In Section 3.1, we present numerical illustrations of the simulation algorithm. MATLAB implementation of this algorithm can be found in Section 4. Figure 1 displays simulated paths of LFSM obtained by using this code. The path behavior of the LFSM process XH,α depends on the structure of the kernel function fH,α (t, s) = (t − H−1/α H−1/α s)+ − (−s)+ , t, s ∈ R in (2.1). In Figure 1, five of the six graphs correspond to the case H − 1/α < 0. When H − 1/α < 0 the function fH,α (t, s), s ∈ R has singularities at s = 0 and s = t. These singularities magnify the stable noise process dLα (s), s ∈ R and cause the large spikes in the paths of the LFSM process. These paths are very irregular and in fact discontinuous with probability one (see Ch. 10 in Samorodnitsky and Taqqu (1994), for example). Their dependence structure, however, resembles that of a negatively correlated process and thus we shall refer to this case as to the negative dependence scenario. In the case when H − 1/α > 0, (since 0 < H < 1 it necessarily follows that α > 1) the kernel fH,α (t, s), s ∈ R is bounded and positive, for all t > 0. Thus the jumps in the paths of XH,α , due to the fluctuations of the noise process dLα (s), s ∈ R, are not as magnified as in the case H − 1/α < 0. In this case especially for large values of H, the kernel function fH,α (t, s), s ∈ R decays slowly as s → −∞. This implies that the past fluctuations in the process dLα (s), s ∈ R influence significantly the present values of the process XH,α . This case is referred to as the long-range dependence scenario (see Figure 1). The paths of the process XH,α can be made continuous with probability one (see Ch. 10 in Samorodnitsky and Taqqu (1994), for example). The following result, gives a upper bound on the error of approximation involved in the above algorithm, when applied to linear fractional stable noise. 7
α = 1.5, H =0.2
α = 1.5, H =0.7
2000
2000
1000
0
0
−2000
−1000 0
5000
α = 1, H =0.2
−4000 0
10000
10E4
10E4
5E4
5E4
0
0
−5E4 0
5000
α = 0.4, H =0.2
−5E4 0
10000
2 E14
1E12
0
0
−2E14
−1E12
−4E14 0
5000
−2E12 0
10000
5000
10000
5000
10000
5000
10000
α = 1, H =0.7
α = 0.4, H =0.7
Figure 1: Each graph displays ten independent simulated paths of LFSM with N +M = 16 384 = 214 , and discretization parameters m = 256 = 28 , M = 600 (see Section 2.1), where the symbol aEb denotes the number a × 10b . The vertical scale is different from one graph to the other. Observe the difference between “high” and “low” values of α, that is, “heavy” and “very heavy” tails, respectively. (For “very low” values of α there are a number of fluctuations whose size is much greater than in rest of the path.) Also note the difference between the negative dependence (H < 1/α) and long-range dependence (H > 1/α) cases. All graphs but the one on the top right involve negative dependence scenarios. Because of the nature of the kernel of LFSM, in the cases of negative dependence, the jumps are quickly balanced by jumps with opposite signs, which results in visual spikes on the graphs. In the case of long-range dependence (α = 1.5, H = 0.7), the paths are more dependent on the past and no significant spikes are observed.
8
Theorem 2.1 Let Y be the linear fractional stable noise process and Ym,M its approximation, defined by (2.4) and (2.5), respectively. For all m, M ∈ N, M ≥ 2 and k ∈ Z, we have 1/α
kY (k) − Ym,M (k)kα ≤ JH,α (m, M ). The bound JH,α is as follows. For 1 ≤ α ≤ 2, JH,α (m, M ) =
(2.11)
2α
α (m, M ) IH,α (m, M ), CH,α
(2.12)
and for 0 < α < 1, JH,α (m, M ) =
1
α (m, M ) IH,α (m, M ) CH,α
where IH,α (m, M ) :=
+
(CH,α + CH,α (m, M ))(1−α)α α IH,α (m, M ), α (m, M ) αα CH,α
Cα,1 (H) Cα,2 (H) . + αH m (M − 1)α(1−H)
(2.13)
(2.14)
The constants Cα,i (H), i = 1, 2 do not depend on k (see (2.22) and (2.23), below, for their exact expressions). Proof: Consider the SαS random variables ξ := CH,α (m, M )Ym,M (k) =
mM X³
H−1/α
(j/m)+
j=1
H−1/α
− (j/m − 1)+
´
Zα,m (mk − j),
where Zα,m (j) = Lα ((j + 1)/m) − Lα (j/m), j ∈ Z and Z ³ ´ H−1/α H−1/α η := CH,α Y (k) = − (s)+ − (s − 1)+ dLα (k − s).
(2.15)
(2.16)
R
We will first prove that kη − ξkαα ≤ IH,α (m, M ),
(2.17) R j/m
where IH,α (m, M ) is defined in (2.14). Since Zα,m (mk − j) = − (j−1)/m dLα (k − s), we have that mM ´ X Z j/m ³ H−1/α H−1/α sH−1/α − (j/m)H−1/α − ((s − 1)+ − (j/m − 1)+ ) dLα (k − s) η−ξ = − (j−1)/m
j=1
−
Z
∞³
´ sH−1/α − (s − 1)H−1/α dLα (k − s).
M
The independence and stationarity of the increments of the L´evy motion Lα = {Lα (s), s ∈ R} implies that
kη −
ξkαα
=
mM X Z j/m j=1
(j−1)/m
+
Z
∞¯
M
¯ ¯ ¯ H−1/α H−1/α H−1/α ¯α − (j/m)H−1/α − ((s − 1)+ − (j/m − 1)+ )¯ ds ¯s
¯α ¯ H−1/α ¯ − (s − 1)H−1/α ¯ ds =: I + J. ¯s 9
(2.18)
Consider first the second term J in (2.18). By the mean value theorem applied to the function over the interval x ∈ [s − 1, s], we obtain Z ∞ |H − 1/α|α α (s − 1)α(H−1)−1 ds = (M − 1)−α(1−H) , (2.19) J ≤ |H − 1/α| α(1 − H) M
xH−1/α
since (H − 1/α) − 1 < 0, M ≥ 2 and α(H − 1) < 0. Now we focus on the second term I in (2.18). By using the inequality (x + y)α ≤ 2xα + 2y α , valid for all x, y ≥ 0 and α ∈ (0, 2], we get that I ≤ 4
Z
1/m
(H−1/α)α
s
ds + 4
0
+2
mM X Z
j/m
j=m+2 (j−1)/m
Z
(H−1/α)α
(1/m) 0
ds + 2
mM X Z j/m j=2
(j−1)/m
|sH−1/α − (j/m)H−1/α |α ds
|(s − 1)H−1/α − (j/m − 1)H−1/α |α ds
mM
≤
1/m
X 4(1 + αH) −αH m +4 αH j=2
Z
j/m
(j−1)/m
|sH−1/α − (j/m)H−1/α |α ds.
(2.20)
The monotonicity of the function sH−1/α , for all s > 0 implies that, for all s ∈ [(j − 1)/m, j/m], j ≥ 2, |sH−1/α − (j/m)H−1/α |α ≤ |((j − 1)/m)H−1/α − (j/m)H−1/α |α
≤ |H − 1/α|α m−α ((j − 1)/m)α(H−1)−1 ,
(2.21)
where the last inequality follows by the mean value theorem, applied to the function xH−1/α on the interval x ∈ [(j − 1)/m, j/m]. By using the inequalities in (2.20) and (2.21), we get that ∞
I ≤
X 4(1 + αH) −αH m + 4|H − 1/α|α m−α−1 (j/m)α(H−1)−1 αH j=1 ∞ X
4(1 + αH) −αH m + 4|H − 1/α|α m−αH j α(H−1)−1 αH j=1 ´ ³ 4(1 + αH) 1 + 4|H − 1/α|α (1 + ) m−αH =: Cα,1 (H)m−αH . (2.22) ≤ αH α(1 − H) R P α(H−1)−1 ≤ 1+ ∞ xα(H−1)−1 dx = 1+1/α(1− The last inequality follows by the fact that ∞ j=1 j 1 H). By combining the inequalities in (2.19) and (2.22), we obtain the bound in (2.17), where the constant Cα,2 (H) is given by |H − 1/α|α Cα,2 (H) := . (2.23) α(1 − H) =
We shall now use (2.17) to establish (2.11). If follows from (2.5) and (2.15) that kξkα = CH,α (m, M ) and from (2.2), (2.4) and (2.16) that kηkα = CH,α . Therefore (2.15) and (2.16) 10
imply that ° η ° 1 ξ ° (kξkα − kηkα ) ° ° ° ° °α kY (k) − Ym,M (k)kαα = ° − (η − ξ) + η° . ° =° kηkα kξkα α kξkα kξkα kηkα α
(2.24)
Suppose first that 1 ≤ α ≤ 2. By using the triangle inequality for the norm k·kα and Relation (2.24), we obtain ³ kη − ξk 2α |kηkα − kξkα | ´α 2α α α ≤ + kη − ξk ≤ IH,α (m, M ) kY (k) − Ym,M (k)kαα ≤ α kξkα kξkα kξkαα kξkαα in view of (2.17). This is (2.11). Now assume that 0 < α < 1. By (2.24) and the triangle inequality for the metric k · kαα , we have ¯α ´ ¯ 1 ³ ¯ ¯ α kY (k) − Ym,M (k)kαα ≤ kηk − kξk kη − ξk + . (2.25) ¯ α α¯ α kξkαα Lemma 2.1, below, implies that ¯α ¯ ´(1−α)α ³ 2 ¯ ¯ . ¯kηkα − kξkα ¯ ≤ α−α kη − ξkαα kηkα + kξkα
By Relations (2.17) and (2.25), the last inequality implies the bound in (2.11), since kξkα = CH,α (m, M ) and kηkα = CH,α . This completes the proof of the theorem. ¤ The following lemma was used in the proof of Theorem 2.1, above.
Lemma 2.1 Let ξ and η be two non-trivial, jointly SαS random varibles, where 0 < α < 1. Then, we have that ¯ ¯ ´1−α ³ ¯ ¯ , (2.26) ¯kηkα − kξkα ¯ ≤ α−1 kη − ξkαα kηkα + kξkα where kξkα denotes the scale coefficient of the random variable ξ.
Proof: For all 0 < x1 ≤ x2 , we have the following inequality . x2 − x1 ≤ α−1 (xα2 − xα1 )x1−α 2
(2.27)
Indeed, consider the function ϕ(x1 ) := α−1 (xα2 − xα1 )x1−α − x2 + x1 , which is equal to the 2 difference between the right- and left-hand sides of (2.27). For all x1 ∈ (0, x2 ], the function ϕ(x1 ) is non-increasing, since α − 1 < 0 and ϕ′ (x1 ) = −(x1 /x2 )α−1 + 1 ≤ 0. This implies that ϕ(x1 ) ≥ 0 = ϕ(x2 ) and hence the inequality (2.27) holds for all x1 ∈ (0, x2 ]. Without loss of generality let x2 := kηkα ≥ x1 := kξkα . By (2.27), we then have that ¯ ¯ ¯ ¯ ¯ ¯ −1 ¯ α α¯ ≤ α−1 (kη − ξkαα )kηk1−α ¯kηkα − kξkα ¯ ≤ α ¯kηkα − kξkα ¯kηk1−α α α ,
where the last inequality follows by the triangle inequality for the metric k · kαα , 0 < α < 1. The last relation implies (2.26). ¤
By using the triangle inequality for the metricP k · k1∧α α , one can also obtain a bound on the 1∧α error of approximation kXH,α (n) − X(n)kα ≤ nk=1 kY (k) − Ym,M (k)k1∧α α , n = 1, 2, . . . , N (here a ∧ b stands for min{a, b} and a ∨ b for max{a, b}). Since the bounds in Theorem 2.1 do not depend on k, one gets 11
Corollary 2.1 Let XH,α be LFSM defined in (2.1) and X(n) be its approximation defined in (2.10) and (2.5). Let JH,α (m, M ) be the bound defined in (2.12)-(2.14). For all n ∈ N, we have 1/α
kXH,α (n) − X(n)kα ≤ n1∨1/α JH,α (m, M ),
(2.28)
kXH,α (n) − X(n)kα = O(1/mH(1∧α) + 1/M (1−H)(1∧α) ).
(2.29)
and, as m, M → ∞,
The result of Theorem 2.1 implies that Corollary 2.2 As m, M → ∞, the approximations {Ym,M (k), k ∈ Z} converge in finitedimensional distributions to the linear fractional stable noise process {Y (k), k ∈ Z}. Proof: Let k1 , . . . , kn ∈ Z and λ1 , . . . , λn ∈ R. Let also Y and Ym,M be defined on the same probability space by Relations (2.4) and (2.5), then by using the triangle inequality for the metric k · k1∧α α , we obtain n n n °1∧α X °X X ° ° |λj |1∧α kY (kj ) − Ym,M (kj )k1∧α −→ 0, (2.30) ≤ λj Ym,M (kj )° λj Y (kj ) − ° α j=1
j=1
α
j=1
as m, M → ∞ by (2.11)-(2.14). This implies the desired convergence in finite-dimensional distributions. Indeed, for a sequence ξn , n ∈ N of SαS random variables, the convergence of the scale coefficients kξn kα → 0, implies ξn →d 0, as n → ∞, where →d means convergence in distribution and, since Relation (2.30) holds for all λ1 , . . . , λn ∈ R, one has convergence of the finite-dimensional distributions. ¤ Remarks
1. Independent identically distributed SαS pseudo-random variables Zα (j), j = 1, . . . , n, can be generated by using the classical algorithm of Chambers, Mallows and Stuck (1976, 1987) (see also Section 4). 2. Relation (2.29) in Corollary 2.1 provides asymptotic bounds for kXH,α (n) − X(n)kα as m, M → ∞. When the discretization parameters m and M are fixed, however, the error of approximation kXH,α (n) − X(n)kα may increase, as n grows, because X(n) is the cumulative sum of the approximations Ym,M (1), . . . , Ym,M (n) to the linear fractional stable noise sequence Y (1), . . . , Y (n). It is thus important to choose appropriately large values of m and M , when one wants to generate long sample paths of the LFSM process XH,α . We discuss the choice of the discretization parameters m and M in Section 3.1. 3. When m(M + N ) = 2p , p ∈ N, the complexity of the above algorithm is that of the FFT, namely, of the order O(m(N + M ) log2 (m(M + N ))). On the other hand a direct computation of the sums in (2.5) would have complexity of the order O(mM N ). The FFTbased algorithm improves significantly the speed of computation of the paths of LFSM, in comparison with the direct approach. 4. When m(M + N ) is not an integer power of two, then one can use other types of FFT algorithms (e.g. the so-called mixed-radix FFTs) (see, for example, Ch. 12 in Press et al (1992)). 12
2.2
The case of fractional autoregressive moving average (FARIMA)
Fractional autoregressive moving average (FARIMA, in short) time series with SαS, α ∈ (1, 2) innovations were studied in Kokoszka and Taqqu (1995) as an infinite variance counterpart to the FARIMA model introduced by Granger and Joyeux (1980). These models, denoted FARIMA(p, d, q), p, q ∈ N, extend the usual ARIMA(p, d, q) models, replacing the integer differencing exponent d with an arbitrary fractional real number. In this section we assume that 0 < d < 1 − 1/α,
and
1 < α < 2.
(2.31)
A fractional ARIMA time series Y = {Y (k), k ∈ Z} with SαS innovations is defined as the stationary solution to the back-shift operator equation Φp (B)Y (k) = Θq (B)(I − B)−d Zα (k), k ∈ Z,
(2.32)
where the innovations Zα (k)s are iid standard SαS random variables, BY (k) := Y (k − 1) and Φp (z), Θq (z) are real polynomials of degrees p, q, respectively, Φp (z) = 1 − φ1 z − φ2 z 2 − · · · − φp z p , and Θq (z) = 1 − θ1 z − θ2 z 2 − · · · − θq z q ,
(2.33)
with roots outside the unit disk {z ∈ C : |z| ≤ 1}. These assumptions and condition (2.31) guarantee the existence and uniqueness of the solution Y to (2.32), for more details see e.g. Kokoszka and Taqqu (1995). Corollary 3.1 in Kokoszka and Taqqu (1995) implies that Y (k) =
∞ X j=0
c(j)Zα (k − j) =
k X
j=−∞
c(k − j)Zα (j), k ∈ Z,
(2.34)
where the coefficients c(j) satisfy the relation ¯ c(j) Θq (1) ¯¯ ¯ ¯ d−1 − ¯ = O(j −1 ), j Φp (1)Γ(d)
as j → ∞.
(2.35)
The polynomials Φp and Θq can be used to model a variety of short term dependence structures of the heavy-tailed time series Y (k), k ∈ Z (see Figure 2). On the other hand, because of relation (2.35), the parameter d governs the long-term behavior of the FARIMA model. In fact, d−1 since 0 < d < 1 − 1/α P and c(j) ∼ j , as j → ∞, the moving average coefficients c(j) decay very slowly, so that j |c(j)| = ∞. This indicates that the process Y is strongly dependent in time and the parameter d can be interpreted as the long-range dependence exponent of Y . For more details and applications see Kokoszka and Taqqu (1996). We will now discuss a fast method for simulation of FARIMA time series, which involves the FFT algorithm. by
• The FARIMA(0, d, 0) case. The moving average coefficients c(j) := b(j), j ∈ Z are given b(0) = 1, b(j) =
Γ(j + d) , j = 1, 2, . . . Γ(d)Γ(j + 1) 13
(2.36)
(see e.g. Relations (2.3) and (2.4) in Kokoszka and Taqqu (1995)). We approximate the path Y (n), n = 0, 1, . . . , N − 1, N ∈ N by the truncated moving average Y (n) ≈ YM (n) :=
M −1 X j=0
c(j)Zα (n − j), n = 0, 1, . . . , N − 1.
(2.37)
Using Relation (2.35), one can estimate the error of approximation in (2.37); for more details see Theorem 2.2 below. We now briefly describe the simulation procedure. As in the case of LFSM, let ½ eb(j) = b(j) , for j = 0, . . . , M − 1, 0 , for j = M, . . . , M + N − 1,
(2.38)
and set eb(j + k(M + N )) := eb(j), j = 0, . . . , M + N − 1, k ∈ Z, so that the sequence eb = (eb(j), j ∈ Z) is (M + N )-periodic. Define also the (M + N )-periodic sequence e + k(M + N )) := Zα (j), j = 0, 1, . . . , M + N − 1, k ∈ Z, Z(j
(2.39)
where Zα (j), j = 0, 1, . . . , M + N − 1 are iid standard SαS random variables. Then by (2.37), we have {YM (n), n = 0, . . . , N − 1} =d
n M +N X−1 j=0
o eb(j)Z(n e − j), n = 0, . . . , N − 1 .
We can now use the FFT algorithm to compute the last circular convolutions (as in the case of LFSM in Section 2.1). That is, we take the inverse DFT of the product of the DFTs of the two e More precisely, we have the following algorithm. (M + N )-periodic sequences eb and Z. Algorithm
1. Choose a truncation parameter M ∈ N and a sample size N ∈ N, so that (M + N ) is an integer power of two. 2. By using the Relations (2.36) and (2.38), calculate the set of coefficients eb(j), j = 0, 1, . . . , M + N − 1. Using the radix-2 FFT algorithm, compute the DFT bb(k) := DM +N (eb)(k), k = 0, 1, . . . , M + N − 1 of the (M + N )-periodic sequence eb.
3. Generate (M +N ) standard iid SαS pseudo-random variables Z(j), j = 0, 1, . . . , M +N −1. b e By using the radix-2 FFT, compute the DFT Z(k) := DM +N (Z)(k), k = 0, 1, . . . , M + e defined in (2.39). N − 1 of the (M + N )-periodic sequence Z,
b and 4. By using the radix-2 FFT algorithm, compute the inverse DFT of the product (bbZ) let −1 bb YM (j) := DM +N (bZ)(j), j = 0, 1, . . . , N − 1, b b where (bbZ)(k) := bb(k)Z(k), k = 0, 1, . . . , M + N − 1.
Take the sequence YM (j), j = 0, 1, . . . , N − 1 as the simulated path of the FARIMA time series Y . 14
φ1=−0.97, θ1=0.3
φ1=0, θ1=0
α = 2, d=0.4
20 10
−10
0
5000
10000
200
α = 1.5, d= 0.3
100
0
50
−5
0
0
−20
−10
0
5000
10000
−50
0
5000
10000
0
5000
10000
−3000 10000 0
5000
10000
100
100
100 0
0
0
−100 −100
−100 −200
α =1.1, d=0.09
φ1=0.97, θ1=0.3
5
0
5000
10000
−200
−200
0
5000
10000
−300
4000
1000
1000
2000
0
0
0
−1000
−1000
−2000
−2000
−2000
−4000
0
5000
−3000 10000 0
5000
Figure 2: Each graph displays one simulated path of FARIMA(1, d, 1) with SαS innovations, N = 10, 000 and N +M = 220 (see Section 2.2). All nine paths were computed by using the same seed for the random number generator. Thus paths with equal values of the index of stability α, involve the same samples of iid SαS innovations. The vertical scale is different from one graph to the other. The paths in the first column correspond to the so-called weak short-range dependence case and those in the last column to the strong short-range dependence case (see, for example, Section 7 in Stoev and Taqqu (2003a)).
15
Section 3.2 contains a brief numerical illustration of this algorithm. Its MATLAB implementation can be found in Section 4. • The FARIMA(p, d, q) case. Let b(j), j = 0, 1, . . . denote the moving average coefficients of a FARIMA(0, d, 0) time series given in (2.36). Then for the coefficients c(m), m ∈ Z in (2.34), we have the formulas c(m) = b(m) +
p X j=1
q X
φj c(m − j) −
k=1
θk b(m − k), m = 0, 1, . . . ,
(2.40)
where c(m) = 0, for m < 0 and where φj and θk are the coefficients of Φp (z) and Θq (z) in (2.33), above (see e.g. Relation (2.8) in Kokoszka and Taqqu (1995)). By using (2.40) and the expression for b(j) in (2.36), we compute the coefficients c(j), j = 0, 1, . . . , M − 1. We then use the truncated moving average in (2.37) to obtain an approximate path YM (k), k = 0, 1, . . . , N −1 of a FARIMA(p, d, q) time series Y . The path YM (j), j = 0, 1, . . . , N − 1 can be computed by using the same algorithm as in the FARIMA(0, d, 0) case. One must only change step 2, which now involves the coefficients c(j), defined in (2.40), instead of b(j), defined in (2.36). The following theorem provides the first order of the approximation error kYM (k) − Y (k)kα , as M → ∞. Theorem 2.2 Let α ∈ (1, 2), d ∈ (0, 1 − 1/α), H = d + 1/α and M ∈ N. Let also Y be the FARIMA time series defined in (2.34) and YM be its approximation, defined in (2.37). For all k ∈ Z, as M → ∞, we have kY (k) − YM (k)kα −
³ ´ C(H, α) 1 = O , M 1−H M (1−H)+1
(2.41)
where C(H, α) = |Θq (1)|/(|Φp (1)|Γ(d)(1 − H)1/α α1/α ).
P d−1 Z (k − j), where C Proof: Consider the random variable ξM = C ∞ = α j=M j Θq (1)/(Φp (1)Γ(d)). Since the random variables Zα (j), j ∈ Z are standard SαS and independent, we have that ∞ X kξM kαα = |C|α j (d−1)α . (2.42) j=M
For all j ≥ 2,
R j+1 j
x(d−1)α dx ≤ j (d−1)α ≤ Z
∞
(d−1)α
x M
dx ≤
Rj
(d−1)α dx, j−1 x
∞ X
j
(d−1)α
j=M
≤
Z
since (d − 1)α < 0. Thus, ∞
x(d−1)α dx
M −1
and therefore, by (2.42), we get |C|α 1 1 |C|α α ≤ kξ k ≤ , M α α(1 − H) M α(1−H) α(1 − H) (M − 1)α(1−H)
16
(2.43)
R∞ because M x(d−1)α dx = (α(1 − H))−1 M −α(1−H) . Observe that the mean value theorem applied to the function −x−(1−H) on the interval x ∈ [M − 1, M ] yields −
1 M 1−H
+
³ ´ 1 1 1−H ≤ (M − (M − 1)) = O , (M − 1)1−H (M − 1)(1−H)+1 M (1−H)+1
(2.44)
as M → ∞. Hence, by raising the expression in (2.43) to the power 1/α, and using (2.44), we obtain ³ ´ 1 1 |C| = O , (2.45) kξM kα − (α(1 − H))1/α M 1−H M (1−H)+1
as M → ∞. We now estimate the error of approximation kY (k) − YM (k)kα . By using Relations (2.34) and (2.37), the fact that Zα (j)s, j ∈ Z are iid standard SαS and the triangle inequality for the norm k · kα , we obtain ¯ ¯ ¯ ¯ ¯kY (k) − YM (k)kα − kξM kα ¯ ≤ kY (k) − YM (k) − ξM kα ∞ ∞ ∞ °X ° ³X ´1/α X ° ° =° j d−1 Zα (k − j)° = |c(j) − Cj d−1 |α c(j)Zα (k − j) − C
=
j=M ∞ ³X
j=M
α
j=M
j=M
∞ ¯ c(j) ¯α ³ 1 ´³ X ³ ´ ´1/α ´ 1 ¯ ¯ (d−1)α 1/α =O j (d−1)α =O ,(2.46) ¯ d−1 − C ¯ j j M M (1−H)+1 j=M
P (d−1)α = as M → ∞. In the last expression we used Relation (2.35) and the fact that ∞ j=M j O(M (d−1)α+1 ) = O(M −α(1−H) ), as M → ∞. Since C(H, α) = |C|/(α(1 − H))1/α , by using the triangle inequality, (2.45) and (2.46), we get that the left-hand side of (2.41) is bounded above by ¯ ¯ ¯ 1 C(H, α) ¯¯ ¯ ¯ ¯ kξ k − + kY (k) − Y (k)k − kξ k ¯ = O( (1−H)+1 ), ¯ M α ¯ α M M α¯ M 1−H M
which completes the proof of the theorem. ¤ Remarks
1. If M +N = 2p , p ∈ N, then the complexity of the above simulation algorithm is of the order O((M + N ) log2 (M + N )). Observe that the coefficients b(j) and c(j), j = 0, 1, . . . , M − 1 can be computed by using O(M ) operations. 2. In view of Relation (2.41) in Theorem 2.2, the expression C(H, α)/M 1−H provides a very good estimate for the error of approximation kY (k)−YM (k)kα in the simulation algorithm. 3. The main advantage of the FFT-based simulation method over a direct computation of the moving averages in (2.37) is that it allows us to work with very large values of N and M , using small amount of time and computer memory.
17
3 3.1
Implementation of the Algorithms The case of linear fractional stable motion (LFSM)
In this section we illustrate briefly the simulation algorithm for the LFSM process XH,α given in Section 2.1. Our main goal here is to show how different choices of the discretization parameters m and M affect the quality of the simulated paths. We generate paths of the LFSM process XH,α by using the algorithm in Section 2.1. We choose different values of the discretization parameters m and M and the parameters H and α. For each choice of m, M, H and α, we generate n = 256 independent paths X(1), . . . , X(N ) of length N = 10, 000. Then we evaluate the quality of the simulated paths by estimating b W T and finite impulse the self-similarity parameter H. We use wavelet transform estimators H b response estimators HF IRT . We will briefly recall the definitions and some basic properties of these estimators (see Stoev, Pipiras and Taqqu (2002), for more details). b W T and H b F IRT involve the following arrays of coefficients • The wavelet and FIRT estimators H Dκ = {Dκ (n, k), n ∈ N, k ∈ Z},
where κ stands either for the label “W T ” or the label “F IRT ”. In the case of the estimator b F IRT , the array DF IRT is made out of finite impulse response coefficients DF IRT (n, k) of the H path X(k), k = 1, . . . , N, defined as DF IRT (n, k) =
p X i=0
ui X(n(i + k)), n ≥ 1, k ∈ Z,
(3.1)
where u = (u0 , u1 , . . . , up ) is a discrete linear filter with Q ≥ 1, Q ∈ N zero moments. That is, p X i=0
iq ui = 0, q = 0, 1, . . . , Q − 1, and
p X i=0
iQ ui 6= 0.
b W T , the array DW T is made out of wavelet coefficients In the case of the wavelet estimator H DW T (n, k), computed from the path X(k), k = 1, . . . , N. Namely, Z −1 e DW T (n, k) = X(t)n ψ(n−1 t − k)dt, n ≥ 1, k ∈ Z. (3.2) R
where ψ is a mother wavelet function with compact support and Q ≥ 1 zero moments, that is, Z Z q t ψ(t)dt = 0, q = 0, 1, . . . , Q − 1, and tQ ψ(t)dt 6= 0. R
R
e is the continuous-time interpolation of the path X(k), k = 1, . . . , N via the The process X scaling function ϕ associated with the wavelet ψ, that is, e X(t) :=
N X k=1
X(k)ϕ(t − k). 18
We choose a wavelet ψ which generates an orthonormal basis of L2 (R) through a multiresolution analysis (for more details see for example Daubechies (1992)). The arguments n and k of the coefficients Dκ (n, k), κ ∈ {W T, F IRT } are referred to as a scale and location. When n is large, the coefficients Dκ (n, k), k ∈ Z capture “coarse” details of the time series, and when n is small the Dκ (n, k)s capture “fine” (or high-frequency) details of the process. Observe that on a scale n ∈ N, n < N there are only about [N/n] non-zero coefficients Dκ (n, k), because the wavelet ψ and the scaling function ϕ have compact supports and because the filter u is finite. In practice, one often uses dyadic scales n = 2m , m ∈ N and computes the wavelet coefficients DW T (n, k)s via the Mallat’s fast discrete wavelet transform algorithm (see, for example Mallat (1998)). b κ , κ ∈ {W T, F IRT } are obtained by performing a log-linear regression on The estimators H the coefficients and measuring the slope. Formally, bκ = H
j2 X
wj
j=j1
Nj ³ 1 X ´ log2 |Dκ (2j , k)| , Nj
(3.3)
k=1
where j1 , j2 , Nj ∈ N, j = j1 , . . . , j2 , and where the weights wj , j = j1 , . . . , j2 are such that j2 X
wj = 0
and
j2 X
jwj = 1
j=j1
j=j1
(for more details see Stoev, Pipiras and Taqqu (2002)). Relation (3.3) involves parameters j1 , j2 and Nj , j = j1 , . . . , j2 . b W T and H b F IRT • Properties of the estimators H
b F IRT is unbiased for all 0 < α < 2 (Proposition 2.3 in Stoev, Pipiras 1. The estimator H and Taqqu (2002)). When 1 < α < 2, under certain technical conditions, the estimators b W T and H b F IRT are consistent and asymptotically normal, as N → ∞ and j1 , j2 → ∞, H (Theorems 3.1 and 3.2, Stoev, Pipiras and Taqqu (2002)). 2. In practice, when 1 < α < 2, as shown in Stoev, Pipiras and Taqqu (2002), although b W T and H b F IRT are very good and essentially unbiased, H b W T is slightly both estimators H b better. In fact, the wavelet estimator HW T seems to be more robust and with slightly b F IRT . lower sample variance than the estimator H b W T has greater bias than the estimator 3. In the case 0 < α ≤ 1, the wavelet estimator H b F IRT . In fact, the wavelet coefficients DW T (n, k) are not well-defined unless H−1/α > −1 H b W T do not work well for α < 1/2. On the other hand, the estimators and the estimators H b F IRT are unbiased and still perform well for all 0 < α ≤ 1. Thus in the sequel we will H b W T in the case 1 < α < 2, and the estimators H b F IRT in the case use the estimators H 0 < α ≤ 1.
b κ ) − H of the Figures 3 and 4 contain approximate 95% confidence intervals for the bias E(H b κ , κ ∈ {W T, F IRT }. These confidence intervals are obtained by using the normal estimators H approximation, based on samples of n = 256 independent replications of the estimators. More 19
precisely, for each set of values of the parameters m, M, H and α, we generated independently b κ and then we obtained the following confidence n paths of LFSM, computed the estimators H intervals h SW T SW T i (3.4) H κ − H − z0.025 √ , H κ − H + z0.025 √ , κ ∈ {W T, F IRT }. n n In the above expression H κ and Sκ denote the sample mean and the sample standard deviation b κ and z0.025 ≈ 1.96 denotes the 0.975th quantile of the standard normal of the n estimates H distribution. b W T were computed by using Daubechies wavelets with 3 zero moments and The estimators H all available dyadic scales with the exception of the first 3, that is, j1 = 4 and j2 = 12. We choose j1 = 4 (instead of j1 = 1) to get rid of the potential effects due to the initialization of the Mallat’s fast discrete wavelet transform algorithm. To take care of the filter edge effects we choose j2 = 12 < [log2 (N )] = 13, that is 212 = 4, 096 < N = 10, 000. For the FIRT estimators b F IRT , we used the filter u = (1, −3, 3, −1), which also has 3 zero moments and the same dyadic H b W T . The number of coefficients Nj at a scale scales as in the case of the wavelet estimator H j 2 without edge effects in (3.3) is of the order N/2j . More precisely, Relations (3.1) and (3.2) imply that Nj = [N/2j ] − p in the case of FIRT; and Nj = [N/2j − K − K/2j ] − [K + K/2j ] in the case of WT, where K > 0 is such that supp{ϕ} ∪ supp{ψ} ⊂ [−K, K], and where [x] denotes the integer part of the number x ∈ R. • We will now make some general observations, based on the results on Figures 3 and 4. 1. Consider Figure 3 where α = 1.5. Observe that when m = 64 and even when m = 16, the simulated paths of LFSM are very good, for all choices of the parameter M and for most values of the self-similarity parameter H. The best choice of the discretization parameters, in this case, seems to be m = 64 and M = 600, for most values of H. As we will see below the value of m should be adapted to that of M , particularly in the case of negative dependence H < 1/α. 2. In the long-range dependence cases, that is, H > 1/α ≈ 0.67, the simulated paths seem to improve slightly when greater values for the cut-off parameter M are chosen (see Figure 3), since the corresponding confidence intervals for the bias become more centered around zero. 3. Surprisingly, the choice m = 256 (on Figure 3, where α = 1.5) impairs the precision of the paths for most parameter values of H and M , especially in the negative-dependence cases, that is, 0 < H < 1/α ≈ 0.67. Observe, however, that when m = 256, for all values of H, the paths seem to improve when larger values of M are chosen and that in all long-range dependence cases (H > 1/α ≈ 0.67) the simulated paths are admissible when M = 600 or M = 6000. 4. Consider now Figure 4 where α = 0.5 and hence the noise can take very large values. It seems here that our choices of the parameters m and M are inappropriate, for many values of H, since the corresponding confidence intervals do not cover zero. In contrast with Figure 3, the choices m = 16 and m = 64 do not work. On the other hand the choice m = 256 is admissible for most values of H when M = 60, 600 and 6000. 20
5. In extreme situations, for example H = 0.1, α = 0.5 (see Figure 4) no choice of the parameters m and M seems to be appropriate. Observe, however, that when α = 0.5, the quality of the paths improves, for all values of H and M when larger values of the mesh-parameter m are chosen. 6. The quality of the simulated paths seems not to improve significantly when “very large” values of the parameter M are chosen and when the parameter m is held fixed. Remarks 1. Since the complexity of the FFT-based simulation algorithm is O(m(M + N ) log2 (m(M + N ))) when m(M + N ) is an integer power of 2, we chose only dyadic values for the meshparameter m and for the sum N + M . 2. The time it takes to compute one path of the LFSM process of length N on a dedicated PC Pentium II (Deschutes) with CPU frequency 447.701 MHz, 770, 084 kilobytes of RAM and Red Hat Linux OS version 7.1 is approximately 77.63 seconds when m = 28 = 256, M = 6000 and N + M = 214 , that is N = 10, 384.
3.2
The case of fractional autoregressive moving average (FARIMA)
The FARIMA time series Y = {Y (k), k ∈ Z}, with parameter d > 0, defined in (2.32), can be used to model processes, which exhibit large fluctuations (heavy-tailed distributions) and also have strong dependence in time (long-range dependence) (see Sections 1 and 2.2 for more details). We present in this section a numerical study of the simulation algorithm for these time series, described in Section 2.2. As in Section 3.1 above, our main goal is to demonstrate how different choices of the truncation parameter M affect the precision of the simulated paths. Recall that the simulated paths YM = {YM (k), k = 1, . . . , N } of FARIMA defined in (2.37), are in fact moving averages of iid SαS (1 < α < 2) random variables. Thus, for all M ∈ N the generated approximate paths of FARIMA will have SαS marginal distributions, that is, heavy-tails (see Figure 2). We first consider the effect of block-averaging. To do so observe that the FARIMA time series Y = {Y (k), k ∈ Z} is asymptotically self-similar with Hurst parameter H = d + 1/α. That is, we have that, as N → ∞, [N t] o f.d.d. n X Y (j), t ≥ 0 −→ {CXH,α (t), t ≥ 0}, N −H
(3.5)
j=1
where XH,α (t), t ∈ R is the LFSM process defined in (2.1) and where C 6= 0 is a constant (see Astrauskas (1983) or Proposition 5.1 in Stoev and Taqqu (2003a), for example). The P interpretation of Relation (3.5) is two-fold. Firstly, since H < 1, (3.5) implies that P 0 = EY (j), that is the weak law of large numbers holds for the time N −1 N j=1 Y (j) → series Y . This fact also follows from the general result that the time series Y is ergodic (see Cambanis, Hardin and Weron (1984)). Secondly, one can get the rate of convergence of the block-wise averages B 1 X Y (k; B) = Y (j + kB), k ∈ Z B j=1
21
m = 16
α = 1.5, M = 60
m = 64
M = 6000
0.1
0.1
0.05
0.05
0.05
0
0
0
−0.05
−0.05
−0.05
−0.1
H=0.2 H=0.4 H=0.6 H=0.8
−0.1
H=0.2 H=0.4 H=0.6 H=0.8
−0.1
0.1
0.1
0.1
0.05
0.05
0.05
0
0
0
−0.05
−0.05
−0.05
−0.1
m = 256
M = 600
0.1
H=0.2 H=0.4 H=0.6 H=0.8
−0.1
H=0.2 H=0.4 H=0.6 H=0.8
−0.1
0.1
0.1
0.1
0.05
0.05
0.05
0
0
0
−0.05
−0.05
−0.05
−0.1
H=0.2 H=0.4 H=0.6 H=0.8
−0.1
H=0.2 H=0.4 H=0.6 H=0.8
−0.1
H=0.2 H=0.4 H=0.6 H=0.8
H=0.2 H=0.4 H=0.6 H=0.8
H=0.2 H=0.4 H=0.6 H=0.8
bW T ) − H Figure 3: This figure contains approximate 95%-confidence intervals for the bias E(H b of the wavelet estimators HW T . These confidence intervals were computed by using samples of n = 256 independent replications of the estimators, obtained from 256 independently simulated paths of the LFSM process with α = 1.5. The values of H are H = 0.1, 0.2, . . . , 0.9 (note that H − 1/α ≈ H − 0.67, so that H = 0.7, 0.8 and 0.9 correspond to long-range dependence). The values of the discretization parameters m and M , used in the simulation algorithm, are indicated in the margins of the figure. Plots in the same row involve equal values for the parameter m and for those in the same column we used the same values for the parameter M , respectively. Observe that the scales on all nine plots are equal.
22
m = 16
α = 0.5, M = 60
m = 64
M = 6000
0.3
0.3
0.3
0.2
0.2
0.2
0.1
0.1
0.1
0
0
0
−0.1
−0.1
−0.1
−0.2
H=0.2 H=0.4 H=0.6 H=0.8
−0.2
H=0.2 H=0.4 H=0.6 H=0.8
−0.2
0.3
0.3
0.3
0.2
0.2
0.2
0.1
0.1
0.1
0
0
0
−0.1
−0.1
−0.1
−0.2
m = 256
M = 600
H=0.2 H=0.4 H=0.6 H=0.8
−0.2
H=0.2 H=0.4 H=0.6 H=0.8
−0.2
0.3
0.3
0.3
0.2
0.2
0.2
0.1
0.1
0.1
0
0
0
−0.1
−0.1
−0.1
−0.2
H=0.2 H=0.4 H=0.6 H=0.8
−0.2
H=0.2 H=0.4 H=0.6 H=0.8
−0.2
H=0.2 H=0.4 H=0.6 H=0.8
H=0.2 H=0.4 H=0.6 H=0.8
H=0.2 H=0.4 H=0.6 H=0.8
Figure 4: This is obtained as Figure 3. It contains approximate 95%-confidence intervals for the b F IRT ) − H of the FIRT estimators H b F IRT . These confidence intervals were computed bias E(H by using samples of n = 256 independent replications of the estimators, obtained from 256 independently simulated paths of the LFSM process. Observe that now the index of stability α = 0.5 and that the scales on all nine plots are equal. Since α < 1, all cases correspond to negative dependence H < 1/α.
23
to the mean EY (j) = 0. Indeed, (3.5) implies ³ ´ d B 1−H Y (k; B) − 0 −→ ξ, as B → ∞,
(3.6)
where ξ is a non-trivial SαS random variable. If Y (j) were independent we would have ³ ´ d B 1−1/α Y (k; B) − 0 −→ ξ, as B → ∞. Since H = d + 1/α > 1/α, Relation (3.6) implies that the averages Y (k; B) converge, as B → ∞, more slowly to their mean EY (j) = 0 than averages of independent and identically distributed SαS random variables. This fact reveals the long-range dependence of the FARIMA time series Y . The Hurst parameter H is an indicator of the degree of long-term dependence of Y . We will show now that if we choose M too small, the approximations converge relatively fast to the mean EY (j) = 0, an indication that the approximated sequence is weakly dependent. We will contrast this behavior with what happens when M is chosen very large. In Figures 5 and 6, we simulate a FARIMA(0, d, 0) sequence with H = d + 1/α = 0.9 > 1/α, that is with long-range dependence. We approximate the sequence with M = 1000 and M = 220 . Figure 5 clearly indicates that a value of M = 1000 is insufficient when α = 1.5, since the blockwise averaged time series converge rapidly to the mean 0 and hence are rather weakly dependent. (This should be contrasted with the case M = 220 where the convergence to the mean occurs at a slower rate.) Figure 6 deals with the heavier-tailed situation α = 1.2. In this case, the previous method breaks down because the resulting graphs are similar and hence do not allow one to conclude that the choice M = 1000 is bad. The heavy-tailed nature of the simulated time series implies that in practice the convergence of averages of iid SαS random variables is relatively slow. Thus one needs to use a different method in order to distinguish between weakly and strongly dependent heavy-tailed time series. In the following analysis we use wavelet estimators for the Hurst parameter H = d + 1/α of the FARIMA time series to determine whether the value of the truncation parameter M is sufficiently large. P Consider the aggregated process X(n) = nj=1 Y (j), n ∈ N. Relation (3.5) suggests that one can estimate the Hurst parameter H = d + 1/α of the FARIMA time series by using the wavelet estimators for the self-similarity parameter of the LFSM process XH,α . Indeed, let b W T be the log-type wavelet estimator defined in (3.3). Under certain technical conditions, the H b W T is consistent (Proposition 4.1 in Stoev and Taqqu (2003b)) and asymptotically estimator H normal (Theorem 5.1 in Stoev and Taqqu (2003a)), as N → ∞ and as nj → ∞, j = 1, . . . , m. In practice, one uses the Mallat’s fast discrete wavelet transform algorithm and discards the first few smallest dyadic scales, which are impaired by the potential presence of non-trivial polynomials Φ(·) and Θ(·) in (2.32) of the FARIMA time series (for more details and a simulation study see Stoev and Taqqu (2003a)). In Figures 7 and 8, we present approximate 95% confidence intervals for the parameter H b W T (see (3.4)). The estimators computed from samples of n = 256 independent estimates H b HW T were computed from n independently generated paths YM (1), . . . , YM (N ), N = 220 of FARIMA(0, d, 0) and FARIMA(1, d, 1) time series. We used the Daubechies wavelet with 3 zero moments and dyadic scales 2j1 , 2j1 +1 , . . . , 2j2 , where j2 ≤ [log2 (N )] = 20 is the maximal available 24
B = 512
α = 1.5, H = 0.9, M=220 20
20
0
0
−20
−20
−40
−40 500
B = 2048
α = 1.5, H = 0.9, M=1000
1000
1500
2000
0
0
−10
−10
−20
B = 8192
200
300
400
500
100
2
2
0
0
−2
−2
−4
−4
−6
1500
2000
200
300
400
500
−6 20
40
60
80 100 120
20
0
0
−1
−1
−2
1000
−20 100
B = 32768
500
10
20
−2
30
40
10
60
80 100 120
20
30
P Figure 5: This figure contains graphs of block-wise averages YM (k; B) := B −1 B j=1 YM (j +kB), k = 0, 1, . . . , [N/B] − 1 for single paths of simulated FARIMA(0, d, 0), d = H − 1/α, time series of length N = 220 = 1, 048, 576. The first column of plots corresponds to a path with truncation parameter M = 220 , whereas the plots in the second column correspond to a path with M = 1000. Observe that the size of the blocks B is equal for plots in the same row and increases from the top towards the bottom rows. Note also that the vertical scales for plots in the same row are equal. We obtained the two paths by using the same sequence of iid SαS noise. We generated M +N = 221 such variables. In the case when M = 1000, we set N = 221 −M and truncated the time series to a length of 220 and in the case M = 220 we set N = 220 . Observe that the plots in the right column even-out more rapidly than the plots in the left column as the block-size B grows. This indicates that the path generated by using M = 1000 is rather weakly dependent and is not as good approximation to a FARIMA time series as the path with M = 220 .
25
B = 512
α = 1.2, H = 0.9, M=220
α = 1.2, H = 0.9, M=1000
0
0
−100
−100
−200
−200
−300
−300
B = 2048
500
1500
2000
20 0 −20 −40 −60 −80
500
200
300
400
500
100
0
0
−10
−10
−20
−20 20
B = 32768
1000
1500
2000
20 0 −20 −40 −60 −80 100
B = 8192
1000
40
60
80 100 120
20
0
0
−2
−2
−4
−4
−6
200
40
60
300
400
500
80 100 120
−6 10
20
30
10
20
30
Figure 6: This figure is obtained as Figure 5, that is, the plots on the left-hand side display blockwise averages of simulated FARIMA(0, d, 0), d = H −1/α, time series with M = 220 = 1, 048, 576 and length N = 220 . The plots on the right-hand side correspond to M = 1000. Here, however, the index of stability α is equal to 1.2. Thus the time series have heavier tails than the time series on Figure 6. (Note also the difference between the vertical scales on these two figures.) All four paths involved in Figures 5 and 6 were obtained by using the the same seed for the random number generator. Here in contrast with Figure 5 the left- and right-hand side plots are rather similar and one cannot conclude that the value M = 1000 is insufficient to obtain a good approximation to a FARIMA time series (see also Figure 7 and related comments).
26
dyadic scale in the data sets. The horizontal axes correspond to different choices of the smallest dyadic scale j1 . Observe that as j1 grows the estimators become less biased but their sample variances increase. This effect can be explained as follows. Firstly, by using larger scales one reduces the influence of the short-term dependence structure of the FARIMA time series on the estimators of the Hurst parameter (see also Figure 2 in Stoev and Taqqu (2003a) and the discussion therein). Secondly, the larger the scales the fewer wavelet coefficients are available. Thus estimators based on larger scales have greater sample variance than estimators based on lower scales. Now let us compare the simulated FARIMA time series in the cases when the truncation parameter M is equal to 220 and 1000, respectively. In the cases when M = 220 , we see on b W T tend to “stabilize” around the true value of the Hurst Figures 7 and 8 that the estimators H parameter H when j1 ≥ 7. On the other hand, in the cases when M = 1000, the bias of the bW T estimators continues to fluctuate as j1 grows. Moreover, when M = 1000, the estimators H tend to under-estimate the true value of H, for j1 ≥ 8. This observation can be explained by the fact that the simulated FARIMA time series YM , with M = 1000 are more weakly dependent than the time series generated with M = 220 and thus the former have effectively lower Hurst parameter. Recall that the results displayed in Figure 6 were inconclusive. In contrast, Figure 7 clearly indicates that a value of M = 1000 is not sufficient for generating precise approximations to FARIMA time series of length N = 220 . Furthermore, Figures 7 (where α = 1.2) and 8 (where α = 1.5) also suggest that the choice M = N = 220 provides relatively good approximations the FARIMA time series. Additional details about these figures are given in the remarks below. Remarks 1. Because the parameters φ = 0.9 and θ = 0.1 of FARIMA(1, d, 1) affect the lower scales, a significant bias appears at low values of j1 . This phenomenon is analyzed in detail in Stoev and Taqqu (2003a). 2. The weak dependence of the time series with M = 1000 becomes apparent as the lowest estimation scale 2j1 grows. In fact the estimators of H seem to stabilize around the value 1/α, since the confidence intervals on Figures 7 and 8 eventually center around 1/1.2 − 0.9 ≈ −0.0667 and 1/1.5 − 0.9 ≈ −0.2333, respectively (when j1 ≥ 13). 3. Consider Figures 7 and 8 in the cases when M = 1000. For relatively low values of j1 the estimated values of the Hurst parameter H appear to be very close to the true values of H = 0.9. More precisely, when j1 is in the range 4 ≤ j1 ≤ 8 in the cases of FARIMA(0, d, 0) and in the range 7 ≤ j1 ≤ 8 in the cases of FARIMA(1, d, 1) with φ = 0.9 and θ = 0.1, the corresponding confidence intervals for the bias are very close to zero. This can be explained as follows. Let us focus on FARIMA(0, d, 0), where we do not have to deal with the bias arising from the parameters φ and θ. Firstly, the dyadic scales 2j of order from 24 to 28 are relatively large and the corresponding wavelet coefficients DW T (2j , k) of the FARIMA time series scale very well, that is, they behave approximately like wavelet coefficients of an LFSM process. (Recall that the FARIMA time series considered here are asymptoticaly self-similar – see (3.5) above and Stoev and Taqqu (2003a) for more details.) Secondly, the truncation parameter M = 1000 ≈ 210 is greater than the dyadic 27
α = 1.2, H = 0.9, FARIMA(0,d,0), M=220
α = 1.2, H = 0.9, FARIMA(0,d,0), M=1000
0.1
0.1
0.05
0.05
0
0
−0.05
−0.05
−0.1
−0.1 5
j
10
15
5
1 20
15
FARIMA(1,d,1), φ=0.9, θ=0.1, M=1000
0.6
0.6
0.5
0.5
0.4
0.4
0.3
0.3
0.2
0.2
0.1
0.1
0
0
−0.1
−0.1 j1
10
1
FARIMA(1,d,1), φ=0.9, θ=0.1, M=2
5
j
10
15
5
j1
10
15
b W T ) − H of the Figure 7: We display here approximate 95% confidence intervals for the bias E(H b W T (see (3.3)). We computed these confidence intervals by using log-type wavelet estimator H b W T , obtained from n normal approximation, as in (3.4), from samples of n = 256 estimates H independently simulated paths of FARIMA time series. For the plots in the first column we used simulated FARIMA time series of length N = 220 and with truncation parameter M = 220 . For the plots in the second column we used parameters M = 1000, N = 221 − M and then we truncated the time series to a length of 220 . The vertical scales of the plots in the same rows are b W T (j1 ) are based on the equal. The horizontal axis of the plots is j1 . The wavelet estimators H j +1 j j 1 2 1 , . . . , 2 , where j2 ≤ 20 is the maximal available octave in the data. When dyadic scales 2 , 2 M = 1000, the ranges 4 ≤ j1 ≤ 8 and 7 ≤ j1 ≤ 8 work well in the cases of FARIMA(0, d, 0) and FARIMA(1, d, 1), respectively, but when M = 220 , j1 can take higher values.
28
α = 1.5, H = 0.9, FARIMA(0,d,0), M=220
α = 1.5, H = 0.9, FARIMA(0,d,0), M=1000 0.05
0.05 0
0
−0.05
−0.05
−0.1
−0.1
−0.15
−0.15
−0.2
−0.2
−0.25
−0.25 5
j
10
15
5
1 20
15
FARIMA(1,d,1), φ=0.9, θ=0.1, M=1000
0.6
0.6
0.4
0.4
0.2
0.2
0
0
−0.2
−0.2 j1
10
1
FARIMA(1,d,1), φ=0.9, θ=0.1, M=2
5
j
10
15
5
j1
10
15
Figure 8: This figure is obtained as Figure 7, now however the simulated FARIMA time series involve SαS innovations with α = 1.5. Observe that in this case the widths of the confidence intervals are comparable to the corresponding confidence intervals in Figure 7.
29
scales 24 to 28 and hence the approximation is good on these scales. Therefore the resulting estimators work well in the range 4 ≤ j1 ≤ 8. In the case of FARIMA(1, d, 1) with φ = 0.9 and θ = 0.1, the relevant range of scales is smaller because, as indicated above, bias is present at the lower range of the scale. 4. When M = 220 , the estimators are good when j1 ≥ 4 in the case of FARIMA(0, d, 0) and j1 ≥ 7 in the case of FARIMA(1, d, 1), a fact, consistent with the explanation above. Nevertheless, very large values of j1 should be avoided, because of the corresponding large variances. In practice, when estimating the Hurst parameter H, one should use the smallest possible, but adequate j1 . 5. The time it takes to simulate one path of a FARIMA(0, d, 0) time series with parameters M = N = 220 = 1, 048, 576 on a dedicated PC Pentium II (Deschutes) with CPU frequency 447.701 MHz, 770, 084 kilobytes of RAM and Red Hat Linux OS version 7.1 is approximately 36.59 seconds. This is in line with what we observed for LFSM (Remark 2 in Section 3.1), where one had twice as many operations (m(M + N ) = 222 ) which took twice as long to perform.
3.3
Conclusion
We summarise here the results from Sections 3.1 and 3.2. In the case of LFSM, the choice of the discretization parameters m and M , and especially, that of m is rather delicate. This choice depends on the values of the parameters H and α. When 0 < α ≤ 1, one should use significantly large values of m, especially in the cases for small values of H. On the other hand, when 1 < α ≤ 2, the choice of large values of m seems to be inappropriate when the parameter M is small, especially in the cases of negative dependence (0 < H < 1/α). The long-range dependence cases (1/α < H < 1) seem to be more robust with respect to the choice of the mesh-parameter m. When simulating FARIMA time series, one should use large values for the truncation parameter M in order to represent well the long-term dependence behavior of the time series, particularly when the Hurst parameter H = d + 1/α ∈ (1/α, 1) is close to 1. Choices of M greater or comparable to the length N of the simulated time series work well in most cases. The FFT-based algorithms presented in Sections 2.1 and 2.2 are computationally efficient. For example, the time required to generate an acceptable LFSM sequence of length N ≈ 10, 000 is about 1 minute and to simulate a FARIMA(0, d, 0) sequence of length N ≈ 106 is about 30 seconds. One can use these algorithms successfully in practice to generate significantly long paths, which represent well the dependence structures of the LFSM or FARIMA processes.
4
MATLAB code and illustration of how to use it
We provide here the MATLAB code for the simulation algorithms described in Section 2 and illustrate how to use it. The function fftlfsn(H,alpha,m,M,C,N,n) is used to generate linear fractional stable noise (with scaling constant C). For example, the commands H = 0.2; alpha =1.5; m = 256; M = 6000; N = 2^14 - M; y = fftlfsn(H,alpha,m,M,1,N,1); x = cumsum(y);
30
generate a simulated path y of length N of linear fractional stable noise and a path x of LFSM. The function fftfarima(alpha,d,n,Ph,Th,M,N) is used to generate FARIMA (where the vectors Ph and Th contain the coefficients of the polynomials Φ and Θ, characterizing the ARMA part of the time series). For example, the commands alpha = 1.2; d = 0.1; Ph = []; Th = []; M = 2^20; N = M; y0 = fftfarima(alpha,d,1,Ph,Th,M,N); Ph = [0.9]; Th = [0.2]; y1 = fftfarima(alpha,d,1,Ph,Th,M,N);
generate a sequence y0 of FARIMA(0, d, 0) with d = 0.1 (ie H = d + 1/α ≈ 0.93) and a sequence y1 of FARIMA(1, d, 1) with Φ(z) = 1 − 0.9z, Θ(z) = 1 − 0.1z and d = 0.1. Each MATLAB function is preceded by comments, describing its parameters. For brevity, we do not include the code for the functions rstab.m, d2.m and tan2.m, used to generate SαS variables. This code can be obtained on request from the authors of the present paper (see also Ch. 1.7 in Samorodnitsky and Taqqu (1994).) The software for estimation of the self-similarity parameter H can also be obtained from the authors. • Code for generating linear fractional stable noise function y = fftlfsn(H,alpha,m,M,C,N,n); % % This function generates LFSN (Linear Fractional Stable Noise) Y_k % % Y_k = K(H,alpha,C) \int_R (s)_+^d - (s-1)_+^d M(ds), d = H-1/\alpha % % by using a Riemann sum approximation of its stochastic integral % representation. The constant K(H,alpha,C) is chosen so that % ||Y(k)||_alpha = C, where C is an input parameter. % % input: % H