Transactions of the Korean Nuclear Society Autumn Meeting Pyeongchang, Korea, October 30-31, 2014
HRA Data Collection from the Simulations of Abnormal Situations Yochan Kim a, Jinkyun Park a, Wondea Jung a Korea Atomic Energy Research Institute 150, Dukjin, Yuseong, Daejeon, Korea * Corresponding author:
[email protected]
a
1. Introduction It is widely recognized that reliability of operators are critical to complex socio-technical systems [1]. For this reason, human reliability analysis (HRA), which aims to identify unsafe actions (UAs) that contribute to risks of the systems and assess the failure rates of the actions, has been conducted [2, 3]. Although many techniques of HRA have been developed and used in many years, many reports indicated lack of database for supporting empirical bases of HRA methods [1, 4]. Thus, there have been recent efforts to collect data about human reliability from plant experience, simulator experiment or qualification, and laboratory experiments [3]. As one of these efforts, KAERI also established a guideline to collect information about human reliability and performance shaping factors from simulators [5]. This guideline particularly presented a set of worksheets that allows comprehensively gathering objectively observable information in simulations of emergency situations. This paper reports the process and preliminary results of the data collection from the simulations of abnormal situations based on the developed worksheets in KAERI database guideline. We analyzed operator behaviors of the sixteen experiments for the two kinds of abnormal situations: RCP (reactor coolant pump) cyclone filter blockage and CDP (condensate pump) valve stuck. The UAs of operators were identified and quantified. 2. Data Collection Process
condensate polishing system. The operators should find out the cause of problem and request a local operator to open CDV200 within 10 minute. If necessary, the operators can cut reactor power back. The AOP for low flow of condensate tanks describes all actions to be conducted. For the scenario of RCP cyclone filter blockage, the cyclone filter after the high pressure cooler in RCP 1A seal injection flow was blocked. The operators should find out the cause of problem and trip the RCP 1A when the inlet temperature of seal coolers reaches the trip level. The AOP for loss of RCP seal describes various actions to be conducted for similar situations, but it does not describe any symptom and measure related to the blockage of the cyclone filter. From the sixteen simulations, the behaviors and communications of control room operators were recorded. In addition, the associated events such as manipulations or alarms annunciated and the process parameter such as pressure or temperature of important component were obtained.
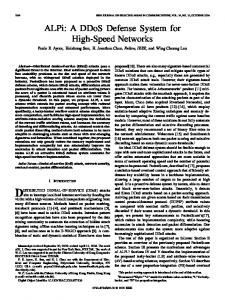
Generic HRA data items
Clarify objective and scope
Phase 1
Select (design) simulation scenario
Phase 2
Distinguish necessary HRA data items
Phase 3
Distinguish actually collectable HRA data items
Phase 4
Collect information from simulations
Phase 5
Analyze data
Phase 6
2.1 Simulation Data We analyzed the behaviors of operators in the main control room of an OPR 1000 under abnormal situations. The operation team of OPR 1000 consists of five operators: a shift supervisor (SS), reactor operator (RO), turbine operator (TO), electric operator (EO), and shift technical assistant (STA). When cues of abnormal situations were recognized, the operators should find out related abnormal operating procedures (AOPs) and follow the procedures to cope with the situations. If the operators aware urgency of the situations, they can also take rapid actions before following a procedure. The eight operation teams of OPR 1000 participated in the experiments for each scenario. For the scenario of CDP valve stuck, a situation of simultaneous closes of the valve (CDV201) before the condensate polishing system and the bypass valve (CDV200) of the
Fig. 1. The overall process to collect information for HRA data [5].
2.2 Worksheets and Analysis Process To accumulate qualitative HRA data, the obtained records were analyzed and converted to worksheets designed in the KAERI guideline. Fig. 1 shows the process to develop the HRA data worksheets. The worksheets were developed by following phase one to five of the process for ISLOCA (Interfacing System
Transactions of the Korean Nuclear Society Autumn Meeting Pyeongchang, Korea, October 30-31, 2014
Loss of coolant accident) scenario, an emergency situation. The worksheets include plant level information worksheet, timeline worksheet, and task level worksheet. The contents of the worksheets can be summarized by Table I.
level
information
UA type
Table I: Data Items of Worksheets [5] Work sheet Plant level
Category
Data item
UA Initiator
Plant & simulation overview
Plant/simulator name Plant type Operating mode Simulation date Ingress/injection time of initiating event Simulation completion time Crew/shift/team name Age Work experience of plant operation (yr) Work experience in current position/role (yr) Certified License Work experience in current team (yr) Simulator training frequency Training experience on the scenario Simulation environment
Plant/ system state
Crew (…)
Training & education Environmen t Observed response Scenario
Crew characteristi cs and dynamics
Time line
Contents of communicat ion Action log Procedure & Task
UA
Task
UA
Observed procedural path Simulation mode Initiating event Multiple initiating events Failed system or component Failed/masked alarm or indicator Scenario/event summary Expected Procedural path Allowable time Leadership of SS Cooperative attitude Supervising level of STA Independent checker Procedure compliance Communication level Start time of utterance End time of utterance Operating personnel Utterance Related action log Related procedure Related step Responsible person of step Task type Component type UA candidate Code of UA or recovery Related UA/recovery (Situation) Description UA code
Time pressure Task familiarity Task complexity (diagnosis)
Task complexity (execution) Procedure quality (clarity) Procedure quality (description) HMI & Information quality Communicat ion quality
Recovery information
UA overall description UA effect Related UA/Recovery Code Recovered UA Recovery timing Reporting UA Instruction UA Manipulation UA UA performer Related operator (causality) Failed system/ component Failed alarm/ indicator/display Failed switch/controller Time pressure Task familiarity UA occurred during the performance of a contingency action part The type of state identification Note or caution Change of procedure strategy Procedure conformity Number of detailed instructions Number of manipulations Component manipulation mode Continuous action step Confusing statement Multiple constraints Clarity of decision-making criteria Description of object Specification of means Information clarity Feedback information Procedure compliance Precise instruction Controversial expression Standard terminology Communication level Reporting omission Recovery code Recovery description Recovery worker Time to recovery Recovery cue Recovery Initiator
Using the worksheets, the data items of the plant level worksheet and the data items in communication contents, action log, and procedure & task of the timeline worksheet were obtained, first. All kinds of deviations were then extracted by comparing communication contents, actions log, process parameter data and procedures. The UAs were determined among the deviations by considering rationales of human behaviors such as procedures, the expert judgment, the thermalhydraulic analyses, success criteria used in the PSA, and the status of CSFs. The identified UAs were then
Transactions of the Korean Nuclear Society Autumn Meeting Pyeongchang, Korea, October 30-31, 2014
investigated in detail and the task level worksheet was written for each UA. Some instructions in AOPs were not explicitly represented; hence, to analyze the simulations of abnormal situation based on the worksheets, which were developed for proceduralized processes, the related AOPs were formalized to be analyzed. The instructions of AOPs were distinctly numbered and the recognition of significant alarms and search of proper procedures were supplemented to the early tasks of the instructions. 2.3 Taxonomy of UAs The taxonomy of UAs was defined to quantify the frequency of UAs. Because the purpose of data collection is to support HRA, some HRA techniques such as THERP [6], ASEP [7], K-HRA [8], SPAR-H [9], HEART [10], HCR [11], Phoenix [12] and CBDT [13] and existing HRA databases such as operating experience data by GRS[4] and CORE-DATA [14] were reviewed. By considering the taxonomy of human error in these references, the taxonomy that is based on the structure of crew failure modes in the Phoenix method [12] and reflects generic task characteristics like THERP and ASEP method [6, 7]. Table II shows taxonomy of UAs. Table II: Taxonomy of UAs UA types Failure of information gathering and reporting – checking discrete state (omission error, commission error) Failure of information gathering and reporting – measuring parameter (omission error, commission error) Failure of situation assessment and instruction (omission error, commission error) Failure of diagnosis (omission error, commission error) Failure of manipulation – omission error
Failure of manipulation – wrong device
Failure of manipulation – wrong direction
Failure of communicating to external agent (omission error, commission error) Unauthorized control
Task type Alarm Indicator Synthetically evaluation Reading simple value Comparison of parameter Evaluating trend Transferring procedure Operating control Communicating Two-position control Rotary control A set of sequential operation Dynamic Two-position control Rotary control A set of sequential operation Dynamic Two-position control Rotary control A set of sequential operation Dynamic -
-
3. Probability of UAs Based on the taxonomy of UAs, the probabilities of UAs were estimated by the following equation [2].
. Here, ni is the frequency of UAs observed in situations of UA type i, mi is the number of the total possible situations of type i, and 0i is the frequency of situations of type i where no UA is observed. The examples of obtained probabilities are shown in Table III. The fourth column shows the probabilities presented in the human error probability in THERP database in similar situations or contexts in the given UA type. To easily compare the probabilities in this study with in THERP [6], total 0i and ni for task types in some UA types were calculated as well. Table III: Examples of Obtained Probabilities UA
0i
Failure of information gathering and reporting(commission) – 175 (total: checking & measuring) Failure of information gathering and reporting(commission) – 112 checking discrete state (total) Failure of information gathering and reporting(commission) – 72 checking discrete state(alarm) Failure of information gathering and reporting(commission) – 40 checking discrete state(indicator) Failure of information gathering and reporting(commission) – 63 measuring parameter (total) Failure of information gathering and reporting(commission) – 63 measuring parameter (comparison) Failure of information gathering and reporting(omission) –(total: 175 checking & measuring) Failure of manipulation – wrong 26 device (total)
ni
PUA
THERP
1
0.006
~0.004
0
0
~0.003
0
0
–
0
0
–
1
0.016
~0.005
1
0.016
–
0
0
–
0
0
~0.0005
4. Conclusion Because the number of simulations was limited and data of various situations will be obtained continuously, it is uncertain to conclude the resulted probabilities. However, in this study, it was revealed that the designed worksheets were feasible to collect HRA data, especially in abnormal situations. The defined taxonomy of UAs was unambiguous to distinguish actions of operators and quantify the probabilities. Based on the worksheet, operator behaviors in many different kinds of scenarios will be analyzed and the relations between
Transactions of the Korean Nuclear Society Autumn Meeting Pyeongchang, Korea, October 30-31, 2014
human reliabilities and the observed factors will be also investigated. REFERENCES [1] V. D. Pasquale, R. Lannone, S. Miranda, S. Riemma, an overview of human reliability analysis techniques in manufacturing operations, In M.M. Schiraldi (Ed), Operations Management, InTech, 2013. [2] O. Sträter, H. Bubb, Assessment of human reliability based on evaluation of plant experience: requirements and implementation, Reliability Engineering and Systems Safety, 63, 199-219, 1999. [3] Y. Kim, J. Park, W. Jung, A Survey of Data-based Human Reliability Analysis Approaches, The 1st Asian Conference on Ergonomics and Design (ACED 2014), 2014, Jeju, Korea. [4] W. Preischl, and M. Hellmich, , Human error probabilities from operational experience of German nuclear power plants, Reliability Engineering and Systems Safety, 109, 150-159, 2013. [5] J. Park, W. Jung, S. Kim, S. Choi, Y. Kim, S. Lee, V.N. Dang, A guideline to collect HRA data in the simulator of nuclear power plants, KAERI/Technical Report-5206, 2013. [6] A. D. Swain, H. E. Guttmann, Handbook of human reliability analysis with emphasis on nuclear power plant applications, NUREG/CR-1278. Washington, DC: Sandia National Laboratories, 1983. [7] A. Swain, Accident Sequence Evaluation Program Human Reliability Analysis (ASEP HRA) Procedure, NUREG/CR4772, US NRC, 1987. [8] W. D. Jung, D. I. Kang, J. W. Kim, Development of a standard method for HRA of nuclear power plants - Level I PSA full power internal HRA, KAERI/TR-2961/2005, 2005. [9] D. Gertman, H. Blackman, J. Marble, Byers, C. Smith, The SPAR-H human reliability analysis method, NUREG/CR6883. Idaho National Laboratory, prepared for U. S. NRC, 2004. [10] J. C. Williams, HEART - A Proposed Method for Assessing and Reducing Human Error, Proceedings of the 9th Advances in Reliability Technology Symposium, University of Bradford, 1986. [11] G. Hannaman, A. Spurgin, Y. Lukic, Human Cognitive Reliability (HCR) Model for PRA Analysis, Draft Report, NUS-4531, EPRI Project, 2170-3, 1984. [12] A. Mosleh, S. H. Shen, D. L. Kelly, J. H. Oxstrand, K. Groth, A Model-Based Human Reliability Analysis Methodology, In Proceedings of the International Conference on Probabilistic Safety Assessment and Management (PSAM 11), Helsinki, Finland, 2012. [13] G.W. Parry, A.N. Beare, A.J. Spurgin, P. Moieni, An approach to the analysis of operator actions in probabilistic risk assessment, EPRI TR-100259, 1992. [14] B. Kirwan, G. Basra, S. E. Taylor-Adams, COREDATA: a computerised human error database for human reliability support, Proceedings of the 1997 IEEE Sixth Conference on Global Perspectives of Human Factors in Power Generation, (pp.9/7-9/12), Florida, Jun 1997.