The parameterization of. Harrington and Kreidenweis was used for our comparative evaluation. Simulation Results. Our comparative evaluation focuses on the.
Aerosol Science and Technology 31:487 ] 514 s 1999 . Q 1999 American Association for Aerosol Rese arch Published by Taylor and Francis 0278-6826 r 99 r $12.00 q.00
Simulation of Aerosol Dynamics: A Comparative Review of Algorithms Used in Air Quality Models Yang Zhang*, Christian Seigneur, John H. Seinfeld, Mark Z. Jacobson, and Francis S. Binkowski ATMO SPHERIC & ENV IRONMENTAL RESEARCH, INC., 2682 BISHOP DRIV E, SUITE 120, SAN RAMON, CA 94583 s Y.Z., C.S.. , CALIFORNIA INSTITUTE OF TECHNOLOGY 1200 E. CALIFORNIA BLV D., MAIL CODE 104-44 , PASADENA, CA 91125 s J.H.S.., STANFO RD UNIV ERSITY, DEPARTMENT OF CIV IL AND ENVIRO NMENTAL ENGINEERING, STANFORD, CA 94305 s M.Z.J.. , NATIO NAL OCEANIC AND ATMOSPHERIC ADMINISTRATION, ON ASSIGNMENT TO THE U.S. ENV IRONMENTAL PROTECTIO N AGENCY, ATMO SPHERIC MO DELING DIV ISION s MD-80. , NATIO NAL EXPO SURE RESEARCH LAB, U.S. EPA, RESEARCH TRIANGLE PARK, NC 27711 s F.S.B..
ABSTRACT. A comparative review of algorithms currently used in air qu ality models to simulate aerosol dynamics is presented. This review addresses coagulation, condensational growth, nucleation, an d gas r particle mass transfer. Two major approaches are used in air qu ality models to represent the particle size distribution: ( 1) the sectional approach in wh ich the size distribution is discretized into sections and particle properties are assumed to be constant over particle size sections and ( 2) the modal approach in wh ich the size distribution is approximated by several modes and particle properties are assumed to be uniform in each mode. The section al approach is accur ate for coagulation an d can reproduce the major ch aracteristics of the evolution of the particle size distribution for condensational growth with the moving-center an d hybrid algorithms. For coagulation and condensation al growth, the modal approach provides more accurate results when the standard deviations of the modes are allowed to vary than it does when they are ® xed. Predictions of H 2 SO4 nucleation rates are highly sensitive to environ mental variables and simulation of relative rates of condensation on existing particles and nucleation is a preferable approach. Explicit treatment of mass transfer is recommended for cases where volatile species undergo different equilibrium reactions in different particle size ranges ( e.g., in the presence of coarse salt particles ) . The results of this study provide useful information for use in selecting algorithms to simulate aerosol dynamics in air qu ality models and for improving the accuracy of existing algorithms.
*Corresponding author.
488
Y. Zhang et al.
INTRODUCTION Air quality regulations for ambient levels of particulate matter s PM. and regional haze require relating sources of emissions of PM and PM precursors to PM levels and visibility degradation. To that end, three-dimensional s 3-D. air quality models of PM have been developed that contain comprehensive treatment of transport processes, gasphase chemistry, gas r particle partitioning, and aerosol dynamics s Seigneur et al. 1999.. These models differ in their treatment of these various atmospheric processes, and it is of interest to assess to what extent differences in model formulations may affect model predictions. We focus here on the algorithm s that are used to simulate aerosol dynamics, i.e., those processes that govern the evolution of the particle size distribution. The relevant aerosol dynamic processes include coagulation, condensational growth s or shrinkage due to volatilization ., nucleation, and mass transfe r from the bulk gas phase to the particle surface. We review the algorithm s that are currently used in the following 3-D PM air quality models: CIT s Meng et al. 1998., GATOR s Jacobson 1997a., Models-3 r CMAQ s Binkowski and Shankar 1995; Binkowski 1998., SAQMAERO s Dabdub et al. 1998., UAM-AERO s Lurmann et al. 1997., and UAM-AIM s Sun and Wexler 1998.. First, we present an overview of the 2 major approaches used to represent the particle size distribution in PM air quality models: the sectional approach and the modal approach. Next, we present our comparison of algorithms used to simulate the 4 dynamic processes listed above. Finally, concluding remarks and recommendations for the selection and improvements of aerosol dynamics algorithms are provided.
REPRESENTATION OF THE PARTICLE SIZE DISTRIBUTION Several approaches can be used to represent the particle size distribution in an at-
Aerosol Science and Technology 31:6 December 1999
mospheric model. The 3 major approaches include continuous representation, sectional representation, and parameterized modal representation. The continuous representation assumes a continuous size spectrum. The aerosol dynamic equations are solved using the ® nite element methods s e.g., Varoglu and Finn 1980; Tsang and Brock 1986; Tsang and Huang 1990., which provide the most accurate solution. A number of numerical modules based on a continuous representation have been developed to simulate changes in the particle size distribution including COAGUL s Suck and Brock 1979. and CONFEMM s Tsang and Brock 1983.. However, the aerosol dynamic modules with a continuous size representation are computationally demanding and are not currently used in 3-D air quality models. Here will use modules based on this approac h s e.g., COAGUL for coagulation and CONFEMM for condensation. as a benchmark to which other approaches are compared. The sectional representation is used in several air quality models including CIT, GATOR, SAQM-AERO, UAM-AERO, and UAM-AIM. In the sectional approach, the particle size distribution is approximated by a discrete number of size sections s Gelbard and Seinfeld 1980; Gelbard et al. 1980.. This discretization can be conducted based on number, surface area, or volume s or mass., depending on the particle characteristics of interest. For example, Wu et al. s 1996. showed that the optical characteristics of particles are better approximated if the discretization is conducted according to the particle surface area rather than the particle volume. Because air quality models are generally designed to conserve mass, the sectional representation of the particle size distribution used in PM models is based on the mass distribution of particles. One must note that if mass is transferred between size sections, only 1 characteristic is conserved when all processes s i.e., coagulation and gas-to-particl e conversion. are
Aerosol Science and Technology 31:6 December 1999
simulated. For example, if the sectional representation is expressed to conserve mass, then the number distribution will not satisfy the dynamic equation. The mass size distribution is expressed in the sectional representation as follows. Ql s t . s
xl
Hx
q s x, t . dx,
l s 1, . . . , L, s 1.
where q s x, t . is the mass size distribution, x is the logarithm of the particle diameter, t is the time, l is the section number, L is the total number of size sections, and Q l is the particle mass in size section l. In the parameterized representation, the particle size distribution is approximated by several analytical functions s generally lognormal distributions. that represent the various modes of the particle population. This modal approach is used in Models-3, where the particle size distribution is represented by 3 modes, each mode being approximated by a log-normal distribution. These 3 modes are an Aitken nuclei mode, an accumulation mode, and a coarse mode. The log-normal approximatio n allows one to simulate the evolution of both the number and volume s or mass. distributions. The number distribution n s d, t . based on particle diameter d is represented as follows: Nn s t . s 2p . 1
r2
Nc s t . s 2p . 1
r2
= exp y
log w s c x
t
1 2
log d r d Ncs t . log w s c x
/
2
,
where the subscripts n, a, and c refer to the Aitken nuclei, accumulation, and coarse modes, respectively; Nn , Na , and Nc represent the total aerosol number concentrations in each mode; d N n , d N a , and d Nc represent the geometric mean particle diameters; and s n , s a , and s c are the standard deviations of each mode. In the original formulation of the modal representation, both the geometric me an particle diameters and the standard deviations were allowed to vary with time s see Seigneur et al. 1986; Whitby and McMurry 1997.. In the original Models-3 formulation, the standard deviations are constant s Binkowski 1998.. Similarly, the volume distribution is represented as follows: V s d , t. s
s t.
s 2p .
q
t
log d r d Nns t .
1
log w s n x
2
/
2
s 2p . 1
r2
= exp y
log w s a x
1 2
t
log d r d Nas t . log w s a x
/
2
log w s n x
t
log d r d Vns t .
1
log w s n x
2
/
2
s t.
s 2p .
Va 1 r2
= exp y
q
Na s t .
Vn 1 r2
= exp y
log w s n x
= exp y
q
q
s 2.
ly 1
n s d , t. s
489
Simulation of Aerosol Dynamics
log w s a x
t
log d r d Vas t .
1
log w s a x
2
/
2
s t.
s 2p .
Vc 1 r2
= exp y
log w s c x
1 2
t
log d r d Vcs t . log w s c x
/
2
, s 3.
490
Aerosol Science and Technology 31:6 December 1999
Y. Zhang et al.
where Vn , Va , and Vc represent the total particle volumes in each mode and d Vn , d Va , and d Vc represent the geometric me an particle diameters.
SIMULATION OF COAGULATION Formulation of the Coagulation Algorithm s We compare 2 different approache s that are used in 3-D air quality models to simulate coagulation. The sectional approac h is used in several 3-D air quality models for particulate matter; however, only 1 of these models, GATO R, tre ats coagulation s Seigneur et al. 1998.. The modal approach is used in Models-3. In the sectional approach, the coagulation equation is expressed as follows s Gelbard et al. 1980.: dQ l s t . dt
Ly 1
s
p
b
a
i , ly 1 Q i
s t . Q ly 1s t .
is 1 L
y
p
b
b
i, l Q i
s t . Ql s t. ,
is 1
l s 1, . . . , L.
s 4.
The ® rst term represents the formation of new particles in section l by coagulation of particles from lower sections, and the second term represents the coagulation of particles from section l with other particles to form particles in higher sections. The seca tional coagulation coef® cients b i, ly 1 and b b i, l are calculated by integrating the coagulation coef® cient b s x1 , x2 . over the sections of interest. s See Gelbard et al.s 1980. for the derivation of the sectional coagulation coef® cients.. The advantag e of this sectional method is that for a ® xed representation of the aerosol size distribution s i.e., with ® xed size sections., the sectional coagulation coef® cients are integrated only once and the coagulation equation is then reduced from an integro-differential
equation to a set of ordinary differential equations. In the modal representation, the coagulation equations consist of a set of 6 ordinary differential equations for the total number and volume concentrations of each mode. The coagulation coef® cients used in the Models-3 formulation are described in Appendix A1 of Binkowski and Shankar s 1995 .. Simulation Results We evaluate each approach with respect to an accurate numerical solution of the coagulation dynamic equation. This accurate solution was obtaine d using the model COAGUL s Suck and Brock 1979.. Seigneur et al. s 1986. evaluated the sectional approach and an earlier version of the modal approach against COAGUL. Since no modi® cations have been made to the fundamental equations for the sectional approach, we simply summarize the results presented by Seigneur et al. s 1986.. An evaluation of the revised modal approach s i.e., as used in Models-3. is presented and its performance is compared to those of the sectional approach and an earlier version of the modal approach. Three scenarios were considered with initial particle size distributions typical of clear, hazy, and polluted urban conditions. The characteristics of these particle size distributions are presented in Table 1. The total PM mass concentrations s assuming a particle density of 1.8 g cm y3 . are 11, 57, and 126 m g m y3 for clear, hazy, and urban conditions, respectively. Simulations were conducted for 12 h for the 3 types of atmospheric conditions. As shown by Seigneur et al. s 1986., little coagulation takes place under clear and hazy conditions. Consequently, we discuss here primarily the results of the simulation of urban conditions, since this simulation
Aerosol Science and Technology 31:6 December 1999
Simulation of Aerosol Dynamics
TABLE 1. Initial log-norm al size distributions used in the aerosol dyn amics model simulation s ( after Seigneur et al. 1986) . Conditions Param eter
a
Me an diameter s m m. dn da dc Standard deviation sn s a sc Total volume s m m3 cmy 3 . Vn Va Vc
Clear
Hazy
Urban
0.03 0.2 6.0
0.044 0.24 6.0
0.038 0.32 5.7
1.8 1.6 2.2
1.2 1.8 2.2
1.8 2.16 2.21
0.03 1.0 5.0
0.09 5.8 25.9
0.63 38.4 30.8
a
Subscripts n, a, and c refer to nuclei, accumulation, and coarse modes, respectively.
represents the most stringent test for coagulation algorithms. Figure 1 shows the initial particle size distributions and the particle size distributions simulated after 12 h for urban conditions by COAGUL s i.e., the ``exact’’ solution., the sectional approach using 12 sections between 0.001 and
491
10 m m, and the modal approach as it is formulate d in Models-3. The sectional approach appears to be fairly accurate . The absolute error averaged over the entire size distribution was at most 3% s Seigneur et al. 1986.. The computational burden associate d with the sectional simulation of coagulation can be managed effectively by using noniterative numerical techniques s e.g., Jacobson and Turco 1995.. Because the Models-3 formulation assumes ® xed standard deviations, the evolution of the particle size distribution is characterized by a shift of the accumulation mode toward larger particle sizes. For example, we see in Figure 1 that the accurate numerical solution of COAGUL does not show any signi® cant shift in the me an particle diameter of the accumulation mode but, rather, shows a decrease in the standard de viation of the accumulation mode. Therefore, the assumption of ® xed standard deviations in the Models-3 formulation forces an evolution of the particle size distribution undergoing coagulation that is
FIGURE 1. Simulation of coagulation for urban conditions, p article volume distributions, initially and after 12 h.
492
Aerosol Science and Technology 31:6 December 1999
Y. Zhang et al.
FIGURE 2. Simulation of coagulation for urban conditions, particle number distributions, initially and after 12 h.
not consistent with the evolution calculated with an accurate solution of the coagulation equation. Figure 2 shows the evolution of the number distribution for the urban simulation. The COAGUL simulation shows a signi® cant depletion of particles below 0.01 m m, whereas the Models-3 simulation shows a number distribution that is wider with nonnegligible numbers of particles below 0.01 m m. We calculated the average absolute error over the diameter range of 0.1 ] 2.15 m m s see Table 2.. The errors were 3, 35, and 18% after 12 h of simulation for the sec-
tional formulation, the Models-3 modal formulation, and the original modal formulation of E. Whitby s as described in Seigneur et al. 1986., respectively. The latter modal formulation used a variable standard deviation for all the modes, whereas the Models3 formulation uses a ® xed standard deviation. Therefore, the constraint of using a ® xed standard deviation leads to larger error. The computational time for a 12 h simulation using Models-3 on a Compaq Deskpro 2000 with 64 MB RAM is - 1 CPU s. The sectional and the exact approaches require a signi® cantly longer CPU time, rang-
TABLE 2. Comp arison of simulation results for coagulation . a Average absolute normalized error ( %) Model Sectional formulation Modal formulation of Models-3 Modal formulation of E. Whitby a
Clear
Hazy
Urban
1 2 2
1 3 2
3 35 18
COAGUL was used as the reference s i.e., the ``exact’’ solution.. The error was calculated over the diameter range 0.1 ] 2.15 m m.
Aerosol Science and Technology 31:6 December 1999
Simulation of Aerosol Dynamics
ing from 40 ] 350 CPUs and 100 ] 1000 CPUs, respectively, for various cases.
SIMULATION OF CONDENSATIONAL GROWTH Formulation of the Condensational Growth Algorithms We compare 4 different approache s that are used in 3-D air quality models to simulate the growth of particles due to condensation of gas-phase species. These 4 approaches can be groupe d into 2 major categories according to their representations of the particle size distribution: sectional or modal. In the original applications of the sectional representation, the condensation equation was expressed as follows s Gelbard and Seinfeld 1980; Seigneur 1982.: dQ l s t . dt
s af l Q l s t . qbf
ly 1 Q ly 1
y bf l Q l s t . ,
s t.
l s 1, . . . , L, s 5 .
where the second term is not evaluated for l s 1. The ® rst term represents the growth of the aerosol volume in section l due to condensation; the second term represents the growth of the aerosol volume from section s l y 1. into section l; and the third term represents the growth of the aerosol volume from section l into section s l q1.. The sectional condensation growth terms are calculated from the growth law and the sectional representation. For example, a
f
ls
Ql xl y xly 1
xl
Hx
ly 1
f n
dx,
s 6.
where f is the growth law s i.e., d v r dt. and v is the particle volume. These sectional condensation coef® cients are calculated once for a sectional representation that is ® xed with respect to particle diameter. Seigneur et al. s 1986. evaluate d the sectional approach and concluded that in its
493
original implementation s Gelbard and Seinfeld 1980; Seigneur 1982., it is subject to signi® cant numerical diffusion. Using 12 size sections in the particle diameter range between 0.001 and 10 m m, the average absolute error for the ® ne particle size distribution could be as much as 35% . When 3 times as many size sections were used, the error could be reduced to 12% , however, the computational cost increased by a factor of 3. This approac h is not currently used in 3-D air quality models, although it is still used in 2-D plume models s Hudischewskyj and Seigneur 1989; Seigneur et al. 1997.. Several attempts have been made to minimize numerical diffusion, and the 3 approache s that are currently used in 3-D air quality models can be described as follows. The exact solution to the condensation equation can be obtaine d by the method of characteristics. For a sectional representation of the size distribution, it corresponds to allowing the boundarie s of the size sections to grow at a rate consistent with the growth law. Thus, the only error in the solution is limited to the error due to the discretization s sectionalization . of the particle size distribution. This approach will be referred to as the full-moving approach, since the entire sectional representation of the particle size distribution moves in the particle diameter space as condensation occurs. However, this approach cannot be used in a 3-D air quality model where it is necessary that the particle size distribution in all grid cells be represented by the same particle size discretization; i.e., the size section boundaries must be ® xed. One approach that has been implemented in some air quality models s e.g., UAM-AERO and SAQM-AERO. takes advantage of the full-moving approach while maintaining the constraint that the particle size sections remain ® xed when simulating 3-D processes s Lurmann et al.
494
Y. Zhang et al.
1997.. For small time steps, the effect of condensation on the particle size distribution is solved using the full-moving approach. Then, at speci® ed larger time steps for which transport processes s advection and diffusion., emissions, and deposition take place, the new particle size distributions are redistribute d according to the original particle size representation. The redistribution can be done by assuming that the particle volume distribution is constant within each size section or by ® tting the sectional distribution by a continuous distribution prior to its redistribution among the original particle size representation. The latter approac h is used in UAM-AERO and SAQM-AERO . Some numerical diffusion takes place at that point. This approach will be referred to as the hybrid approach, since it combines the full-moving approach with the ® xed size sectional representation. s It differs, however, from the hybrid method used by Jacobson and Turco w 1995x .. Another approach that has been implemented in some air quality models s e.g., CIT and UAM-AIM. consists of using a numerical integration scheme that minimizes numerical diffusion when solving the condensation equation. The condensation equation is a hyperbolic partial differential equation that is mathematically similar to the advection equation. Discretizing the particle size distribution in size sections is equivalent to discretizing a modeling domain with a grid. Therefore, numerical schemes that have been developed to solve the advection equation with minimal numerical diffusion can be used to solve the condensation equation. The numerical scheme developed by Bott s 1989. has been considered fairly effective for minimizing numerical diffusion and has been used to solve the condensation equation s Dhaniyala and Wexler 1996.. We will refer to this
Aerosol Science and Technology 31:6 December 1999
approac h as the Bott’s approach, based on the numerical scheme being used. Finally, one approach that has been implemented in GATOR takes advantage of the method of characteristics within the ® xed size representation s Jacobson 1997b.. In this approach, the mass of each particle size section is assigne d to a single particle size. This particle size is then allowed to grow as condensation occurs. When this particle size grows out of the section, all particles of that section are transferred into the next section. A new particle size is calculated for that next section by averaging the particle sizes of the particles previously in the section and of those newly transferred. Thus, numerical diffusion is minimized overall. However, in a 3-D model, several particle size distributions are mixed through transport processes and emissions. In that case, an average diameter must be calculated for the size section. The new diameter is calculated as a volume average of the diameters of the various particle populations s e.g., the initial particle population in the grid cell as modi® ed via aerosol dynamic processes and removal processes, particles advected or dispersed from upwind sources, and new emitted particles.. At that point, some error occurs due to the averaging process. The modal approach is used in Models-3. Three modes are used to represent the particle size distribution, but condensation on the coarse mode is assumed to be negligible. The condensation equations consist of a set of 4 ordinary differential equations for the total number and volume concentrations of the nuclei and accumulation modes. The calculation of the condensational growth coef® cients used in the Models-3 formulation is described in Appendix A1 of Binkowski and Shankar s 1995.. In the Models-3 formulation, condensation on the nuclei mode is solved together with the nucleation and coagulation terms.
Aerosol Science and Technology 31:6 December 1999
The mathematical formulation is such that if nucleation and coagulation are set to 0, no condensation occurs on the nuclei mode; we refer to this version as Models-3 s EPA1.. To circumvent this problem, we used 2 approaches. First, we rewrote the computer code of Models-3 to allow condensation on the nuclei mode using the mathematical formulation of Models-3 for condensational growth; we refer to this version as Models-3 s AER.. Second, we conducted the calculations including condensation and coagulation; we refer to this version as Models-3 s EPA2.. However, this approach can only be used for cases where coagulation does not signi® cantly affect the particle size distribution. Therefore, the implementation referred to as Models-3 s AER. should be the most representative of the formulation of condensation in Models-3. It will be used here in our comparison of the Models-3 modal algorithm with other condensation algorithms. A brief comparison of the 3 implementations described here s i.e., AER, EPA1, and EPA2. will also be presented. Simulation Results We evaluate each algorithm with respect to an accurate numerical solution of the condensational growth equation. This accurate solution was obtained using the full-moving approach with a large number s 500. of size sections for the particle diameter range between 0.001 ] 10 m m. Allowing the section boundaries to move eliminates numerical diffusion. This technique cannot be used in a 3-D air quality model as described before. It is, however, appropriate here since we are conducting simulations for a single grid cell. The accuracy of the solution was veri® ed by repeating the simulation with twice as many sections and obtaining the same particle size distribution as with 500 sections after 12 h of simulation.
Simulation of Aerosol Dynamics
495
For consistency among the sectional algorithms, the same growth law was used for all 3 sectional algorithms. It represents the rate of growth of a particle using the formula of Fuchs and Sutugin s 1971.. dv dt
s 1 q
t
4p rD 1.333 Kn q0.71 1 qKn
/
n
m
P,
s 7.
Kn
where r is the particle radius, D is the diffusion coef® cient of the condensing vapor, Kn is the Knudsen number equal to l r r, l is the mean free path of the condensing vapor, n m is the molecular volume of the condensing vapor, and P is the ambient vapor pressure of the condensing vapor. We assume here that the equilibrium vapor pressure of the condensing vapor is 0. In Models-3, the growth law is calculated as the harmonic average of a free-molecular growth law and a near-continuum growth law s Binkowski and Shankar 1995.. We simulated 6 scenarios typical of clear, hazy, and polluted urban conditions as shown in Table 1. Sulfuric acid condensation rates were 0.3 and 0.6, 5.5 and 11, and 4.6 and 9.2 m m 3 cm y3 per 12 h, respectively. Although we focus here on condensational growth, the conclusions that result from this work are also relevant to the evolution of the particle size distribution through volatilization processes. As shown by Seigneur et al. s 1986., the scenario for hazy conditions represents the most stringent test for the simulation of condensational growth. Therefore, we focus our discussion on this case. Figures 3 and 4 present the resultant volume and number size distributions, respectively, for hazy conditions. The simulation of hazy conditions is the most dif® cult test among those presented here because the high condensation rate and the particle size dependence of the growth law lead to a narrow but signi® cant nuclei mode centered around
496
Y. Zhang et al.
Aerosol Science and Technology 31:6 December 1999
FIGURE 3. Simulation s of condensation for h azy conditions with a condensation rate of 5.5 m m 3 cm I 3 r 12 h, particle volume distributions, initially and after 12 h.
0.1 m m. The ``exact’’ solution obtained with the full-moving algorithm shows a peak of the nuclei mode of about 14 m m 3 cm y3 ; the simulation using the CONFEMM of Tsang and Brock s 1983. showed a similar but slightly higher peak of about 17 m m 3 cm y3 , also centered at 0.1 m m s Figure 6; Seigneur et al. 1986.. Therefore, the nuclei mode has grown both in volume and in size since the me an diameter changed from 0.044 m m s see Table 1. to 0.1 m m. The accumulation mode increased signi® cantly in volume but its me an diameter decreased from 0.24 m m s see Table 1. to about 0.2 m m. This decrease is due to the fact that the number of particles available for condensation increases steadily as the diameter decreases from 1 m m to 0.05 m m; there-
fore, more condensation occurs on the smaller particle population. The moving-center algorithm cannot reproduce the narrow nuclei mode centered at 0.1 m m because the sectional size resolution is not ® ne enough. It takes about 100 size sections over the range of 0.001 to 10 m m s i.e., a resolution 8 times ® ner than the one used here . to be able to reproduce this nuclei mode. The moving-center algorithm reproduces the accumulation mode well, although it predicts a mean diameter that is slightly lower than the one predicted by the ``exact’’ solution. The Bott’s algorithm of CIT signi® cantly overpredicts the particle volume below 0.1 m m. Consequently, mass conservation leads to a signi® cant underprediction of the volume
Aerosol Science and Technology 31:6 December 1999
Simulation of Aerosol Dynamics
497
FIGURE 4. Simulation s of condensation for h azy conditions with a condensation rate of 5.5 m m 3 cm I 3 r 12 h, particle number distributions, initially and after 12 h.
growth in the accumulation mode since most of the condensational growth occurs below 0.1 m m. The hybrid algorithm of UAM-AERO reproduces the overall growth of the size distribution well, although it fails to simulate the 2 distinct pe aks of the nuclei and accumulation modes that appear in the ``exact’’ solution because of insuf® cient size resolution in the sectional representation. However, the hybrid algorithm of UAMAERO may lead to signi® cant numerical diffusion for time steps commensurate with 3-D transport s i.e., less than 1 h.. The Models-3 algorithm does not reproduce the major characteristics of the particle size distribution after 12 h of simulation. The distinct nuclei mode is not
reproduced because the ® xed standard deviation assumed in Models-3 does not allow the prediction of such a narrow nuclei mode. The original version of the modal approac h of E. Whitby reproduced this narrow nuclei mode very well because it used a variable standard deviation s Seigneur et al. 1986.. After 12 h, the accumulation mode shows a mean diameter of about 0.3 m m. This increase in the me an diameter is due to the ® xed standard deviation assumed in the Models-3 formulation. It is not, however, consistent with the results obtained with the full-moving algorithm and CONFEMM, which show a decrease in the me an diameter of the accumulation mode. The number size distributions show that all algorithm s fail to reproduce the sharp
498
Y. Zhang et al.
peak that is simulated with the ``exact’ ’ solution at about 0.1 m m. This pe ak value in the number distribution corresponds to the nuclei mode. The sectional algorithms cannot reproduce this pe ak because the sectional size resolution is too coarse s as mentioned above, it would take a resolution about 8 times ® ner than the one used here to properly simulate that peak.. Among the sectional algorithms, GATOR comes the closest to reproducing that peak. The Models-3 modal algorithm simulates a peak similar to GATOR’s peak in magnitude but at a lower diameter. As mentioned above, the same condensation growth law of Fuchs and Sutugin s 1971. was used for all sectional algorithms. We investigate d whether signi® cant differences
Aerosol Science and Technology 31:6 December 1999
would occur in an algorithm’s performance if the original algorithm’s growth law was used. Figure 5 shows the simulation of hazy conditions with the Bott’s algorithm using both the Fuchs ] Sutugin growth law and the growth law originally used in CIT s Meng et al. 1998.. The performance of the Bott’s algorithm is slightly better when the original CIT growth law is used. However, the discrepancy between the 2 CIT simulations is due primarily to different integration time steps rather than to the mathematical formulation of the growth law. The Fuchs ] Sutugin growth law triggers smaller integration time steps compared to the original CIT growth law. Consequently, the numerical errors associated with the Bott’s algorithm accumulate more when using the
FIGURE 5. Simulation s of condensation for h azy conditions using different growth laws with a condensation rate of 5.5 m m 3 cm I 3 r 12 h, particle volume distributions, initially and after 12 h.
Aerosol Science and Technology 31:6 December 1999
Fuchs ] Sutugin growth law, leading to larger errors in the volume size distribution after 12 h of simulation. As mentioned above, several implementations of the modal algorithm were considered here under the Models-3 formulation. v
v
v
Models-3 s AER.: Implementation by AER of changes to the Models-3 mathematical formulation in the Models-3 code s i.e., condensation on the nuclei and accumulation modes.. Models-3 s EPA1.: Application of the Models-3 formulation without nucleation and coagulation s condensation on the accumulation mode only.. Models-3 s EPA2.: Application of the Models-3 formulation without nucleation s condensation on the nuclei and accumulation modes, but with coagulation..
Simulation of Aerosol Dynamics
499
The ® rst algorithm should represent more accurately the formulation of the modal approac h in Models-3 and it was used in the simulation results presented in Figures 3 and 4. In Figure 6 we present the volume size distributions simulated with the 3 different implementations of the Models-3 condensation algorithms. As expected, the EPA1 implementation underpredicts particle growth since condensation on the nuclei mode is not simulated; it is, therefore, not a good representation of the actual formulation of Models-3. The AER implementation and the EPA2 implementation give similar results, but the latter implementation leads to slightly higher particle diameter due to coagulation. These results con® rm our understanding of the Models-3 formulation and suggest that the AER im-
FIGURE 6. Simulation s of condensation for hazy conditions using different implementations of the Models-3 algorith m with a condensation rate s 5.5 m m 3 cm I 3 r 12 h, p article volume distributions, initially and after 12 h.
500
Aerosol Science and Technology 31:6 December 1999
Y. Zhang et al.
plementation used above in the algorithm comparison provide s a realistic representation of the formulation of condensation in Models-3. We calculated the average absolute normalized error over the diameter range 0.1 ] 2.15 m m s see Table 3.. Over all simulations, the maximum normalized errors were 31, 12, 58, and 21% after 12 h of simulation for CIT s using the Fuchs ] Sutugin growth law., GATOR, Models-3 s using the AER implementation., and UAM-AERO , respectively. The original modal formulation of E. Whitby with variable standard deviations s as described in Seigneur et al. s 1986.. led to less error s 18% . than the current Models-3 modal representation. The computational time for various condensational growth algorithms varies with the applications studied, the size representations used, and the condensational growth equations used. For a 12-section representation with the Fuchs and Sutugin growth law and a sulfuric acid condensation rate of 11 m m 3 cm y3 per 12 h for hazy conditions, the computational times for the movingcenter algorithm, the Bott’s algorithm of CIT, and the hybrid algorithm of UAMAERO are 0.8, 6.2, and 0.1 CPU s, respectively, on a Compaq Deskpro 2000. The computational time for the modal approach of Models-3 is 0.2 CPU s.
SIMULATION OF NUCLEATION Formulation of Nucleation Algorithms We compare algorithms used to calculate nucleation of sulfuric acid s H 2 SO 4 . particles in current 3-D air quality models for particulate matter. Table 4 summarizes the parameterizations used to simulate the rate of nucleation of new particles in air quality models. It is interesting to note that all parameterizations are based on the same set of calculations of nucleation rates performed by Jaecker-Voirol and Mirabel s 1989.. Therefore, discrepancies in the nucleation rates originate from the algorithms used to parameterize these original calculations. The work of Jaecker-Voirol and Mirabel s 1989. is based on heteromolecular homogeneous nucleation theory of H 2 SO 4 ] H 2 O. Jaecker-Voirol and Mirabel present their calculations of nucleation rates as a set of 5 ® gures that show the nucleation rate as a function of the gas-phase concentration of H 2 SO 4 , temperature s 223 ] 373 K., and relative humidity s 20 ] 100% .. The formulation of H 2 SO 4 nucleation rates, as they are currently implemented in 3-D air quality models, can be considered as containing 2 components: s 1. The overall formulation that de® nes whether the nucleation rate is calculated after the condensation rate on existing particles, before the
TABLE 3. Comp arison of simulation results for condensation. a Average absolute norm alized error ( %) Initial particle concentration Condensation rate s m m3 r cm3 per 12 h. CIT s the Bott’s algorithm. GATOR s the moving center algorithm. Models-3 s the modal algorithm, AER ve rsion. UAM-AERO s hybrid algorithm. a
Clear conditions 0.3 4 6 6 9
0.6 9 10 17 13
Hazy conditions 5.5 17 12 33 8
11 31 12 58 21
Urban conditions 4.6 2 2 6 5
9.2 4 3 13 4
The average absolute normalized error is calculated with respect to the ``exact’’ solution s full moving algorithm with 500 sections . over the particle diameter range 0.1 ] 2.15 m m.
Aerosol Science and Technology 31:6 December 1999
Simulation of Aerosol Dynamics
501
TABLE 4. Nucleation p arameterizations used in 3-D air quality models for particulate matter. Air qu ality model CIT
GATOR
Models-3
SAQM-AERO UAM-AERO UAM-AIM
Parameterization for nucleation rate a
Overall approach Gas-phase H 2 SO4 concentration calculated from SO 2 oxidation at e ach time step, nucleation rate calculated before condensation. Gas-phase H 2 SO4 concentration calculated from SO 2 oxidation, nucle ation, diffusion-limited condensation simultaneously. Gas-phase H 2 SO4 concentration calculated from SO 2 oxidation and diffusion-limited condensation; nucleation rate calculated next. Condensation only Condensation only Condensation only
Wexler et al. 1994
1. Fitzgerald et al. 1998 2. Pandis et al. 1994
1. Harrington and Kreidenweis 1998 2. Kerminen and Wexler 1994 None None None
a
Some models offer alternative parameterizations; the ® rst one listed is the one implemented most recently and is the preferred one.
condensation rate, or together with the condensation rate; and s 2. the actual parameterization of the nucleation rate. In CIT, the nucleation rate is calculated before the condensation rate. After completion of the integration of the gas-phase chemical kinetic equations, the amount of gas-phase H 2 SO 4 produced by SO 2 oxidation is updated. This gas-phase H 2 SO 4 concentration is then compared to a critical H 2 SO 4 concentration to determine what amount s if any. of H 2 SO 4 will nucleate. If the gas-phase H 2 SO 4 concentration is less than or equal to the critical H 2 SO 4 concentration, no nucleation occurs. If the gasphase H 2 SO 4 concentration exceeds the critical H 2 SO 4 concentration, the amount of H 2 SO 4 in excess of this critical amount nucleates. The amount of H 2 SO 4 that does not nucleate condenses on existing particles. Therefore, the amount of H 2 SO 4 that nucleates does not depend on the concentrations of existing particles on which condensation may occur. The amount of nucleating H 2 SO 4 is placed in the lowest size
section of the particle size distribution s 0.039 ] 0.078 m m in the most recent application. . The critical concentration of H 2 SO 4 , w H 2 SO 4 x c s m g m y 3 ., over which nucleation occurs was developed from the calculations of Jaecker-Voirol and Mirabel s 1989. using a nucleation threshold of 1 particle cm y3 sy 1 . It is a function of temperature, T s K., and relative humidity, RH s dimensionless fraction., and is expressed as follows s Kerminen and Wexler 1994; Wexler et al. 1994.: w H 2 SO 4 x c s 0.16 = exp s 0.1T y 3.5RH y 27.7 . . s 8. In GATOR, the nucleation rate is calculated together with the condensation rate. After solution of the gas-phase chemical kinetic equation over a time integration step, the amount of gas-phase H 2 SO 4 produced by SO 2 oxidation is updated. This gas-phase H 2 SO 4 concentration is used to estimate a nucleation rate. Then this nucle-
502
Aerosol Science and Technology 31:6 December 1999
Y. Zhang et al.
ation rate is converted to a mass transfer rate between the gas and particle phases and is added to the mass transfe r rate due to diffusion-limited condensation. Condensation and nucleation are then solved simultaneously s Jacobson 1997b. . The number concentration of newly nucleated particles is then extracted from the total particulate mass growth rate and added to the smallest particle size section s 0.014 ] 0.024 m m in the most recent application.. Since mass-transfer rates due to growth depend on particle number concentration, and condensation is coupled with nucleation, the amount of H 2 SO 4 nucleating to form new particles is indirectly affected by the number concentration of existing particles on which condensation occurs. Two parameterizations of the nucleation rate have been used in GATOR, although homogeneous and heterogeneous classical nucleation rate equations are also present in the model. The original parameterization s here after referred to as GATOR1. is based on Pandis et al. s 1994. and is for a temperature of 298 K. log Js 7 qw s y 64.24 q4.7RH . qs 6.13 q1.95 RH . log w H 2 SO 4 x x , s 9. where J is the nucleation rate in particles cm y3 s y1 , RH is in dimensionless fraction, and w H 2 SO 4 x is the gas-phase sulfuric acid concentration. This parameterization is based on the calculated nucleation rates of Jaecker-Voirol and Mirabel s 1989. and the use of an experimental nucleation factor propose d by Raes et al. s 1992.. This parameterization does not provide any temperature dependence. The new parameterization s here after referred to as GATOR2. is based on the work of Fitzgerald et al. s 1998. and includes temperature dependence. They developed their parameterization of the
H 2 SO 4 nucleation rates based on the calculations of Jaecker-Voirol and Mirabel s 1989.. Their parameterization depends on the gas-phase H 2 SO 4 concentration, RH, and T; it is intended primarily for RH ) 60% . log Js y2 q log Js 1 q
3E
C 3D C
for E F 0, for E ) 0,
s 10 . s 11 .
where J is the nucleation rate in particles cm y3 sy1 ; E and D are functions of the H 2 SO 4 gas-phase concentration, RH, and T; and C is a function of RH and T s C has different formulations depending on the signs of E and D .. In Models-3, the nucleation rate is calculated after the condensation rate. A gasphase H 2 SO 4 concentration is calculated from a steady-state assumption based on gas-phase oxidation of SO 2 to H 2 SO 4 and H 2 SO 4 condensation or existing particles. This gas-phase H 2 SO 4 concentration is then used to calculate the H 2 SO 4 nucleation rate . Two parameterizations of the nucleation rate are available in Models-3. The original parameterization is based on the work of Kerminen and Wexler s 1994. and is therefore similar to the parameterization used in CIT. s Note, however, that in CIT the nucleation rate is calculated before the condensation rate.. The most recent parameterization is based on the work of Harrington and Kreidenweis s 1998.. This parameterization is also based on the calculations of JaeckerVoirol and Mirabel s 1989.. The major difference with the parameterization of Kerminen and Wexler s 1994. is that Harrington and Kreidenweis do not make any assumption of a threshold nucleation rate. The parameterization of Harrington and Kreidenweis assumes that the nucleation rate is constant over a time period, and it is
Aerosol Science and Technology 31:6 December 1999
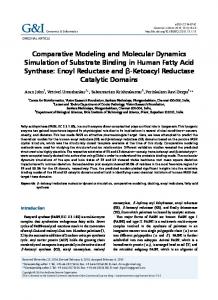
calculated by integrating the time-dependent nucleation rate over that time period. Anothe r difference between the 2 parame terizations is that the parameterization of Harrington and Kreidenweis estimates the nucleation rate for both number and mass, whereas the parameterization of Kerminen and Wexler estimates only the nucleation rate for mass. The parameterization of Harrington and Kreidenweis was used for our comparative evaluation. Simulation Results Our comparative evaluation focuses on the nucleation parameterizations. The competition between nucleation of new particles and condensation on existing particles for gas-to-particl e conversion is not considered here. Our simulations are therefore representative of an ultraclean atmosphere, and nucleation rates in a typical clear, hazy, or polluted urban atmosphere would be lower due to removal of H 2 SO 4 gas molecules via condensation on existing particles. Because some nucleation parameterizations s i.e., CIT and GATOR. require the H 2 SO 4 gasphase concentration, it is necessary to calculate the H 2 SO 4 gas-phase concentrations from the H 2 SO 4 production rate. To that end, we need to specify an integration time step. Two time steps were used s 5 and 15 min. to test the sensitivity of the nucleation rate to the time step speci® cation. Note that in the air quality model implementation, only the CIT nucleation formulation is sensitive to the value of the time step because, in GATOR, the H 2 SO 4 gas-phase concentration is calculated from the production and gas-to-particl e conversion s i.e., nucleation and condensation. rates. We compared the nucleation algorithms for a variety of conditions covering H 2 SO 4 production rates ranging from 0.045 m g m y3 h y1 to 1.65 m g m y3 h y1 , relative humidities ranging from 10 to 95% , and ambient
Simulation of Aerosol Dynamics
503
temperatures ranging from 273 to 303 K. No signi® cant nucleation occurred for the low H 2 SO 4 production rate. Therefore we focus our discussion on the simulation of the high H 2 SO 4 production rate. Results are presented for the smaller time step, i.e., 5 min. Higher nucleation rates were obtained in our simulations for the CIT and GATOR algorithms when using a time step of 15 min s the results of the Models-3 algorithm do not depend on the time step used., but the conclusions were qualitatively similar. Figure 7 shows the nucleation rates predicted by 4 algorithms as a function of RH for the H 2 SO 4 production rate of 1.65 m g m y3 h y 1 and a temperature of 298 K. Also shown on the ® gure are the maximum H 2 SO 4 nucleation rate s labeled w H 2 SO 4 x . allowed from the H 2 SO 4 production rate. Therefore, in an air quality model simulation, nucleation rates will necessarily be capped at that maximum H 2 SO 4 nucleation rate due to mass conservation constraints. The nucleation rate that corresponds to 1% of the maximum nucleation rate is also shown s labeled 1% w H 2 SO 4 x .; if the calculated nucleation rate is - 1% of that value, then nucleation is a negligible pathway for H 2 SO 4 gas-to-particl e conversion because condensation on existing particles would dominate in a pristine environment. Therefore the range between these 2 lines, s H 2 SO 4 . and 1% w H 2 SO 4 x , represents the range of relevant nucleation rates. All algorithms, except GATOR2 and Models-3, predict nucleation rates that exceed the 1% maximum rate level for some RH values; however, they differ signi® cantly for the range of RH ove r which nucleation rates are nonnegligible . Both CIT and Models-3 algorithms show little dependence on RH for high RH values. Models-3 predicts a negligible nucleation rate with a sharp decrease in the nucleation rate for RH - 30% . CIT predicts no nucle-
504
Y. Zhang et al.
Aerosol Science and Technology 31:6 December 1999
FIGURE 7. Nucleation rate as a function of RH([ H 2 SO4 ] s 1.65 m g m I 3 h I 1 , T s 298 K, and dt s 5 min ) .
ation below RH s 70% . For cases where the CIT algorithm predicts that nucleation occurs, it calculates a nucleation rate that is 2 ] 3.5 orders of magnitude greater than the nucleation rate predicted by the Models-3 algorithm. Both GATO R1 and GATOR2 algorithms predict an increase in the nucleation rate with RH, except as RH increases from 10 to 30% , where GATOR2 predicts a slight decrease of the nucleation rate. However, the GATOR1 algorithm predicts a nucleation rate that is up to 8 orders of magnitude greater than the nucleation rate predicted by the GATOR2 algorithm . The GATOR2 algorithm predicts a negligible nucleation rate. At high RH, the highest nucleation rates are predicted by the GATOR1 and CIT algorithms. At low RH, GATOR1 predicts the highest s although negligible . nucleation rate. Figure 8 shows the predicted nucleation rates for the H 2 SO 4 production rate of 1.65 m g m y3 h y1 and a RH of 80% , as a
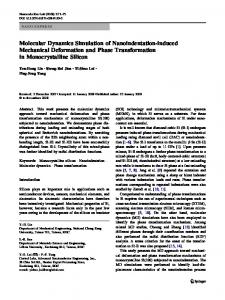
function of temperature s T .. Several algorithms show maximum nucleation rates over some temperature range s nucleation rates that are predicted here to exceed the maximum nucleation rate will be capped at that maximum value in an air quality model to maintain mass conservation.. Because the GATOR1 algorithm does not include temperature dependence, it predicts a maximum nucleation rate for the whole temperature range. The GATOR2 algorithm predicts a maximum nucleation rate for temperatures - 280 K. The CIT algorithm predicts a maximum nucleation rate for most cases, except for T ) 290 K. The Models-3 algorithm predicts a nucleation rate that is negligible at all temperatures. Discrepancies between the predicted nucleation rates range from 4 orders of magnitude at 273 K to 8 orders of magnitude at 303 K. Calculations of absolute values of nucleation rates are obviously quite uncertain in light of the results presented here. In a
Aerosol Science and Technology 31:6 December 1999
Simulation of Aerosol Dynamics
505
FIGURE 8. Nucleation rate as a function of temperature ([ H 2 SO4 ] s 1.65 m g m I 3 h I 1 , RH s 80%, and dt s 5 min ) .
polluted urban environment, where 3-D air quality models will be applied to address PM-2.5 standard issues, it is appropriate in most cases to assume that nucleation is negligible compared to condensation and can therefore be ignored. An exception may be ne ar strong pollution sources where nucleation rates could be very high s e.g., emission of SO 3 that rapidly hydrolyzes to H 2 SO 4 .. In a ne arly pristine environment, where proposed regional haze regulations will apply, it may be appropriate to simulate nucleation. In that case, an approach that partitions gas-to-particl e conversion between nucleation of new particles and condensation on existing particles is a better approach than one based on the absolute prediction of a nucleation rate. For example, the work of McMurry and Friedlander s 1979. provide s some basis for developing such formulations. Simulation of nucleation using the aforementioned algorithms requires minimal computational time s - 0.1 CPU s on a
Compaq Deskpro 2000. because all these formulations are analytical functions of the H 2 SO 4 gas-phase concentration, RH, and r or T.
SIMULATION OF GAS r PARTICLE MASS TRANSFER Formulation of Gas r Particle Mass Transfer We compare 3 different approache s to the treatment of mass transfe r between the bulk gas phase and the surface of atmospheric particles. These approache s can be summarized as follows: v
v
Kinetic approach, where mass transfer is simulated explicitly; chemical concentrations in the bulk gas phase and in the particles may or may not be in equilibrium. Equilibrium approach, where the bulk gas phase is assumed to be in chemical equilibrium with the particles. All particles
506
v
Aerosol Science and Technology 31:6 December 1999
Y. Zhang et al.
must therefore have the same chemical composition for species involved in gas r particle equilibrium. Hybrid approach, where the bulk gas phase is assumed to be in chemical equilibrium with the whole particulate phase, but where the distribution of condensable r volatile species among particles of different sizes is calculated using diffusion-limited assumptions. Although the whole particulate phase is in equilibrium with the gas phase, individual particles s or particles in a given size range . may not be in equilibrium with the gas phase.
The kinetic approach is based on solving the equation for mass transfe r between the bulk gas-phase and individual particles s or particle populations.. In current 3-D air quality models such as CIT, GATOR, and UAM-AIM, particles are assumed to be internally mixed s i.e., all particles of the same size have the same chemical composition. and are distributed according to size sections s i.e., all particles within a given size range have the same chemical composition.. Therefore the mass transfer equation is solved between the bulk gas phase and the surface of the particles. The mass ¯ ux Jl of the condensing vapor to the surface of a single particle in size section l can be expressed as follows. Jl s
4p rD 1 qF
s C g y C sl . ,
s 12 .
where r is the particle radius, D is the diffusion coef® cient of the condensing vapor in the air, F is a correction factor that accounts for the effect of particle size on condensation rate, C g is the chemical species concentration in the bulk gas phase, and C sl is the chemical species concentration at the surface of the particles in section l. For large values of r, F tends toward 0 and the ¯ ux is proportional to r s continuum regime .. For small values of r, F is
proportional to l r r, where l is the me an free path of the air and the ¯ ux is proportional to r 2 s free-molecule regime .. There are various formulations of the function F for the representation of the transition regime between the free-molecule regime s where J is proportional to r 2 . and the continuum regime s where J is proportional to r .. For example, in the Fuchs ] Sutugin s 1971. formulation Fs
t
1.333 l r r q0.71 1 ql r r
/ l
r
;
s 13 .
then F tends toward 1.333 l r r as r decreases. In CIT, the following formulation is used s Wexler and Seinfeld 1990.. Fs
l a r
s 14 .
,
where a is the accommodation coef® cient of the chemical species on the particle s i.e., probability that the chemical species will remain on the particle .. The CIT factor was used in our simulations. At the particle surface, the gas-phase concentration is in equilibrium with the particle-phase concentration. Ks
Cp l C sl
,
s 15 .
where K is the thermodynami c equilibrium constant s e.g., Henry’s law constant for gas r liquid equilibrium . and C pl is the chemical species concentration in the particle. For a multicomponent mixture, concentrations in the liquid particulate phase are corrected for nonideality of the solution using activity coef® cients. In CIT, chemical equilibrium between the particles and the gas phase is calculated using the SCAPE2 module s Meng et al. 1998.. Next, it is necessary to calculate the growth of particles from section s l y 1. to section l, and from section l to section
Aerosol Science and Technology 31:6 December 1999
Simulation of Aerosol Dynamics
s l q1., due to the condensational growth of particles. Several numerical algorithms are available to calculate the mass ¯ ux from one size section to the next. Bott’s scheme is used to solve the condensational growth equation in CIT s Bott 1989; Dhaniyala and Wexler 1996.. If volatilization occurs instead of condensation, the above processes are simulated in reverse with a mass ¯ ux from the particle surface toward the bulk gas phase and shrinkage of the particle as chemical mass is transferred from the particle phase to the gas phase. The equilibrium approach is used in Models-3 s Binkowski and Shankar 1995; Binkowski 1998. and in models that do not provide a resolution of particle chemical composition as a function of particle size. For example, model simulations where only one section is used to represent the particle population, such as the applications of SAQM-AERO to the California San Joaquin Valley s Dabdub et al. 1998. or the Los Angeles Basin, CA s Pai et al. 1998., involve an equilibrium approach. The equilibrium approac h is also used with a sectional size distribution in plume models s H udische wskyj and Se igne ur 1989; Seigneur et al. 1997.. In the equilibrium approach, the mass transfer between the bulk gas phase and the particle surface is assumed to be instantaneous so that there is no concentration gradient between the bulk gas phase and the particle surface. C sl s C g ,
l s 1, . . . , L.
s 16 .
Then all particles are in equilibrium with the sam e gas-phase che mical concentration. Ks
Cp l Cg
.
s 17 .
507
Consequently, all particles have the same chemical composition. Cp l s C p ,
l s 1, . . . , L.
s 18 .
The hybrid approach was originally introduced by Pandis et al. s 1994. and later implemented by Lurmann et al. s 1997. in UAM-AERO and SAQM-AERO . A hybrid approac h has also been implemented as an option in CIT s Meng et al. 1998.. In the hybrid approach, equilibrium is assumed between the bulk gas phase s C g . and the whole particulate phase. Let Q l be the mass of particles in section l, and let C pl be the concentration s per unit mass of particle . of the chemical species of interest in particles in size section l. Then the following equilibrium relationship is assumed: Ks
p Q l Cp l 1 p Ql
Cg
.
s 19 .
However, each size section is not required to be in individual equilibrium with the bulk gas phase. Instead, the condensing chemical species is distributed among the size sections according to the ¯ ux relationship de® ned in Equation s 12.. The hybrid approac h used in UAMAERO differs slightly from the option availabl e in CIT. In UAM-AERO , the amount of water present in the particles is calculated through an equilibrium relationship that is speci® c to each particle size section. The simulation results presented here focus on the size distribution of sulfate, nitrate, ammonium, sodium, and chloride species, and we use the hybrid approac h available in CIT. Simulation Results The kinetic approach provides the most comprehensive solution to the gas r particle conversion process. To ensure that differences in the results are due only to the
508
Y. Zhang et al.
treatment of mass transfer, simulations were conducted with the same aerosol module for thermodynami c equilibrium s SCAPE2. and condensational growth s CIT algorithm .. The CIT mass transfe r module was used to represent the kinetic approach. The hybrid approac h was simulated within CIT by using the same conceptual approach as used in the UAM-AERO mass transfer module. The equilibrium approach was simulated by assuming gas r particle equilibrium and the same particulate chemical composition of volatile compounds for all particle sizes. Simulations were conducted for 4 different sets of atmospheric conditions. The emphasis was placed on addressing different conditions that affect mass transfer, i.e., various aerosol size distributions and sizeresolved chemical compositions. The list of these conditions is presented in Table 5. The PM size-resolved chemical composition affects the local thermodynamic equilibrium of each particle s or, in our case, particle size section .. The particle size distribution affects the distribution of condensable species to various particle sizes s or, alternatively, the volatilization of chemical species from the various particle sizes.. The concentrations of condensable species will affect the importance of the kinetics of the mass transfe r process. Simulations were conducted for 15 h to provide enough time for the mass transfer to take place. The ® rst 2 cases are intended to represent conditions typical of the Los Angeles Basin, where it has been demonstrate d that neglecting the mass transfe r kinetics makes a difference on the particulate concentrations. A major question is whether it will make a difference in other areas of the country and, if it does, what the uncertainty associate d with neglecting the mass transfer kinetics is. Therefore, the next 2 cases are representative of conditions in the cen-
Aerosol Science and Technology 31:6 December 1999
tral U.S., where there is no signi® cant amount of sodium chloride in the particulate phase and the nitrate concentrations are lower. The results are shown in Figures 9 and 10 for the 2 cases listed in Table 5 that have high ammoni a concentrations s i.e., more ammonium nitrate condensation.. In each ® gure, the results are presented for the size-distributed chemical composition for the kinetic approach after equilibrium has been re ached s i.e., particulate nitrate concentration within 1% of equilibrium value ., the hybrid approach, and the equilibrium approach. The time needed to re ach equilibrium with the kinetic approac h is also indicated. More time is needed to re ach equilibrium when HNO 3 reacts with NaCl to form particulate nitrate in coarse particles because it takes large particles longer than small particles to reach equilibrium with the bulk gas phase s Wexler and Seinfeld 1990; Meng and Seinfeld 1996.. Also, the kinetic approach leads to more nitrate present in coarse particles than in the equilibrium and hybrid approaches, and the pe ak of the particle size distribution differs among the 3 approaches. When no NaCl is present, ammonium nitrate condenses on ® ne particles and equilibrium is reached fairly rapidly. After 1 h, the kinetic approach predicts that at least 74% of ammonium nitrate has already condensed. The hybrid approac h gives a size distribution similar to the one predicted by the kinetic approach. The equilibrium approach, however, predicts a slightly different size distribution. Carbonate salts will have a similar effect to chloride salts, as carbonate reacts with acid species such as HNO 3 and H 2 SO 4 , leading to the release of CO 2 and the formation of particulate nitrate and sulfate, respectively.
Aerosol Science and Technology 31:6 December 1999
Simulation of Aerosol Dynamics
509
FIGURE 9. Size-resolved equilibrium chemical composition of p articles calculated for case 2 at equilibrium with the kinetic, full equilibrium, and hybrid approaches.
510
Y. Zhang et al.
Aerosol Science and Technology 31:6 December 1999
FIGURE 10. Size-resolved equilibrium chemical composition of particles calculated for case 4 at equilibrium with the kinetic, full equilibrium, and hybrid approaches.
Aerosol Science and Technology 31:6 December 1999
Simulation of Aerosol Dynamics
TABLE 5. Condition s used for the comparison of kinetic, hybrid , and equilibrium m ass tr ansfer approaches ( particulate sulfate concentration 1 s 20 m g m I 3 in all simulations, initial particulate ammonium concentration 1 s 9.7 m g m I 3 , initial p articulate nitr ate concentration 1 s 7.6 m g m I 3 ) . Simulation 1 2 3 4
HNO3 ( ppb )
NH 3 ( ppb )
NaCl ( m g mI 3 ) 2
15 15 5 5
5 15 5 15
3 3 0 0
1
Size distribution is assumed to be log-normal with a mass median diameter of 0.3 m m and a standard deviation of 1.8. 2 Size distribution is assumed to be log-normal with a mass median diameter of 3 m m and a standard deviation of 2.2.
The computational time varies with the applications studied, the size representations used, and the mass transfer approache s used. For example, for case 4 with an 8-section representation, the equilibrium and the hybrid approaches used - 0.5 CPU s on a Compaq Deskpro 2000 with 64 MB RAM. The kinetic approach used 27 CPU s, a factor about 50 times longer than those of the equilibrium and the hybrid approaches. For cases with chloride and r or carbonate concentrations in coarse particles, the CPU time for the equilibrium and the hybrid approaches is similar to that of cases without chloride and carbonate salts, whereas the CPU time for the kinetic approach increases signi® cantly s by a factor of 5 ] 100 depending on the speci® c cases. because it takes longer for large particles to reach gas r particle equilibrium.
CONCLUSIONS We have compared algorithms that are currently used in 3-D air quality models to simulate aerosol dynamics, including coagulation, condensational growth, nucleation,
511
and gas r particle mass transfer. Our review included aerosol modules used in CIT, G A TO R , Mode ls-3, SAQ M -A E RO , UAM-AERO, and UAM-AIM. Algorithms availabl e to simulate coagulation and condensational growth can be groupe d into 2 major categories according to the representation of the particle size distribution, i.e., sectional or modal. Models-3 uses a modal approac h using 3 lognormal distributions with constant standard deviations to represent the Aitken nuclei, accumulation, and coarse modes. Models-3 will be updated to include a modal approach that uses variable standard deviations s Binkowski 1999.. The other models use a sectional representation, although they differ in their treatment of the numerical solution to the condensational growth equation and only 1 model s GATOR. simulates coagulation. Simulation of coagulation with a sectional approach is numerically accurate. The modal approach is not accurate if ® xed standard deviations are used; better accuracy is obtaine d if variable standard deviations are used. The most accurate solution of the condensational growth equation was obtained with the moving-center algorithm of GATOR. The hybrid algorithm of UAMAERO shows some numerical diffusion but was able to reproduce the major fe atures of the evolution of the particle size distribution. However, performance of both the moving-center and the hybrid algorithms needs to be evaluate d for 3-D model simulations because numerical diffusion may then increase. The Bott’s numerical scheme appears to generate unrealistic results for the very small particle size range s i.e., below 0.01 m m.. The modal approach can be fairly accurate if the standard deviations of the distributions are allowed to vary but is inaccurate if ® xed standard deviations are used.
512
Y. Zhang et al.
Very large differences were found among the 4 parameterizations of H 2 SO 4 nucleation rates used in CIT, GATOR s 2 parameterizations., and Models-3. Absolute values of nucleation rates vary by many orders of magnitude among the 4 algorithms considered here. Moreover, the dependence of these algorithms on RH and temperature varies widely from one algorithm to another. Considering the fact that all 4 algorithms were derived from the same data set of calculations of heteromolecular homogeneous nucleation of H 2 SO 4 ? n H 2 O s Jaecker-Voirol and Mirabel 1989., these results re¯ ect the extreme sensitivity of nucleation rates to environmental parameters. Therefore, an approac h based on the relative rates of nucleation and condensation seems preferable to one that is based on absolute nucleation rates. Simulation of gas r particle mass transfer for volatile species was performed using an explicit kinetic treatment of mass transfer between the bulk gas phase and the particle surface, an equilibrium between the bulk gas phase and the particles s i.e., instantaneous mass transfer., or a hybrid approach that assumes equilibrium for the whole particulate matter but distribute s mass over the particles according to a diffusion-limite d condensation algorithm . For areas where compounds containing chloride or carbonate are a signi® cant component of PM, the kinetic approach is recommended because mass transfe r from the gas phase to coarse particles is the rate limiting process s e.g., coastal areas for chloride and arid areas for carbonate .. For cases where chloride and carbonate compounds are not important, it is appropriate to use the hybrid approach, since it gives results similar to those obtained with the kinetic approach and equilibrium is reached within about an hour. The selection of size representations and algorithm s to simulate various aerosol dynamic processes including coagulation, con-
Aerosol Science and Technology 31:6 December 1999
densation r evaporation , nucleation, and gas r particle mass transfe r may depend on the speci® c objectives of the study. With appropriate numerical algorithm s and size resolution, a sectional representation can predict more accurate chemical composition and size distribution than a modal representation; however, it requires more computational time than the modal approach. Therefore, the algorithms based on a detailed sectional representation may be more appropriate for detailed simulations of aerosol dynamics and thermodynamics, whereas a modal approach or a 2-section s ® ne and coarse . representation may be suitable for large-scale applications where computational ef® ciency is required. The accuracy of the sectional representation strongly depends on the size resolution, which can be determined based on the speci® c applications. For example, a sectional representation of 8 size sections over the 0.02 ] 10 m m particle diameter range is generally suf® cient to simulate detailed aerosol dynamics and thermodynamics and is thus commonly used in current 3-D air quality models. For visibility studies, such a resolution has been shown to be suf® cient to calculate the particle extinction coef® cients as long as the proper approach is used to calculate the sectional extinction coef® cients s Wu et al. 1996.. For regulatory applications pertaining to PM ambient concentrations, a sectional representation with 2 sections s i.e., the ® ne PM 2.5 and the coarse PM 10 sections. may be suf® cient in cases where there is little interaction between the ® ne and coarse modes s i.e., in the absence of chloride and carbonate .. Further work should address the simulation of these various processes together, for a range of typical atmospheric conditions. One would expect that the overall error will be governed by the coagulation algorithm when gas r particle conversion processes are negligible and by gas r particle conversion
Aerosol Science and Technology 31:6 December 1999
algorithm s s growth, shrinkage , and mass transfer. when secondary aerosol formation is signi® cant. Assessing the overall error associate d with aerosol dynamic processes will allow us to place uncertainty bounds on air quality model predictions of PM concentrations. All the simulations presented in this work were conducted in a standalone mode s i.e., outside of their 3-D host air quality models.; further evaluation of the most promising algorithms for aerosol dynamics and thermodynamics is needed in a 3-D gridded setting where emissions, transport, dispersion, and deposition also take place.
This work was supported by the Coordinatin g Research Council (CRC) under Contrac t A-21-2. Thanks are due to CRC for constructiv e comments.
References
Binkowski, F. S. s 1998.. EPA Of® ce of Research & Deve lopment, Research Triangle Park, NC, private communication. Binkowski, F. S. s 1999.. Aerosols in Models-3 CMAQ. In Science Algorithms of the EPA Models-3 Community Multiscale Air Quality s CMAQ . Modeling System, Chapter 10, edited by D. W. Byun and J. K. S. Ching. Of® ce of Research And Development, U.S Environmental Protection Agency, Washington D.C., EPA r 600 r R-99 r 030, March 1999. Also available at http: r r www.epa.gov r asmdnerl r models3 r doc r science r science.html. Binkowski, F. S., and Shankar, U. s 1995.. The Regional Particulate Matter Model. 1: Model Description and Preliminary Results, J. Geophys. Res. 100:26,19 1 ] 26,209. Bott, A. s 1989.. A Positive De® nite Advection Scheme Obtained by Nonline ar Renormalization of the Advection Fluxes, Mon. Weather Re v . 117:1006 ] 1115. Dabdub, D., DeHaan, L., Kumar, N., Lurmann, F., and Seinfeld, J. H. s 1998.. Computationally Ef® cient Acid Deposition Model for California, Draft Report Contract a92-304, California Air Resources Board, Sacramento, CA.
Simulation of Aerosol Dynamics
513
Dhaniyala, S., and Wexler, A. S. s 1996.. Numerical Schemes to Model Condensation and Evaporation of Aerosols, Atmos. En v iron. 30:919 ] 928. Fitzgerald, J. W., Hoppel, W. A., and Gelbard, F. s 1998.. A One-Dimensional Sectional Model to Simulate Multicomponent Aerosol Dynamics in the Marine Boundary Layer. 1. Modal Description, J. Geophys. Res. 103: 16,085 ] 16,102. Fuchs, N. A., and Sutugin, A. G. s 1971.. High Dispersed Aerosols. In Topics in Current Aerosol Research, edited by G. M. Hidy and J. R. Brock. Pergamon Press, New York, pp. 1 ] 60. Gelbard, F., and Seinfeld, J. H. s 1980.. Simulation of Multicomponent Aerosol Dynamics, J. Colloid Interface Sci. 78:485 ] 501. Gelbard, F., Tambour, Y., and Seinfeld, J. H. s 1980.. Sectional Representation for Simulating Aerosol Dynamics, J. Colloid Interface Sci. 76:541 ] 556. Harrington, D. Y., and Kreidenweis, S. M. s 1998.. Simulation of Sulfate Aerosol Dynamics. I. Model Description, Atmos. En v iron. 32:1691 ] 1700. Hudischewskyj, A. B., and Seigneur, C. s 1989.. Mathematical Modeling of the Chemistry and Physics of Aerosols in Plumes, En v iron. Sci. Technol. 23:413 ] 421. Jacobson, M. Z. s 1997a.. Development and Application of a New Air Pollution Modeling System. II. Aerosol Module Structure and Design, Atmos. En v iron. 31:131 ] 144. Jacobson, M. Z. s 1997b.. Numerical Techniques to Solve Condensational and Dissolutional Growth Equations When Growth is Coupled to Reversible Reactions, Aerosol Sci. Technol. 27:491 ] 498. Jacobson, M. Z., and Turco, R. P. s 1995.. Simulating Condensational Growth, Evaporation, and Coagulation of Aerosols Using a Combined Moving and Stationary Size Grid, Aerosol Sci. Technol. 22:73 ] 92. Jaecker-Voirol, A., and Mirabel, P. s 1989.. Heteromolecular Nucleation in the Sulfuric Acid-Wate r Syste m, Atm os. En v iron . 23:2033 ] 2057. Kerminen, V.-M., and Wexler, A. S. s 1994.. Post-Fog Nucleation of H 2 SO4 ] H 2 O Particle in Smog, Atmos. En viron. 28:2399 ] 2406.
514
Y. Zhang et al.
Lurmann, F. W., Wexler, A. S., Pandis, S. N., Musarra, S., Kumar, N., and Seinfeld, J. H. s 1997 .. Modelling Urban and Regional Aerosols ] II. Application to California’s South Coast Air Basin, Atmos. En v iron. 31:2695 ] 2715. McMurry, P. H., and Friedlander, S. K. s 1979.. New Particle Formation in the Presence of an Aerosol, Atmos. En v iron. 13:1635 ] 1651. Meng, Z., Dabdub, D., and Seinfeld, J. H. s 1998.. Size-Resolve d and Che mically Re solved Model of Atmospheric Aerosol Dynamics, J. Geophys. Res. 103:3419 ] 3435. Meng, Z., and Seinfeld, J. H. s 1996.. Time Scales to Achieve Atmospheric Gas-Aerosol Equilibrium for Volatile Species, Atmos. En v iron. 30:2889 ] 2900. Pai, P., Vijayaraghavan , K., Seigneur, C., Hegarty, J., Leidner, M., and Louis, J.-F. s 1998 .. Particulate Matter Modeling in the Los Angeles Basin Using MM5 and SAQM-AERO ] Preliminary Results. PM2.5 A Fine Particle Standard, Vol. II, Air and Waste Management Association, Long Beach, CA, pp. 748 ] 758. Pandis, S. N., Russell, L. M., and Seinfeld, J. H. s 1994.. The Relationship Between DMS Flux and CCN Concentration in Remote Marine Regions, J. Geophys. Res. 99:16,945 ] 16,957. Raes, F. R., Saltelli, A., and Van Dingenen, R. s 1992.. Modeling Formation and Growth of H 2 SO4 ] H 2 O Aerosols] Uncertainty Analysis and Experimental Evaluation, J. Aerosol Sci. 23:759 ] 771. Seigneur, C. s 1982.. A Model of Sulfate Aerosol Dynamics in Atmospheric Plumes, Atmos. En v iron. 16:2207 ] 2228. Seigneur, C., Hudischewskyi, A. B., Seinfeld, J. H., Whitby, K. T., Whitby, E. R., Brock, J. R., and Barnes, H. M. s 1986.. Simulation of Aerosol Dynamics: A Comparative Review of Mathematical Models, Aerosol Sci. Technol. 5:205 ] 222. Seigneur, C., Pai, P., Hopke, P., and Grosje an, D. s 1999.. Modeling Atmospheric Particulate Matter, En v iron. Sci. Technol. 33:80A ] 86A. Seigneur, C., Wu, X. A., Constantinou, E., Gillespie, P., Bergstrom, R. W., Sykes, I., Venka-
Aerosol Science and Technology 31:6 December 1999
tram, A., and Karamchandani, P. s 1997.. Formulation of a Second-Generation Re active Plume and Visibility Model, Air & Waste Manage. Assoc. 47:176 ] 184. Suck, S. H., and Brock, J. R. s 1979.. Evolution of Atmospheric Aerosol Particle Size Distributions via Brownian Coagulation: Numerical Simulation, J. Aerosol Sci. 10:581 ] 590. Sun, Q., and Wexler, A. S. s 1998.. Modeling Urban and Regional Aerosols Ne ar Acid Neutrality] Application to the June 24 ] 25 SCAQS Episode, Atmos. En viron. 32:3533 ] 3545. Tsang, T. H., and Brock, J. R. s 1983.. Simulation of Condensation Aerosol Growth by Condensation and Evaporation, Aerosol Sci. Technol. 2:311 ] 320. Tsang, T. H., and Brock, J. R. s 1986.. Simulation of Condensation Aerosol Growth by Condensation and Evaporation, Aerosol Sci. Technol. 5:385 ] 388. Tsang, T. H., and Huang, L. K. s 1990.. On a Petrov-Galerkin Finite Element Method for Evaporation of Polydisperse Aerosols, Aerosol Sci. Technol. 12:578 ] 597. Varoglu, E., and Finn, W. D. L. s 1980.. Finite Elements Incorporating Characteristics for O ne -Dime nsional Diffusion-Conve ction Equation, J. Comp. Phys. 34:371 ] 389. Wexler, A. S., Lurmann, F. W., and Seinfeld, J. H. s 1994.. Modelling Urban and Regional Aerosols. I. Model Development, Atmos. Env iron. 28:531 ] 546. Wexler, A. S., and Seinfeld, J. H. s 1990.. The Distribution of Ammonium Salts Among a Size and Composition Dispersed Aerosol, Atmos. En v iron. 24A:1231 ] 1246. Whitby, E. R., and McMurry, P. H. s 1997.. Modal Aerosol Dynamics Modeling, Aerosol Sci. Technol. 27:673 ] 688. Wu, X. A., Seigneur, C., and Bergstrom, R. W. s 1996.. Evaluation of a Sectional Representation of Size Distributions for Calculating Aerosol Optical Properties, J. Geophys. Res. 101:19277 ] 19283. Received February 8, 1999; accepted July 15, 1999.