Simulation of Blasting Induced Ground Vibration by Using Artificial Neural Network Edy Tonnizam Mohamad Associate Professor (Dr.), Faculty of Civil Engineering, Department of Geotechnics and Transportation, Universiti Teknologi Malaysia
[email protected]
Seyed Ahmad Noorani Postgraduate in Geotechnical Engineering, Faculty of Civil Engineering, Department of Geotechnics and Transportation, Universiti Teknologi Malaysia;
[email protected]
Danial Jahed Armaghani Postgraduate in Geotechnical Engineering, Faculty of Civil Engineering, Department of Geotechnics and Transportation, Universiti Teknologi Malaysia;
[email protected]
Rosli Saad Senior Lecturer (Dr.), Geophysics Section, School of Physics, Universiti Sains Malaysia, Penang, Malaysia
[email protected]
ABSTRACT Blast-induced ground vibration is one of the most important environmental impacts of blasting operations because it may cause severe damage to structures and plants in nearby environment. Estimation of ground vibration levels induced by blasting has vital importance for restricting the environmental effects of blasting operations. This study is aimed to compare the ground vibrations predicted from empirical formula and analytical program with the real data. Several predictor equations have been proposed by various researchers to predict ground vibration prior to blasting, but these are site specific and not generally applicable beyond the specific conditions. To evaluate and calculate the blast-induced ground vibration by incorporating blast design and rock strength, artificial neural networks (ANN) was used. In this study, 12 experiments based on blasting parameters, for modeling in MATLAB software and neural network systems were evaluated to predict the Peak Particle Velocity (PPV) and frequency. It was found that in this study, USBM is one of the most accurate empirical formula for the prediction. The advantage of the ANN compared to other empirical relations used for prediction of PPV is the fact that there was no limitation in the number of input parameters. The correlation coefficients for overall analysis for velocity and frequency are 0.997 and 0.989 respectively. The average relative error obtained from ANN estimation was 0.01 % for velocity and 3.96 % for frequency which are negligible when compared with the those predicted by empirical relationships. This study found that ANN method produced more accurate prediction than the empirical formula.
KEYWORDS:
Neural Network, Blasting, Ground vibration, Peak Particle Velocity,
Frequency.
- 2571 -
Vol. 17 [2012], Bund. R
2572
INTRODUCTION Several researches have been conducted on the influence of blast induced ground vibration, and the critical parameters in blasting to reduce the frequency and vibration of the ground. Studies carried out by Dehghani and Ataee-pour (2010), Manoj and Singh (2004), Monjezi, et al. (2009), have all confirmed blast induced ground vibration is very important for surrounding structures. When roads and structures have been constructed in open-pit mine in rocky place, blasting on that area will be used. Blast induced ground vibration is considered as one of the most important environmental hazards of mining operations and civil engineering projects. This undesirable phenomenon can be harmful for structures such as buildings, dams, mine slopes (Monjezi & Ahmadi, 2009), So the effects of blasting in quarry are air blast, fly rock and ground vibration, back breaks, noises (Manoj & Singh, 2006). Several parameters can be influenced and affected on blasting and ground vibration such as stemming, diameter of hole blast, specific charge, spacing, burden, sub-drilling, delay time. Furthermore it is important to understand the role of ground vibration and PPV in open-pit mine with rock slopes. A practicing geotechnical engineer may save time, quality and cost in dealing with blasting problems if the hazards can be predicted. The study was carried out from 12 no. of primary blasting works at a granite quarry at Ulu Tiram, Johor Bahru. Ground vibration data were obtained by using geophones installed at the quarry area. In this study, the assessment of the ground vibration induced blasting in quarry carried out by using neural network software.
STUDY METHODOLOGY The study is divided into three stages, the first stage involved the data collection, in this stage ground vibrations obtained by seismograph and geophone. Second stage included empirical formula, USBM, Ambraseys-Hendron and general empirical equation were used to investigate the ground vibration and the third stage deals with MATLAB software.
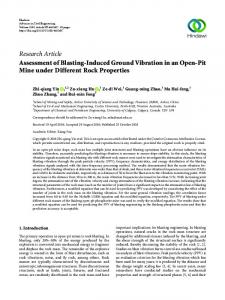
Analysis with Empirical Formula When an explosive charge detonates in the blast hole, intense dynamic stresses are set up around it due to sudden acceleration of the rockmass by detonating gas pressure on hole wall. The strain waves transmitted to the surrounding rock sets up a wave motion in the ground. The strain energy carried out by these strain waves fragments the rock mass due to different breakage mechanism such as crushing, radial cracking, and reflection breakage in the presence of a free face (Sushil, 1997). The crushed zone and radial fracture zone encompass a volume of permanently deformed rock. When the stress wave intensity diminishes to the level where no permanent deformation occurs in the rockmass (i.e., beyond the fragmentation zone), strain waves propagate through the medium as the elastic waves, oscillating the particles through which they travel (Figure 1). These waves in the elastic zone are known as ground vibration, which closely confirm to the visco-elastic behaviour (Khandelwal & Singh, 2006).
Vol. V 17 [2012], Bund.. R
257 73
Figu ure 1: Groun nd vibrationss due to blastting To T prevent vib bration probleems, various parameters p suuch as the phyysico-mechannical propertiees of rocck mass, explosives specifi fications and geometrical g aand timing asppects of the bblasting patterrn should be considerred when desiigning a blasting pattern (D Dehghani & A Ataee-pour, 2009). A number of investigators i have h studied ground vibraations from bblasting and hhave developeed theoreetical analysiis to explain n the experim mental data. USBM, Am mbraseys and Hendron annd Generral Empirical Formula are the most fam mous empiricaal formula to find the veloocity of grounnd that arre shown in Table T 1.
Table 1: Predictor P equuations
Thee values of B, K and A parrameters are shown s in Tabble 2.
Vol. V 17 [2012], Bund.. R
257 74
Tablle 2: Site Co onstants and Index of Deetermination (Id) of Diffeerent Predicttor Equationns for GRANITE
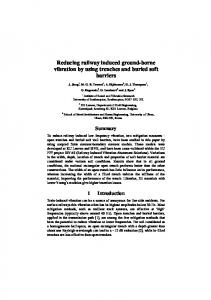
Artific cial Neurral Netwo ork Meth hod An A artificial neural n network k (ANN), usu ually called nneural networrk (NN), is a mathematical model. Every neurral network iss formed in three t layers, ccalled the inpput layer, hiddden layer, annd outpu ut layer. Each layer consistts of one or more m nodes. T The lines betw ween the noddes indicate thhe flow of o informatio on from one node n to the neext. Input layeer is actually shows differrent features oof data base b and outp put is the targ get of the each study. Hiddden layer makkes an equatiion that can bbe calcullated output layer from input layer. Input I layer inncludes 9 paarameters andd feed-forwarrd netwo ork was desig gned which had some hiidden layers with differennt neurons inn the first annd secon nd layer, and then the outp put layer is flyrock fl distannce in one layyer. The struccture of neurral netwo ork system is shown in belo ow (Figure 2)).
Figure 2: Typical Strructure and O Operation off ANNs
RE ESULTS OF GEO OSTRUC CTURAL L CHARA ACTERIZ ZATION N USBM From F the resu ults of empiriccal analysis th he variation bbetween prediictor equationns and real datta were founded. Tab ble 3 shows th he results of USBM U predicttor and real ddata.
Vol. V 17 [2012], Bund.. R
257 75
Table 3: USBM-Rea U al PPV Dataset USBM R Real PPV Number N velocity v 1 2 3 4 5 6 7 8 9 10 11 12
0.99 0.96 1.1122 1.032 1.02 1.05 0.34 0.34 0.369 0.355 0.359 0.361
0.66 0.92 0.62 0.72 1.39 0.68 0.1 0.13 0.07 0.09 0.13 0.08
Figure 3: USBM-Real PPV for 500 5 (m) and 1000 (m) froom Blastingg Area A graphical comparison off predicted and a measuredd velocities ffor USBM annd real data is shown n in Figure 3. With the USBM pred dictor equatioon results aree more than real PPV that measu ured from thee site at most data set numb bers, so the ffactor of safetty in this casee is reasonablle. It can n be shown clearly c that when w distance of recordingg and monitoring increasees, the velocitty will be b decreased. The error of this t method iss 32 %.
Vol. V 17 [2012], Bund.. R
257 76
Ambras seys-Hen ndron Frrom the resullts of empirical analysis th he variation beetween predicctor equationns and real data were founded. Tab ble 4 shows th he results of Ambraseys-He A endron predicctor and real ddata.
Table 4: AmbHen-Rea A al PPV Dataset Number 1 2 3 4 5 6 7 8 9 10 11 12
AmbHen A velocity v 0.35 0.34 0.38 0.36 0.362 0.37 0.11 0.11 0.12 0.112 0.112 0.114
R Real PPV 0.66 0.92 0.62 0.72 1.39 0.68 0.1 0.13 0.07 0.09 0.13 0.08
Figure 4: Amb bHen-Real PPV P for 500(m) and 10000(m) Distannce from Blaasting Area Figure 4 has sh hown that forr first part, reesults of Ambbraseys-Henddron for 500 m m are less thaan P and the results of second part forr 1000 m aree as the samee with real daata. The resuult real PPV showss that the preediction for 50 00 m is overeestimated by 57 % but thee prediction ffor the 1000 m
Vol. 17 [2012], Bund. R
2577
distance is quite accurate. However it indicates poor correlation between measured and predicted values of PPV.
General Empirical Equation From the results of empirical analysis the variation between predictor equations and real data were founded. Table 5 shows the results of General Empirical Equation predictor and real data.
Table 5: General Empirical-Real PPV Dataset Number 1 2 3 4 5 6 7 8 9 10 11 12
General Empirical velocity 1.711 1.653 1.975 1.801 1.785 1.843 0.662 0.656 0.856 0.687 0.684 0.7
Real PPV 0.66 0.92 0.62 0.72 1.39 0.68 0.1 0.13 0.07 0.09 0.13 0.08
Figure 5: General Empirical-Real PPV for 500m and 1000m Distance Two General Empirical Equations and Measured PPV in the site were plotted in Figure 5. This plot has shown velocities that obtained from General Empirical Equation is overestimate than real PPV, so it predict higher velocities and then Factor of safety in this method is very high. The error of this method is 63 %.
Vol. V 17 [2012], Bund.. R
257 78
Figure 6 has shown s that General G Empirrical Equationn indicate thee higher veloocities for botth 500 m m and 1000 m m compare to real data, so these results can be used for predictinng velocities iin the sitte with the hiigh factor of safety. In lieu u, USBM hass good condittion to predicct velocities foor the sitte, the resultss obtained fro om USBM aree more accuraate with the m measured PPV V monitored at site. However, H Am mbraseys-Hend dron cannot obtain o reasonaable velocitiees because ressults for 500 m from Ambraseys-H Hendron are lo ower than reaal data, so it iis not a good method to finnd velocities iin the sitte.
Figure 6: Results R of Different D PPV V Equation ffor 500 m annd 1000 m D Distance
Artific cial Neura al Netwo ork Analy ysis Velocitty Predicction In nput layer inccludes 9 paraameters and feed-forwardd network waas designed w which had tw wo hidden layers with 4 neurons in each and theen the output llayers are vellocity and frequency. In thhis case first f system was w trained an nd then validatte. Testing phhase has ignorred in this casse. Figure 7 demo onstrates the regression r an nalysis carriedd out betweenn the networkk response annd hat yielded th he correlationn coefficients 0.99815 andd 1 for traininng their corresponding real data th and validation subssets respectiv vely and 0.997 704 for the ovverall analysiss.
Vol. 17 [2012], Bund. R
2579
Figure 7: The Results of the Regression Analysis Carried Out on the Training, Validation and Overall Sets During training, in order to minimize the performance, the network weights and biases were corrected. In this study the network performance was evaluated using mean square error when compared the output and the real data. As can be seem from Figure 8 the network was trained successfully at the 21th epoch with the mean square error of 1.76 ∗ 10 and at the 17 th epoch with mean square error of 0.0025808 for best validation performance. It is observed in Figure 9 that the differences between Real PPV and the Predicted PPV from our Artificial Neural Network analysis are negligible so these two lines match almost exactly.
Vol. 17 [2012], Bund. R
Figure 8: Mean Square Error versus the Network Epochs
Figure 9: Differences of Real PPV and ANN PVV
2580
Vol. 17 [2012], Bund. R
2581
Frequency Prediction Three hidden layers with four and five neurons have predicted frequency in MATLAB. Figure 10 demonstrates the regression analysis carried out between the network response and their corresponding real data that yielded the correlation coefficients 0.98778 and 0.92661 for training and validation subsets respectively and 0.9892 for the overall analysis. Also The best validation performance is 2.3598 at epoch 21 and the mean square error for training is around 1.41 ∗ 10 at epoch 24. Figure 11 shows the performance of analyze.
Figure 10: The Results of the Regression Analysis Carried Out on the Training, Validation and Overall Sets Figure 12 described the differences between Real Frequencies and the frequency predicted form Artificial Neural Network in one graph.
Vol. 17 [2012], Bund. R
Figure 11: Mean Square Error versus the Network Epochs
Figure 12: Differences of Real and predicted Frequency
2582
Vol. 17 [2012], Bund. R
2583
CONCLUSIONS Based on the results obtained from the analyses, the following conclusions can be drawn. Peak particle velocity and frequency were obtained and monitored by seismograph and geophones that were installed at the site. USBM, Ambraseys-Hendron and General empirical equation were different vibration predictor equations used in this study. It is found that different predictors give a wide range of correlation coefficients. The calculated and observed values have also display wide variation. It is clear that a large number of factors influence the ground vibration characteristics and more factors need to be included to get more reliable predictions. Ambraseys-Hendron has lowest accuracy however USBM has more accurate results. The results of General empirical equation are with the high factor of safety and the error of USBM is lowest. So USBM indicates more accurate results. Using nine input parameters and a single output, ground vibration by blasting was predicted by ANN, using a multi-layer neural network with back propagation algorithm. The advantage of the model compared to other empirical relations used for prediction of PPV was the fact that there was no limitation in the number of input parameters. Although hole depth, hole diameter, subdrilling length and other input parameters are seldom used in majority of empirical relations, these were used here as input parameters in training of the neural network. The average relative error obtained from ANN estimation was an incredible 0.01% for velocity and a low 4% for frequency which were negligible when compared with the empirical relationships commonly used. So the results obtained from ANN are much more accurate than empirical formula.
ACKNOWLEDGEMENTS The authors are thankful to the Government of Malaysia and Research Management Centre, Universiti Teknologi Malaysia for providing the research grant.
REFERENCES 1. Ambraseys, N. R. & Hendron, A. J. (1968, in rock mechanics In Engineering Practices, edited by Stagg k.G. & Zienkiewics, O C, (John Wiley & Sons, London), 203-207. 2. Bhandari, S. (1997) Engineering Rock Blasting Operations. Netherlands: A.A. Balkema publishers. 3. Dehghani, H. and Ataee-pour, M. (2010) Developing of a Model to Predict Peak Particle Velocity in a Blasting Operation, International Journal of Rock Mechanics and Mining Sciences 48, 51-58. 4. Duvall W. I. & Petkof B. (1959) Spherical Propagation of Explosion of Generated Strain Pulses in Rocks, USBM RI 5483, 21-22. 5. Duvall W. I. & Fogleson D. E. (1962) Review of Criteria for Estimating damage to Residences from Blasting Vibration,USBM –I, 5968. 6. Indian Standard (1973) Criteria for Safety and Design of Structures Subjected Under Ground Blast, ISI. IS-6922.
Vol. 17 [2012], Bund. R
2584
7. Khandelwal, M. and Singh, T. N. (2005) Prediction of Blast Induced Ground Vibration and Frequency in Opencast Mine: A Neural Network Approach. Journal of Sound and Vibration 289, 711-725. 8. Khandelwal, M. and Singh, T. N. (2006) Evaluation of Blast-Induced Ground Vibration Predictors. Journal of Soil Dynamic and Earthquake Engineering 27, 116-125. 9. Langefors, U. & Kihlstrom, B. (1978) The Modern Techniques of Rock Blasting. John Wiely and Sons, Inc, New York, 438pp. 10. Lucca, F. J. (2003) Tight Construction Blasting: Ground Vibration Basics, Monitoring, and Prediction. Terra Dinamica LLC Publisher. 11. Monjezi, M., Ahmadi, M., Sheikhan, M., Bahrami, A. and Salimi, A. R. (2010) Predicting Blast Induced Ground Vibration Using Various Types of Neural Networks. Journal of Soil Dynamic and Earthquake Engineering 30, 1233-1236. 12. Pal Roy, P. (1993) Colliery Guardian, UK, 241(2) 63-67. 13. Pal Roy. P. (2005) Rock Blasting Effects and Operations. A.A. Balkema Publishers, Leiden, Netherlands.
© 2012 ejge