Mater. Technol. (Trans. ASME), Vol 99,. Ser H (No. 1), Jan 1977, p 2â15. 147. V. Tvergaard and A. Needleman, Analy- sis of the Cup-Cone Fracture in a Round.
ASM Handbook, Volume 22B, Modeling and Simulation: Processing of Metallic Materials D.U. Furrer and S.L. Semiatin, editors
Copyright # 2010, ASM International® All rights reserved. www.asminternational.org
Simulation of Casting and Solidification Processes Jianzheng Guo and Mark Samonds, ESI US R&D
CASTING AND SOLIDIFICATION PROCESSES are modeled in terms of thermodynamics, heat transfer, fluid flow, stress, defect formation, microstructure evolution, and thermophysical and mechanical properties (Ref 1). Simulation technologies are applied extensively in casting industries to understand the effects of alloy chemistry, heat transfer, fluid transport phenomena, and their relationships to microstructure and the formation of defects. Thanks to the rapid progress of computer calculation capability and numerical modeling technologies, casting simulation can quickly answer some critical questions concerning filling, microstructure, defects, properties, and final shape. Modeling can be used to support quality assurance and can also help to reduce the time for responding to customer inquiries. It shifts the trial-and-error procedure used on the shop floor to the computer, which does it faster, more easily, with greater transparency, and more economically. Casting simulation software has been available to the foundry industry since the 1980s. Simulation technology has come a long way since the early to mid-1980s, when the design engineer could only work with two-dimensional models. The early days focused on identifying hot spots in the casting. As the computer-aided design and numerical simulation software packages evolved, foundry engineers could increasingly make quick changes to the feeding design to fix these problems with relative ease. Most of the casting simulation packages now on the market can handle fluid flow in the mold and solidification. Today (2010), the foundry industry wants to focus on more advanced predictions, such as stress and deformation, microstructure determination, defect formation, and mechanical properties. The primary phenomenon controlling casting is the heat transfer from the metal to the mold. The heat-transfer processes are complex. The cooling rates range from an order of one-tenth to thousands of degrees per second, and the corresponding length scales extend from several meters to a few micrometers. These various cooling rates produce different microstructures
and hence a variety of mechanical properties. Solidification kinetics, including nucleation, growth, and coarsening, are now being investigated extensively. The incorporation of these principles into the more traditional thermal, fluid flow, and stress models enable quantitative predictions of microstructure and mechanical properties, such as tensile strength and elongation. The coupling of mechanical analysis with thermal analysis enables the prediction of residual stresses and distortion in the castings and molds. These predictions will enable design engineers to evaluate the effects of nonuniform properties and defects on life-cycle performance of components. Different casting processes are used to produce different kinds of casting components. Some of the most common ones are sand casting, investment casting, die casting, permanent mold casting, lost foam casting, centrifugal casting, continuous casting, and direct chill casting. Each casting process has its own features. For example, for pressure die casting machines, it is particularly important to optimize not only the casting quality but also the die behavior with respect to thermal stress and strains and life expectancy. In this article, the topic of computational thermodynamics is first reviewed. The calculation of solidification paths for casting alloys is introduced in which back diffusion is included so that the cooling condition can be accounted for. Then, a brief review of the calculation of thermophysical properties is presented. Fundamentals of the modeling of solidification processes are discussed next. The modeling conservation equations are listed. Several commonly used microstructure simulation methods are presented. Ductile iron casting is chosen as an example to demonstrate the ability of microstructure simulation. Defect prediction is one of the main purposes for casting and solidification simulation. The predictions for the major defects of a casting, such as porosity, hot tearing, and macrosegregation, are highlighted. At the end of this article, several industry applications are presented. Also see the article “Modeling of Porosity during Solidification” in this Volume.
Computational Thermodynamics Thermodynamic calculations are the foundation for performing basic materials research on the solidification of metals. It is important to have proper phase information for an accurate prediction of casting solidification (Ref 2). The method of phase diagram calculations was started by Van Laar, who computed a large number of prototype binary phase diagrams with different topological features using ideal and regular solution models. Since then, many researchers began to incorporate phase equilibrium data to evaluate the thermodynamic properties of alloys. It was not until the late 1980s that a number of phase diagram calculation software packages became available. Then, thermodynamic calculations for multicomponent systems became feasible, thanks to the rapid progress in the computer industry. Solidification proceeds at various rates for castings. Thus, the microstructure and the composition are not homogeneous throughout the casting. The solidification path determines the solidification behavior of an alloy. For complex multicomponent alloys, the solidification path is very complicated. Hence, the equilibrium of each phase at different temperatures must be calculated. The thermodynamic and the kinetic calculations are the base for the prediction of solidification. The diffusion transport in the solid phase must be solved for each element. This requires knowledge of the diffusion coefficient of the element, the length scale, and the cooling conditions. Thermodynamic modeling has recently become increasingly used to predict the equilibrium and phase relationships in multicomponent alloys (Ref 3–5). Currently, several packages are able to simulate solidification using the Scheil model and lever rule, such as ThermoCalc, Pandat, and JMatPro. It is critical to have an accurate solidification path for casting simulation (Ref 6–8). Obtaining the solidification path is very important for understanding and controlling the solidification process of the alloy. Normally, there are two
5281/10B/a0005501 2 / Simulation of Solidification ways to predict the solidification path. One is the complete equilibrium approach, which can be calculated by the lever rule. The other is the Scheil model, which assumes that the solute diffusion in the solid phase is small enough to be considered negligible and that diffusion in the liquid is extremely fast—fast enough to assume that diffusion is complete. For almost all practical situations, the solidification occurs under nonequilibrium conditions but does not follow the Scheil model. A modified Scheil model is applied in JMatPro. In this calculation, carbon and nitrogen are treated as completely diffused in the solid, which makes a great improvement, particularly for iron-base alloy solidification. In reality, there is always a finite back diffusion based on the cooling conditions (Ref 9). There is finite diffusion in the solid, or back diffusion, which is a function of the cooling rate. Back diffusion plays an important role in the calculation of segregation. There are many numerical and analytical models that attempt to handle such phenomena (Ref 10–16). For most of the models, constant partition coefficients are assumed, which is a good approximation for many alloys. Unfortunately, sometimes the partition coefficients can vary dramatically for some commercial alloys. The partition coefficient of an element in an alloy can change from less than one to greater than one, or vice versa, during solidification (Ref 17). For these cases, the analytical or earlier numerical models are no longer valid. The equilibrium of each phase at different temperatures should be calculated. This can be fulfilled by coupling with the thermodynamic calculation. Recently, researchers have started to couple thermodynamic calculations with a modified Scheil model, including back diffusion (Ref 18). Normally, the liquid is assumed to be completely mixed. The solid concentration is calculated by solving a one-dimensional diffusion equation for each element. The governing equations for conservation of species for multicomponent alloy solidification are (Ref 19): Liquid species conservation: fl
@Clj @fs SDj j ¼ ðClj � Cij Þ þ ðCs � Cij Þ @t @t L
L¼
fs l 6
where l is the secondary dendrite arm spacing, which is a function of cooling rate, l ¼ aT_ n . Here, a and n are constants determined by the alloy composition, and T_ is the cooling rate. The interfacial area concentration, S, is related to the solid volume fraction and the secondary dendrite arm spacing: S¼
2 l
Combining Eq 1 and 2 and then discretizing yields: o
fs ðCsj � Csj Þ ¼
� � SDDt j Dfs þ Ci L � � SDDt j jo Cs � Dfs Cs þ L
(Eq 3)
where the superscript “o” refers to the old value of the variable. Hence: Csj ¼
� � j o ðfs � Dfs ÞCsj þ Dfs þ SDDt Ci L fs þ SDDt L
(Eq 4)
Equation 4 is used for calculating the concentration in the solid. Notice that Eq 4 can automatically turn into the Scheil model or lever rule if the diffusion is zero or infinity: Csj ¼ Cij
when
SDDt L
! 1 (lever rule) o
Csj ¼ Csj þ ðCij � Cso ÞDfs =fs
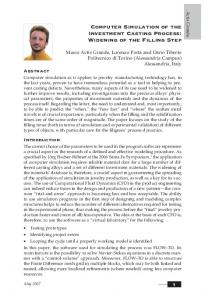
when SDDt L ¼ 0 (Scheil model) Based on mass conservation, the liquid concentration can be calculated from the solution of the solid concentration profile accordingly. Example 1: Aluminum Wrought Alloy 2219. Yan (Ref 18) did an experiment for the solidification of a quaternary Al-6.27Cu0.22Si-0.19Mg alloy (UNS A92219) with a cooling rate of 0.065 K/s. The microstructure of the solidified samples is dendritic. The calculated fraction of solid versus temperature relationship for this quaternary alloy is shown in Fig. 1. According to the Scheil model, the solidification sequence for this alloy is liquid (L) ! L + face-centered cubic (fcc) ! L + fcc + theta ! L + fcc + theta + Al5Cu2Mg8Si6(Q) ! L + fcc + theta + Al5Cu2Mg8Si6(Q) + silicon. Experimentally, there were no silicon and Al5Cu2Mg8Si6 phases formed, according to metallographic examination and electron probe microanalysis. The back diffusion model indicates that there are only fcc and theta phases formed during solidification for this cooling condition. The results predicted by the back diffusion model are in agreement with the experimental quantitative image analysis program. The measured fractions of fcc phase were compared with the calculations from the Scheil model, lever rule, and the current back diffusion model for three different cooling rates. The comparison is shown in Table 1. The fraction of fcc phase calculated from the Scheil model is less than the measured values, and the fraction of fcc calculated from the lever rule is higher than that from the experiments for all three cooling rates. The back diffusion model, which takes into account the cooling rate, gives good agreement with the experiments.
(Eq 1)
Solid species conservation: fs
� � @Csj @fs SDj ¼ ðCij � Csj Þ þ @t @t L
(Eq 2)
where j is the species index, C is concentration, D is a diffusion coefficient, f is the volume fraction of a phase, t is time, L is a diffusion length, and S is the interfacial area concentration. The subscript i refers to the solid-liquid interface, l is the liquid, and s is the solid. The diffusion length, L, can be determined using a model proposed by Wang and Beckermann (Ref 19) based on the work of Ohnaka (Ref 12) using the one-dimensional platelike dendrite geometry:
Fig. 1
Solidification paths of a 2219 aluminum alloy, temperature versus solid fraction, from two models and the lever rule. L, liquid; fcc, face-centered cubic
5281/10B/a0005501 Simulation of Casting and Solidification Processes / 3 Table 1 Comparison of experimental and calculated fraction of face-centered cubic phase (volume percent) Cooling rate, K/s
Area scan
Image analysis
Calculation
... 96.0 95.8 95.8 ...
... 95.4 95.3 94.7 ...
96.7 96.0 95.4 94.3 85.4
Lever rule 0.065 0.25 0.75 Scheil model
Thermophysical Properties The research on thermophysical properties is a very important part of materials science, particularly at the current time, because such data are a critical input for the simulation of metals processing. Lee and co-workers investigated the sensitivity of investment casting simulations to the accuracy of thermophysical properties (Ref 20). They found that the temperature prediction and thermal gradient in the liquid are the most sensitive to the accuracy of the input values used for density and thermal conductivity in the solid. Thermal conductivity in the liquid, specific heat, and density have similar levels of influence on solidification time; increasing their values increases the local solidification time. Thermal conductivity in the solid has the opposite effect compared to all the other properties studied. Accurate thermophysical data are difficult to obtain at high temperatures experimentally, especially for reactive alloys such as titaniumand nickel-base superalloys. An extensive database for the calculation of thermophysical properties has been developed (Ref 7) that uses the phase fraction information predicted with the Gibb’s free energy minimization routines developed by Lukas et al. (Ref 3) and extended by Kattner et al. (Ref 4). These properties include density, specific heat, enthalpy, latent heat, electrical conductivity and resistivity, thermal conductivity, liquid viscosity, Young’s modulus, and Poisson’s ratio. The thermodynamic calculation is based on the thermodynamic databases from CompuTherm LLC. A simple pairwise mixture model, which is similar to that used to model thermodynamic excess functions in multicomponent alloys, can be used to calculate the properties (Ref 5): P¼
X
xi Pi þ
XX i
j>i
xi xj
X
These factors can usually be ignored in the calculation of conductivity for commercial alloys. The thermal conductivity of alloys is composed of two components: a lattice component and an electronic component. In well-conducting metals, the thermal conductivity is mainly electronic conductivity. The lattice conductivity is usually very small compared to the electronic one. Hence, only the electronic component is considered here. The thermal conductivity, l, and the electrical resistivity, r, are related according to the Wiedeman-Franz-Lorenz law (Ref 23, 24): l¼
LT r
(Eq 6)
where the Lorentz constant L ¼ 2:44 � 10�11 W OK �2 , and T is the temperature. The thermal conductivity of an element can be calculated, because the electrical resistivity of pure elements can be obtained from experiments or literature. Then, the mixture model (Eq 5) can be applied for multicomponent alloys. Based on this model, an example of the calculated thermal conductivity of an aluminum casting alloy, A356 (UNS A13560), is shown in Fig. 2, with experimental results for comparison. The calculation can accurately predict the thermal conductivity variation with temperatures for this alloy in the liquid, solid, and mushy zone. Figure 3 shows the comparison with experimental results from Auburn University for various alloys at different temperatures. The agreement is good in general. Liquid Viscosity. Viscosity is an important property to be considered in dealing with fluid flow behavior. The liquid viscosity is a measure of resistance of the fluid to flow when subjected to an external force. There are two approaches
to modeling of complex alloy viscosity. One is the fundamental molecular approach, and the other is the semitheoretical procedure. The former one is based mainly on the monatomic nature. There are some models available, but most of them are still under development and do not meet the technological need. The semitheoretical method is applied here to predict the viscosity of alloys. The viscosity, Z, of pure liquid metals follows Andrade’s relationship (Ref 25): ZðT Þ ¼ Zo expðE=RT Þ
(Eq 7)
where E is the activation energy, and R is the gas constant. Figure 4 shows an example of the calculated liquid viscosity of a high-temperature nickelbase alloy, IN718, using the mixture model (Eq 5) compared with experimental results. Figure 5 shows the comparison between experimental and calculated results for various alloys at different temperatures. Density. Currently, the casting simulation models have reached the stage where one of the limiting factors in their applicability is the accuracy of the thermophysical data for the materials to be modeled. Among all the thermophysical data, the temperature-dependent density is one of the most critical ones for the accurate simulation of solidification microstructure and defect formation, such as shrinkage porosity (Ref 7). A database has been developed containing molar volume and thermal volume coefficients of expansion of liquid, solid-solution elements, and intermetallic phases. This is linked to the thermodynamic calculations mentioned previously. Volume calculations are linked to the thermodynamic models such that, when a thermodynamic calculation is made, volume can be directly calculated. The densities of the liquid and solid phases of multicomponent systems are calculated by the
Ov ðxi � xj Þv
v
(Eq 5)
where P is the phase property, Pi is the property of the pure element in the phase, Oi is a binary interaction parameter, and xi and xj are the mole fractions of elements i and j in that phase. Thermal Conductivity. The thermal conductivity mainly depends on the chemical composition of an alloy. It also depends to a lesser extent on the precipitates, bulk deformation, microstructures, and other factors (Ref 21, 22).
Fig. 2
Comparison between experimental and calculated thermal conductivity versus temperature for an aluminum casting alloy, A356
5281/10B/a0005501 4 / Simulation of Solidification very important for investment casting processes, for instance. The following summarize the basic mathematical formulations that govern the solidification process (Ref 27). Energy Equation. The equation for energy is: r
@H @H � rðkrT Þ � qðxÞ ¼ 0 þ rui @t @xi
(Eq 8)
where r is density; k is thermal conductivity; and H is enthalpy, a function of temperature that encompasses the effects of specific and latent heat if a fraction-of-solid curve is given as a function of temperature, which is the case assumed here; and: ZT HðT Þ ¼
Cp dT þ L½1 � fs ðT Þ�
(Eq 9)
0
Fig. 3
Comparison between experimental and calculated thermal conductivity for different alloys
where L is latent heat, fs is fraction of solid, ui = flui,l is the component superficial velocity, fl is the fraction of liquid, and ui,l is the actual liquid velocity. Momentum Equations. Assuming that the spatial derivatives of viscosity are small and that the fluid is nearly imcompressible, many terms in the viscous stress tensor can be neglected. The momentum equations can be simplified as: r
� � @ui @ui @ @ui m þ ruj þ pdij m ¼ rgi � ui K @t @xj @xj @xj (Eq 10)
where dij is the Kronecker delta, p is pressure, gi is gravitational acceleration, and K is permeability. The continuity equation. The equation for continuity is: @r @ðrui Þ ¼0 þ @t @xi
Fig. 4
Comparison between experimental and calculated viscosity for a nickel-base alloy, IN718
simple mixture model (Ref 26). Figure 6 shows plots comparing experimental values with calculations for the density of different alloys at different temperatures. Figure 7 shows a comparison between the calculated and experimentally reported density for a CF8M stainless steel alloy. It will increase a modeler’s confidence to have reliable calculated thermophysical properties for a casting alloy, especially at high temperatures, where it is very difficult to measure by experiment.
Fundamentals of the Modeling of Solidification Processes Casting process modeling involves the simulation of mold filling, solidification of the cast
metal, microstructure formation, stress analysis on casting and mold, and so on. At the macroscopic scale, these processes are governed by basic equations, which describe the conservation of mass, momentum, energy, and species. Heat transfer is perhaps the most important discipline in casting simulation. The solidification process depends on heat transfer from the part to the mold and from the mold to the environment. The heat can be transferred by conduction, convection, and/or radiation. Conduction refers to the heat transfer that occurs as a result of molecular interaction. Convection refers to the heat transfer that results from the movement of a liquid, such as liquid metal or air. Radiation refers to the heat transfer of electromagnetic energy between surfaces that do not require an intervening medium. Radiation is
(Eq 11)
To solve Eq 11, proper initial conditions and boundary conditions are needed. The basic initial conditions include temperature, velocity, and pressure: T ðx; 0Þ ¼ To ðxÞ uðx; 0Þ ¼ uo ðxÞ vðx; 0Þ ¼ vo ðxÞ wðx; 0Þ ¼ wo ðxÞ pðx; 0Þ ¼ po ðxÞ
Boundary Conditions. There are many kinds of boundary conditions. Some of the most common ones are: Fixed value or Dirichlet boundary condition: Y ðxÞ ¼ Yd ðxÞfðtÞ on G1
(Eq 12)
where Y(x) can be temperature, velocity, or pressure; G1 is some subset of the total boundary; Yd(x) is a specified variable vector; and f(t) is the time function.
5281/10B/a0005501 Simulation of Casting and Solidification Processes / 5 radiation directly leaving one surface that is intercepted by another. For investment casting modeling, the view factor must be calculated carefully. For that case, a view factor radiation model can be used. Anet flux model can be used for more complex view factor radiation. Rather than tracking the reflected radiant energy from surface to surface, an overall energy balance for each participating surface is considered. At a particular surface i, the radiant energy being received is denoted as qin,i. The outgoing flux is qout,i. The net radiative heat flux is the difference of these two: qnet;i ¼ qout;i � qin;i
(Eq 16)
Using the diffuse, gray-body approximation, the outgoing radiant energy can be expressed as:
Fig. 5
Comparison between experimental and calculated viscosity for different alloys at different temperatures
qout;i ¼ sei Ti4 þ ð1 � ei Þqin;i
(Eq 17)
The first term in Eq 17 represents the radiant energy, which comes from direct emission. The second term is the portion of the incoming radiant energy, which is being reflected by surface i. The incoming radiant energy is a combination of the outgoing radiant energy from all participating surfaces being intercepted by surface i. Here, the view factor, Fi�j, is the fraction of the radiant energy leaving surface j that impinges on surface i. Thus: qin;i ¼
N X
Fi�j qout;j
(Eq 18)
j¼1
where N is the total number of surfaces participating in the radiation model, and the view factors are calculated from the following integral: Fi�j ¼
1 Ai
Z Z Aj
Fig. 6
�krT � n_ ¼ qn fðtÞ on G2
(Eq 13)
where qn is the specified heat flux, n_ is a unit vector normal to the surface, and G2 is some subset of the total boundary G. Convective heat flux boundary condition: �krT � n_ ¼ qn fðtÞhfðtÞgðT Þ½T � Ta � on G2 (Eq 14)
where h is the convection coefficient, g(T) is the temperature function, and Ta is the ambient or media temperature, which could be a function of time.
N � X
Radiation heat boundary condition: �krT � n_ ¼ segðT Þ½T 4 � Ta4 � on G2
(Eq 19)
Ai
where Ai is the area of surface i, yi the polar angle between the normal of surface i and the line between i and j, and r is the magnitude of the vector between surface i and j. Then, the vector of radiosities qout,i can be solved by:
Comparison between experimental and calculated density for different alloys
Specified heat flux boundary condition:
cos yj cos yi dAi dAj pr2
(Eq 15)
where s is the Stefan-Boltzmann constant, and e is emissivity. This is a simple version of radiation in which it is assumed that there is only one ambient temperature present. Thus, the view factor is equal to one. The radiation energy exchange between two surfaces changes significantly with their relative direction. The heat exchange is maximum if two surfaces face each other perfectly. The heat exchange will be zero between two surfaces if they cannot see each other. View factor represents the fraction of the
j¼1
� Ai ei Ai dij � Ai Fi�j qout;j ¼ sT 4 ð1 � ei Þ ð1 � ei Þ i (Eq 20)
Hence, the net radiant flux is obtained by: � qnet;i ¼
� ei ½sTit � qout;i � 1 � ei
(Eq 21)
This heat flux then appears as a boundary condition for the heat conduction analysis. Based on the aforementioned equations, the basic heat-transfer and fluid flow problems can be solved with proper initial and boundary conditions.
5281/10B/a0005501 6 / Simulation of Solidification
Oj ¼
c�l;j � co;j ¼ IvðPej Þ c�l;j ð1 � kj Þ
(Eq 23)
where J = 1, n is the solute element, c�l;j is the tip liquid concentration, co,j is the nominal concentration, and kj is the partition coefficient. The Peclet number is defined as: Pej ¼
Rv 2Dj
where Dj is the diffusion coefficient. The Ivanstsov function is defined as: IvðPeÞ ¼ Pe � expðPeÞ � E1 ðPeÞ
where E1(Pe) is the first exponential integral. Assuming growth at the marginal stability limit, the dendrite radius is calculated by:
Fig. 7
Comparison between experimental and calculated density for a CF8M cast corrosion-resistant stainless steel (UNS J92900)
R¼P n j¼1
Microstructure Simulation The purpose of casting solidification micromodeling is to predict the microstructure of a casting, such as grain size. Understanding the casting solidification process and microstructure formation will greatly facilitate casting design and quality control. Computer modeling also provides the basis for computer-aided manufacturing and product life-cycle management by being able to predict mechanical properties, quality, and useful life (Ref 28–33). There are several ways to simulate microstructure formation during alloy solidification, such as the deterministic method and the stochastic method. For the deterministic method, the density of grains that have nucleated in the bulk liquid at a given moment during solidification is a deterministic function (e.g., a function of undercooling). The stochastic method is a probabilistic means to predict the nucleation and growth of the grain, including the stochastic distribution of nucleation locations, the stochastic selection of the grain orientation, and so on. The stochastic method includes cellular automata and the phase-field method.
conditions. The nucleation is based on the model proposed by Thevoz and co-workers (Ref 36), which is illustrated in Fig. 8. At a given undercooling, the grain density, n, is calculated by the integral of the nucleation site distribution from zero undercooling to the current undercooling. Thus, the density of the grain nuclei is:
nmax pffiffiffiffiffiffi 2p � DTd
!
DT Z ðtÞ
exp � 0
ðDT ðtÞ � DTn Þ2 dðDT ðtÞÞ 2DTs2 (Eq 22)
where nmax is the maximum grain nuclei density, DTd is the standard deviation undercooling, and DTn is the average undercooling. Rappaz and Boettinger (Ref 28) studied the growth of an equiaxed multicomponent dendrite. In their study, for each element, the supersaturation is:
c ð1�k Þ
(Eq 24)
o;j j mj Pej 1�ð1�k j ÞIvðPej Þ
where G is the Gibbs-Thomson coefficient. Hence, the tip velocity is: v ¼ D1 Pe1
2 R
(Eq 25)
and the tip liquid concentration will be: c�l;j ¼
nðDT ðtÞÞ ¼
�2p2 G
co;j 1 � ð1 � kj ÞIvðPej Þ
(Eq 26)
Assume the liquid concentration in the interdendritic region is uniform. The solute profiles in the extradendritic liquid region can be obtained from an approximate model (Ref 28): � Jj ¼ Dj �
c�l;j � co;j dj =2
� (Eq 27)
where the solute layer thickness is:
Deterministic Micromodeling Modeling of solidification processes and microstructural features has benefited from the introduction of averaged conservation equations and the coupling of these equations with microscopic models of solidification. When conservation equations are averaged over the liquid and solid phases, the interfacial continuity condition automatically vanishes and average entities (e.g. mean temperature or solute concentration) appear. Rappaz et al. (Ref 34, 35) proposed a model using averaging methods to predict the growth of equiaxed grains under isothermal
Fig. 8
Nucleation model. The grain density, n, is plotted versus the undercooling, DT. The derivative is plotted above.
5281/10B/a0005501 Simulation of Casting and Solidification Processes / 7 dj ¼
2Dj v
(Eq 28)
So, the solute balance will become: n n dfs X dT X � mj ðkj �1Þc�l;j þ ðfg �fs Þ mj J j ¼ 0 dt dt j¼1 j¼1
(Eq 29)
where fg is the envelope volume divided by the final grain volume. Please refer to Ref 28 for details about the derivation of the aforementioned equations. The secondary dendrite arm spacing is calculated by: l2 ¼ 5:5ðMtf Þ1=3
(Eq 30)
where: �G
M¼P n
mj ð1 � kj Þðce;j � co;j Þ=Dj 1 0n P Bj¼1 mj ð1 � kj Þce;j =Dj C C B � lnB P C A @n mj ð1 � kj Þco;j =Dj
j¼1
(Eq 31)
j¼1
Based on the aforementioned equations, the solidification of a multicomponent casting can be predicted. The averaged microstructure, such as grain size and secondary dendrite arm spacing, can be calculated based on the chemistry and cooling conditions. Some examples using such deterministic micromodeling are provided in a later section.
models have been developed over the years for the prediction of microstructure formation in casting (Ref 37–41). One example is shown in Fig. 9. Cellular automaton/finite-element models are reasonably well suited for tracking the development of a columnar dendritic front in an undercooled liquid at the scale of the shape casting (Ref 39, 40). Although these models do not directly describe the complicated nature of the solid-liquid interface that defines the dendritic microstructure, the crystallographic orientation of the grains as well as the effect of the fluid flow can be accounted for to calculate the undercooling of the mushy zone growth front. Two- and three-dimensional CAFE models were successfully applied to predict features such as the columnar-to-equiaxed transition observed in aluminum-silicon alloys (Ref 39), the selection of a single grain and its crystallographic orientation due to the competition among columnar grains taking place while directionally solidifying a superalloy into a pig-tail shape (Ref 40), as well as the effect of the fluid flow on the fiber texture selected during columnar growth (Ref 41). Coupling with macrosegregation has been developed (Ref 42), thus providing an advanced CAFE model to account for structure formation compared to purely macroscopic models developed previously (Ref 43–45). While both structure and segregation were predicted (Ref 42), comparison with experimental observation concerning structure formation was limited
due to the lack of detailed data (Ref 46). Comparison is thus mainly conducted with the ascast state. Wang et al. (Ref 47) investigated the effect of the direction of the temperature gradient on grain growth. As shown in Fig. 10(b), the temperature gradient was inclined at 45� relative to the macroscopic solidification direction, and the magnitude of the gradient was 12 K/mm. It clearly shows that the direction of the temperature gradient can affect both the macro- and microscale dendritic structures as well as the maximum undercooling. While the CA methods produce realisticlooking dendritic growth patterns and have resulted in much insight into the CET, some questions remain regarding their accuracy. Independence of the results on the numerical grid size is rarely demonstrated. Furthermore, the CA techniques often rely on relatively arbitrary rules for incorporating the effects of crystallographic orientation while propagating the solid-liquid interface. It is now well accepted that dendritic growth of crystalline materials depends very sensitively on the surface energy anisotropy (Ref 48, 49).
Phase-Field Model An alternative technique for investigating microstructure formation during solidification is the phase-field method. Phase-field models were first developed for simulating equiaxed
Cellular Automaton Models Cellular automaton (CA) models are algorithms that describe the discrete spatial and/or temporal evolution of complex systems by applying deterministic or probabilistic transformation rules to the sites of a lattice. In a CA model, the simulated domain is divided into a grid of cells, and each cell works as a small independent automaton. Variables and state indices are attributed to each cell, and a neighborhood configuration is also associated with it. The time is divided into finite steps. At a given time step, each cell automaton checks the variables and state indices of itself and its neighbors at the last time step and then decides the updated results at the present step according to the predefined transition rules. By iterating this operation with each time step, the evolution of the variables and state indices of the whole system is obtained. The CA model is usually coupled with a finite-element (FE) heat flow solver, such as the CAFE´ model developed by Rappaz and colleagues. The CA algorithm can be used to simulate nucleation and growth of grains. This model can be used to predict columnar-toequiaxed transition (CET) in alloys. Several
Fig. 9
Three-dimensional view of the final grain structure calculated in the weak coupling mode for a directionally solidified turbine blade. The pole figures are displayed for various cross sections perpendicular to the main blade axis. Source: Ref 40
5281/10B/a0005501 8 / Simulation of Solidification
Fig. 10
Cellular automaton model produces realistic dendrite growth. (a) Predicted dendritic structure density. (b) Solutal adjusted undercooling distribution under thermal conditions of 45� inclined isotherms with respect to the growth direction moving at a constant velocity of 150 mm/s. Source: Ref 47
growth under isothermal conditions (Ref 50, 51). A desirable extension of the model was to study the effect of heat flow due to the release of latent heat. A simplified approach was proposed in which the temperature was assumed to remain spatially uniform at each instant, and a global cooling rate was imposed with consideration of the heat extraction rate and increase of the fraction of solid (Ref 52). The attempt to model nonisothermal dendritic solidification of a binary alloy was made by Loginova et al. by solving both the solute and heat diffusion equations and considering the release of latent heat as well (Ref 53).
Fig. 11
Besides equiaxed growth in the supersaturated liquid, the phase-field model was also applied to the simulation of directional solidification, under well-defined thermal conditions (Ref 54, 55). The phase-field model has also been used to simulate the competitive growth between grains with different misorientations with respect to the thermal gradient (Ref 56). Further development in phase-field models includes the extension into three dimensions (Ref 57, 58) and multicomponent systems (Ref 59, 60). Usually, a regular grid composed of square elements is used in the phase-field models
(Ref 51, 52), but an unstructured mesh composed of triangular elements has also been used, which enables the phase-field method to be applicable in a domain with complex geometry shape and also in a large scale. From a physical point of view, the phase-field method requires knowledge of the physical nature of the liquid-solid interface. However, little is known about its true structure. Using Lennard-Jones potentials, molecular dynamics simulations of the transition in atomic positions across an interface have suggested that the interface width extends over several atomic dimensions (Ref 61). At present, it is difficult to obtain usable simulations of dendritic growth with interface thickness in this range due to the limitations of computational resources. Thus, the interface width will be a parameter that affects the results of the phase-field method. It should be realized that in the limit as the interface thickness approaches zero, the phase-field equations converge to the sharp interface formulation (Ref 62, 63). In contrast to CA models that adopt a pseudo-front-tracking technique, phase-field models express the solid-liquid interface as a transitional layer that usually spreads over several cells. The diffusion equation for heat and solute can be solved without tracking the phase interface using a phase-field variable and a corresponding governing equation to describe the state in a material as a function of position and time. This method has been used extensively to predict dendritic, eutectic, and peritectic growth in alloys and solute trapping during rapid solidification (Ref 64). Figure 11 shows dendrite fragmentation during reheating when an isothermally grown structure was subjected to an instantaneous increase in temperature (Ref 64). The interface between liquid and solid can be described by a smooth but highly localized change of a variable between fixed values such as 0 and 1 to represent solid and liquid phases. The problem of applying boundary conditions at an interface whose location is an unknown can be avoided. Phase-field models have recently become very popular for the simulation of microstructure evolution during solidification processes (Ref 62, 63, 65–67).
Melting of dendritic structure and formation of fragments when temperature is increased from the growth temperature of 1574 K shown in (a) to 1589 K shown at later times in (b) through (d). Source: Ref 64
5281/10B/a0005501 Simulation of Casting and Solidification Processes / 9
Fig. 12
Predicted results for two-dimensional dendritic solidification of a binary alloy into an undercooled melt with coupled heat and solute diffusion. The upper- and lower-right quadrants show the dimensionless concentration U and temperature fields, respectively; both left quadrants show concentration c/c0 fields, with different scales used in the upper and lower quadrants to better visualize the concentration variations in the solid and liquid, respectively. Source: Ref 69
While these models address the evolution of a solid-liquid interface using only one phase-field parameter, interaction of more than two phases or grains, and consequently the occurrence of triple junctions, needed to be included into the multiphase-field approach (Ref 59, 60, 68, 69). One example can be found in Fig. 12, which predicted two-dimensional dendritic solidification of a binary alloy into an undercooled melt with coupled heat and solute diffusion (Ref 69). The deterministic model is capable of tracking the evolution of the macroscale or average variables, for example, average temperature and the total fraction of solid, but it cannot simulate the structure of grains. The CA models can simulate the macro- and mesoscale grain structures, but it has difficulty in resolving the microstructure. The phase-field method can well reproduce the microstructure of dendritic grains. However, with the current computational power, phasefield models can only work well on a very small scale (up to hundreds of micrometers). The typical scale of laboratory experiments is 1 cm, and the scale of an industry problem can be up to 1 m. Both of them are beyond the capability of the phase-field method. In the industry, for larger castings, deterministic micromodeling is still a main player.
Micromodeling Applications in the Industry Here, the focus is on deterministic modeling due to its wide application in the casting industry. Thermodynamic calculations are coupled
with the macroscale thermal and fluid flow calculations (Ref 70). Ductile iron is chosen as an example to demonstrate the capability of deterministic micromodeling because of its complex solidification behavior. Ductile irons are still important engineering materials due to their high strength and toughness and relatively low price. In the foundries, ductile irons suffer from shrinkage porosity formation during solidification, which is detrimental to the mechanical properties. To minimize porosity formation, large risers are normally used in the design, which sometimes reduces porosity level but leads to a low yield. Due to the complex solidification behavior of ductile irons and their extreme sensitivity to the process, it is very difficult to optimize the casting design to ensure the soundness of castings. To better understand the shrinkage behavior of ductile iron during solidification, a micromodel was developed to simulate the microstructure formation. The density change during solidification and the room-temperature mechanical properties can be calculated based on the microstructure. The simulation has been compared with the experimental results and found to be in good agreement. Cast iron remains the most important casting material, with over 70% of the total world tonnage now (Ref 71). Based on the shape of graphite, cast iron can be lamellar (flake) or spheroidal (nodular). In the last 40 years, many papers have been published on the modeling of ductile iron solidification. It started with the computational modeling by analytical heat
transport and calculation of transformation kinetics (Ref 72–78). The computer model can calculate the cooling curve with an analytical method together with the kinetics calculation of carbon diffusion through the gamma-phase shell. In 1985, Su et al. first coupled heat transfer and a solidification kinetics model using the finite-difference method (Ref 79). Since then, many papers have been published on micromodeling of ductile iron solidification (Ref 80–89). The carbon diffusion-controlled growth through the gamma shell was modeled. In those models, the nodule count, graphite radius, and austenite shell radius were calculated. Onsoien et al. used the internal state variable approach to model the multiple phase changes occurring during solidification and subsequent cooling of near-eutectic ductile cast iron (Ref 90, 91). In their simulation, the effects on the microstructure evolution at various stages of the process by the alloy composition, graphite nucleation potential, and thermal progress were illuminated. The heat flow, fading effect, graphite/ austenite eutectic transformation, ledeburite eutectic transformation, graphite growth in austenite regime, and the eutectoid transformation were all modeled. A comprehensive micromodel is developed that can give accurate microstructure information as well as the mechanical properties, such as yield strength, tensile strength, and hardness. The density of austenite, ferrite, pearlite, graphite, liquid, and ledeburite are calculated. The prediction has been compared with the experimental results and found to be in good agreement (Ref 70). Nucleation Model. Here, Oldfield’s nucleation model is applied. In this mode, bulk heterogeneous nucleation occurs at foreign sites that are already present within the melt or intentionally added to the melt by inoculation: No ¼ AðDT Þn
(Eq 32)
where A is the nucleation constant, No is the nucleation number per unit volume, DT is the undercooling, and n is another constant that depends on the effectiveness of inoculation. Fading Effect. Fading is the phenomenon whereby the effectiveness of inoculation diminishes as the time between inoculation and casting increases. It is believed that the nucleation of graphite occurs on small nonmetallic inclusions that are entrapped in the liquid after inoculation (Ref 88). The small particles will grow with time. The particle diameter can be calculated by: d ¼ ðd3o þ ktÞ1=3
(Eq 33)
where d is the particle diameter with time, do is the particle diameter at the beginning of the inoculation, and k is a kinetic constant. Graphite/Austenite Eutectic Transformation. The eutectic growth process in ductile iron is a divorced growth of austenite and graphite, which do not grow concomitantly. At
5281/10B/a0005501 10 / Simulation of Solidification the beginning of the liquid/solid transformation, graphite nodules nucleate in the liquid and grow in the liquid to a small extent. The formation of graphite nodules and their limited growth in liquid depletes the carbon in the melt locally in the vicinity of the nodules. This facilitates the nucleation of austenite around the nodules, forming a shell. Further growth of these nodules is by diffusion of carbon from the melt through the austenite shell. When the austenite shell is formed around each nodule, the diffusion equation for carbon through the austenitic shell is solved in one-dimensional spherical coordinates. The boundary conditions are known from the phase diagram because thermodynamic equilibrium is maintained locally. Conservation of mass and solute is maintained in each grain. Because of the density variation resulting from the growth of austenite and graphite, the expansion/contraction of the grain is taken into account by allowing the final grain size to vary. Toward the end of solidification, the grains impinge on each other. This is taken into consideration by using the Johnson-Mehl approximation. Using a spherical coordinate system, a mass balance is written as: 4 4 4 rG pR3G þ rg pðR3g � R3G Þ þ rl pðR3l � R3g Þ 3 3 3 ¼ mav (Eq 34)
where rG, rg, rl are the densities of graphite, austenite, and liquid, respectively, and the calculation can be found in the next section; RG, Rg, Rl are the radii of graphite, austenite, and the final grain, respectively; and mav is the average mass of the grain. Assuming complete mixing of the solute in liquid, the overall solute balance is written as: 4 rG � 1 � pR3G þ 3
ZRa
eutectic appears in an intermediate position, the total number of ledeburite nucleation sites would be the same for graphite/austenite nodules. The grain is assumed to be spherical. Hence, the growth of the ledeburite can be calculated as: dRLE ¼ 30:0 � 10�6 �ðDT Þn dt
(Eq 36)
Thus, the fraction of ledeburite can be written as: 4 fLE ¼ pNR3LE 3
(Eq 37)
Eutectoid Transformation. The eutectoid reaction leads to the decomposition of austenite into ferrite and graphite for the case of the stable eutectoid and to pearlite for the metastable eutectoid transformation. Usually, the metastable eutectoid temperature is lower than the stable eutectoid temperature. Slower cooling rates result in more stable eutectoid structure. Following solidification, the solubility of carbon in austenite decreases with the drop in temperature until the stable eutectoid temperature is reached. The rejected carbon migrates toward graphite nodules, which are the carbon sinks. This results in carbon-depleted regions in austenite around the graphite nodules. This provides favorable sites for ferrites to nucleate, which grow as a shell around the graphite nodules. If the complete transformation of austenite is not achieved when the metastable temperature is reached, pearlite forms and grows in competition with ferrite. The ultimate goal of process modeling is to predict the final mechanical properties. The mechanical properties (hardness, tensile strength, yield strength, and elongation) of ductile iron castings are a function of composition
and microstructure. The graphite shape, graphite structure, graphite amount, carbide content, and matrix structure (pearlite, ferrite) affect the mechanical properties of ductile iron castings. As for the matrix structure, the increasing of pearlite increases the strength and hardness but reduces the elongation (Ref 92). To show the capability of this model, a simulated ductile iron casting with a simple geometry was investigated. The dimension of the casting is 10 by 10 by 200 cm. On the left face, it is cooled by contact with a constanttemperature medium (15 � C) at a heat-transfer coefficient of 500 W/m2K. All the other faces are adiabatic. The initial melt temperature is 1400 � C. According to the boundary condition, the left side cools faster than the right side. Figure 13 shows the solidification time for different distances from the cooling end. At the very left end, the solidification time is less than 1 s. On the other hand, the solidification time at 10 cm from the cooling end is more than 100 s. Because of the different cooling, the nodule count varies and is shown in the same figure. The metastable phase forms when the cooling is too fast. Figure 14 shows the volume fraction of different phases at room temperature. On the very left end, there is approximately 90% volume fraction of ledeburite phase. It reduces gradually from left to right until approximately 3 cm from the chill end. There is no ledeburite phase after 3 cm. At the same time, as cooling decreases, the volume fraction of ferrite increases and that of pearlite decreases. Ledeburite is a very hard, brittle phase. The pearlite phase is harder than ferrite. Hence, the ductility increases as the cooling rate decreases. From the micromodeling, the calculated grain and graphite radii at different distances from the chill are shown in Fig. 15. Faster cooling results in smaller grain and graphite sizes.
rg cðr; tÞ4pr2 dr Rc
(Eq 35)
4 þ rl cl pðR3l � R3g Þ ¼ cav 3
Differentiation of Eq 34 and 35 and the use of Fick’s law in spherical coordinates lead to two equations for graphite and austenite growth rates following some manipulation. Ledeburite Eutectic Transformation. When the temperature reaches below the metastable eutectic temperature, the metastable phase forms. The metastable cementite eutectic is also called ledeburite, in which small islands of austenite are dispersed in the carbide phase. It has both direct and indirect effects on the properties of ductile iron castings. Increasing the volume percent of the hard, brittle carbide results in an increase in the yield strength but a reduction in the tensile strength. Following the assumptions from Onsoien (Ref 90, 91) that the graphite/austenite nodule distribution is approximated by that of a close-packed facecentered space lattice and that the ledeburite
Fig. 13
Solidification time and nodule count at different distances from the chill (cooled end of a ductile iron casting)
5281/10B/a0005501 Simulation of Casting and Solidification Processes / 11 in the corner. The ledeburite phase reduces gradually as the cooling rate decreases. In the center of the casting, no ledeburite phase was found. The radius of the black balls, graphite, increases as cooling decreases. The structure of the metal is formed by pearlite and ferrite. Figure 19 shows the volume fraction of metastable phase (top) and the volume fraction of ferrite (bottom). It is difficult to measure the yield strength of the sample at different locations, because the strength could change dramatically based on the microstructure variation. On the other hand, hardness is an excellent indicator of strength and relatively easy to measure. Figure 20 shows the hardness measurement points on the sample. Table 2 shows the comparison between the measurement and prediction results of the hardness at different locations. It can be concluded that the prediction matches the experiments very well.
Fig. 14
Phase fractions and elongation of the casting at different distances from the chill. Faster cooling on the left side increases the presence of ledeburite phase in ductile iron. Elongation is increased where the cooling rate is slower.
Defect Prediction Defects reduce the performance and increase the cost of castings. It is critical to understand the mechanism of defects and microstructure on the performance so that an effective tool can be developed to prevent defects and control the microstructure. There are many kinds of casting defects. Those defects are dependent on the chemistry of alloys, casting design, and casting processes. Defects can be related to thermodynamics, fluid flow, thermal, and/or stress. For most cases, all of those phenomena are correlated. It is necessary to consider every aspect to prevent the formation of a defect. Here, some common casting defects in foundries are discussed. They are porosity, hot tearing, and macrosegregation.
Porosity
Fig. 15 Grain and graphite size of the casting at different distances from the chill for a ductile iron casting. The ratio of the graphite radius, Rg, to the austenite radius, Ra, is plotted and approaches a constant value. This value is determined by the carbon content of the melt. The ratio of the radii of graphite and austenite increases as cooling decreases but reaches a constant value of approximately 0.44 even though the radii of graphite and austenite still continue to increase. This constant ratio is determined by the initial carbon content. It can determine the expansion level during solidification. Based on the microstructure, the mechanical properties can be calculated. As mentioned previously, carbide increases the yield strength but decreases the tensile strength. The yield strength and hardness continuously decrease as the cooling rate decreases. The yield strength is very high on the left part because of the formation of carbide. On the other hand, the carbide decreases the tensile strength. The results are shown in Fig. 16.
Experimental Validations. A series of experiments was performed to validate the micromodel (Ref 93). The three-part cast iron foundry mold containing the gating system is shown in Fig. 17. The casting is GGG60 ductile iron. The pouring temperature is 1400 � C, the initial die temperature is 165 � C, and the initial sand temperature is 20 � C. To establish the structure of the casting and the morphology of graphite, specimens were taken as shown in Fig. 18. The specimens were then ground, polished, and etched for structure evaluation. It can be seen in the pictures of the microstructure that graphite was segregated in the form of spheroids. Because of the rapid cooling, a large amount of the metastable phase, ledeburite, was formed
Porosity formed in castings leads to a decrease in the mechanical properties (Ref 94–99). This porosity may be a combined result of solidification shrinkage and gas evolution. They can occur simultaneously when conditions are such that both may exist in a solidifying casting. One of the most effective ways to minimize porosity defects is to design a feeding system using porosity prediction modeling. In such a way, the model can determine the location of microporosity so that the feeding system can be redesigned. This process is repeated until microporosity is minimized and not likely to appear in the critical areas of the castings. There are many models that can predict the shrinkage porosity from the pressure drop during interdendritic fluid flow and gas evolution (Ref 97–104). The model of Felicelli et al. can predict the pressure and redistribution of gas and the region of possible formation of porosity by solving the transport of gas solutes (Ref 105). A comprehensive model should
5281/10B/a0005501 12 / Simulation of Solidification
Fig. 16
Mechanical properties of the casting as a function of distance from the chill for the same ductile iron casting
Fig. 19
Simulation results of fraction of metastable phase (top) and fraction of ferrite (bottom) for the same geometry as in Fig. 18
Fig. 17
Fig. 18
Experiment setup for casting of a GGG60 ductile iron (German cast iron with nodular graphite)
Microstructure of ductile iron casting from Fig. 17 die at indicated points
calculate the shrinkage porosity, gas porosity, and pore size. As for many casting defects observed in solidification processes, the mushy zone is the source of microporosity. The basic mechanism of microporosity formation is pressure drop due to shrinkage and gas segregation in the liquid (Ref 94, 95, 97). The liquid densities of many alloys are lower than that of the solid phase. Hence, solidification shrinkage happens due to the metal contraction during the phase change. The dynamic pressure within the liquid decreases because of the contraction and sometimes cannot be compensated by the metallostatic pressure associated with the height of the liquid metal. The decrease of pressure lowers the solubility of gas dissolved in the liquid. If the liquid becomes supersaturated, then bubbles can precipitate (Ref 106). Most liquid metals can dissolve some amount of gas. The solubility of gases in the solid phase is usually much smaller than that in the liquid phase. Normally, the rejected gases during solidification do not have enough time to escape from the mushy zone into the ambient air. Being trapped within the interdendritic liquid, the gas can supersaturate
the liquid and eventually precipitate under the form of pores if nucleation conditions are met. The formation of bubbles requires overcoming the surface tension (Ref 107). Homogeneous nucleation is very difficult. In castings, nucleation of pores can be expected to occur primarily on heterogeneous nucleation sites, such as the solid-liquid interface and inclusions (Ref 107, 108). Generally speaking, there are two ways to predict the level of microporosity in castings. One is a parametric method derived from first principles by using a feeding resistance criterion function combined with macroscopic heat flow calculations (Ref 109–112). Parametric models are easy to apply to shaped castings and have been mainly directed at the prediction of centerline shrinkage. Another approach is a direct simulation method (Ref 97–101, 105, 107). They usually derive governing equations based on a set of simplifying assumptions and solve the resulting equations numerically. By combining the CA technique, some models can not only predict the percentage porosity but also the size, shape, and distribution of the pores (Ref 102–104). There has been some research that attempted to understand the physics of microporosity formation, too (Ref 96). The earliest work to directly predict microporosity distribution that was general and applicable to shaped castings was done by Kubo and Pehlke (Ref 107). A more accurate fluid flow model was presented by Combeau et al. (Ref 98). In their study, the interdendritic flow for
5281/10B/a0005501 Simulation of Casting and Solidification Processes / 13 hydrogen. For example, the activity coefficient for hydrogen in an aluminum alloy is estimated as (Ref 105, 106): ln fH ¼
N X
ajH C j þ
j¼1
N X
bjH ðC j Þ2
(Eq 41)
j¼1
where ajH and bjH are interaction coefficients, and Cj is the concentration of solute element j. The detailed coefficients can be found in Ref 105 and 106. The equilibrium constant is calculated as: ln KH ¼ �3:039 �
6198:47 T
(Eq 42)
The volume fraction of gas porosity is: cl fl þ cs ð1 � fl Þ ¼ gl fl þ gs ð1 � fl � fv Þ þ a
Pg fv T (Eq 43)
where fv is the volume fraction of gas porosity, and a is the gas conversion factor. If no pore has formed yet, then: cl fl þ cs ð1 � fl Þ ¼ gl fl þ gs ð1 � fl Þ
Fig. 20
Location of hardness measurements on sample casting. See Table 2
Table 2 Comparison between measured and predicted hardness Location
1A 1B 2 3 4
(Eq 44)
Dimension x, mm
Dimension y, mm
Measurement, HB
Simulated, HB
4 10 50 50 50
4 7 4 10 48
368 313 249 236 209
371 320 255 245 203
concentration in the solid, and k is the partition coefficient. In addition to the liquid and solid fraction, which are calculated from the energy equation, the dendrite spacing is needed to estimate pore curvature and permeability in the mushy zone. The pore radius or curvature is taken to be proportional to the dendrite cell spacing through the relationship: 1 r ¼ fl d 2
three-dimensional simulations of mold filling was included but without considering microporosity. Among all these models, no one calculated the diffusion and convection of gas. Felicelli et al. (Ref 105) calculated the redistribution of gas during solidification but did not predict how much porosity forms and the sizes of the pores. To predict microporosity defects in casting processes accurately, the following factors that contribute to microporosity formation should be considered: macroscopic heat transfer, interdendritic fluid flow, gas redistribution by diffusion and convection, microstructure evolution, and microporosity growth. The conservation equation beside the equations mentioned early on is gas conservation. Gas conservation:
fvnþ1 ¼ fvn þ
where d is the secondary dendrite arm spacing. Gas Porosity Evolution. Pores will form in a solidifying alloy when the equilibrium partial pressure of gas within the liquid exceeds the local pressure in the mushy zone by an amount necessary to overcome surface tension. Hence, gas porosity develops when: Pg > Pa þ Pm þ Pd þ Pd
(Eq 39)
where Pg is Sievert pressure, Pa is ambient pressure, Pm is metallostatic pressure, Pd is pressure drop due to the friction within the interdendritic liquid, and Pd ¼ 2s r is surface tension, where s is surface tension, and r is pore radius. The maximum dissolved gas (hydrogen or nitrogen) in the liquid, gl, or solid, gs, and the gas pressure are related through Sievert’s law:
@r� c @ð1 � fl Þr þ rui rcl ¼ ð1 � kÞcl þ rðfl rrcl Þ @t @t (Eq 38)
gl ¼
where c� ¼ fl cl þ ð1 � fl Þcs , cs = kcl, cl is the gas concentration in the liquid, cs is the gas
where Kg and fg are the equilibrium constant and activity coefficient, respectively, for
Kg 1=2 P fg g
gs ¼ kgl
Shrinkage Porosity. If the pressure drops below the cavitation pressure, it is assumed that liquid feeding ceases and the solidification shrinkage in that computational cell is compensated only by pore growth. In general, cavitation pressure is very small. When the liquid pressure drops below the cavitation pressure, the porosity is determined such that it compensates for the entire solidification shrinkage within the current time step:
(Eq 40)
rnþ1 � rn rnþ1 =ð1 � fvn Þ
(Eq 45)
Experimental Validation. In this example, a set of castings with different initial hydrogen content using an iron chill plate was simulated and compared with experimental results for an A319 casting. The geometry and mesh is shown in Fig. 21. The casting is 132 mm in height, 220 mm in length, and of varying thickness. Wedges are cut horizontally at 35 mm from the bottom end and with a thickness of 12 mm. The initial pouring temperature is 750 � C. Initial hydrogen contents are 0.108, 0.152, and 0.184 ppm. The experimental and simulation results are taken at different distances from the chill end. The comparison of the value of percentage porosity against local solidification time and hydrogen content between simulation and experiment is shown in Fig. 22. It shows that increasing solidification time and hydrogen content considerably increase the percentage of porosity. Numerical simulation results give excellent agreement with the measurements of percentage of porosity. The results also show that local solidification time
5281/10B/a0005501 14 / Simulation of Solidification
Fig. 21
Finite-element geometry and mesh for a wedge-shaped aluminum A319 casting
Fig. 22
Comparison between experiment (symbols) and calculation (lines) for three initial values of hydrogen in the A319 casting
and initial hydrogen content are very important factors that influence the formation of porosity.
Macrosegregation Modeling and simulation of macrosegregation during solidification has experienced explosive growth since the pioneering studies of Flemings and co-workers in the mid-1960s (Ref 113–115). Beckermann did a comprehensive review of recent macrosegregation models and their application to relevant casting industries (Ref 116). There are numerous factors that can cause
macrosegregation during casting solidification processes. Those include thermal- and soluteinduced buoyancy, forced flow, solid movement, and so on. The application of a multiphase/multiscale macrosegregation model to predict macrosegregation during dendritic alloy solidification, including melt convection and grain movement, is illustrated in an Al-4wt%Cu alloy solidified inside a rectangular cavity cooled from the left sidewall (Ref 38). Figure 23 shows the predicted evolution of the grain density. The effects of grain movement and nucleation rate on macrosegregation are shown in Fig. 24.
Macrosegregation models have been applied extensively in the casting industry, such as steel ingot castings, continuous and direct chill castings, nickel-base superalloy single-crystal castings (freckle simulation, such as in Fig. 25, which shows the prediction of freckling in upward directional solidification of a superalloy from a two-dimensional model), and shape castings as well. Freckles have been the subject of intense research efforts for approximately 30 years due to their importance as a defect in alloy casting (Ref 117, 118). They represent a major problem in directionally solidified superalloys used in the manufacture of turbine blades (Ref 117–121). Upward directional solidification provides an effective means of producing a columnar microstructure with all the grain boundaries parallel to the longitudinal direction of the casting. In conjunction with a grain selector or a preoriented seed at the bottom of the casting, directional solidification is used to make entire castings that are dendritic single crystals. During such solidification, the melt inside the mushy zone can become gravitationally unstable due to preferential rejection of light alloy elements (for a partition coefficient less than unity) into the melt. Because the mass diffusivity of the liquid is much lower than its heat diffusivity, the segregated melt retains its composition as it flows upward and causes delayed growth and localized remelting of the solid network in the mush. Ultimately, a pencil-shaped vertical channel, devoid of solid, forms in the mushy zone, through which lowdensity, highly segregated liquid flows upward as a plume or solutal finger into the superheated melt region above the mushy zone. This flow is continually fed by segregated melt flowing inside the mushy zone radially toward the channel. At the lateral boundaries of the channel, dendrite arms can become detached from the main trunk, and those fragments that remain in the channel are later observed as freckle chains. The complex convection phenomena occurring during freckle formation represent a formidable challenge for casting simulation (Ref 17, 116, 122, 123). In 1991, Felicelli et al. simulated channel formation in directional solidification of lead-tin alloys in two dimensions (Ref 124). Since then, numerous studies have been performed to simulate and predict freckling in upward directional solidification (Ref 17, 125–134). Neilson and Incropera performed the first three-dimensional simulations of channel formation in 1993 (Ref 128). However, the coarseness of the mesh caused a serious lack of resolution and inaccuracies. Three-dimensional simulations have also been performed by Poirier, Felicelli, and co-workers for both binary and multicomponent alloys (Ref 132, 133). Figure 26 illustrates a threedimensional freckle formation prediction for a binary alloy. Freckle formation can be simulated with a commercial package, such as ProCAST.
5281/10B/a0005501 Simulation of Casting and Solidification Processes / 15
Fig. 23
Predicted evolution of grain density during equiaxed dendritic solidification of Al-4Cu (wt%) alloy with grain movement inside 5 � 10 cm rectangular cavity cooled from left sidewall. Source: Ref 38
Fig. 24
Effect of grain movement and different nucleation rates on predicted macrosegregation patterns in equiaxed dendritic solidification of Al-4Cu (wt%) alloy with grain movement inside 5 � 10 cm rectangular cavity cooled from left sidewall. Source: Ref 38
Figure 27 illustrates the freckle formation for a Pb-10%Sn binary alloy directionally solidified in a simple geometry. A temperature gradient is initially imposed to simulate a directional solidification system. Cooling is achieved by lowering the temperatures of the upper and lower walls of the cavity at a constant rate, such that the overall temperature gradient is
maintained over the height of the cavity. The lateral walls of the cavity are taken as adiabatic.
Hot Tearing Hot tearing is one of the most serious defects encountered in castings. Many studies have revealed that this phenomenon occurs in the
late stage of solidification, when the fraction of solid is close to one. The formation and propagation of hot tearing have been found to be directly affected by the cooling history, the chemical composition and mechanical properties of the alloy, as well as the geometry of the casting. Various theories have been proposed in the literature on the mechanisms of hot tearing formation. Detailed reviews on the theories and experimental observations of the formation and evolution of hot tearing can be found in Ref 135 and 136 and the references therein. Most of the existing hot tearing theories are based on the development of strain, strain rate, or stress in the semisolid state of the casting. For the strain-based theory, the premise is that hot tearing will occur when the accumulated strain exceeds the ductility (Ref 137–139). The strain-rate-based theories suggest that hot tearing may form when the strain rate, or strain-rate-related pressure, reaches a critical limit during solidification (Ref 140, 141). The stress-based criterion, on the other hand, assumes that hot tearing will start if the induced stress in the semisolid exceeds some critical value (Ref 138, 142). Although these theories were proposed independently as distinct theories, indeed, they can be considered as somewhat related due to the relationship between strain, strain rate, and stress. It is such a relationship that motivates the development of a hot tearing indicator, which uses the accumulated plastic strain as an indication of the susceptibility of hot tearing. This considers the evolution of strain, strain rate, and stress in the last stage of solidification. A Gurson type of constitutive model, which describes the progressive microrupture in the ductile and porous solid, is adopted to characterize the material behavior in the semisolid state. The proposed hot tearing indicator, while verified specifically for magnesium alloys, has a much wider application. To reliably predict the formation and evolution of hot tearing in casting by numerical simulations, it is critical to have accurate thermophysical and mechanical properties, especially in the mushy zone. It is also essential that the solidification path of the alloy be accurately described. The prediction of the thermophysical and mechanical properties has recently become possible by using the knowledge of the microstructure, phase fractions, and defects present in a metallic part (Ref 143). The solidification path can be obtained with the help of thermodynamic calculations of phase stability at given temperatures and compositions. A comprehensive multicomponent alloy solidification model, coupled with a Gibbs free-energy minimization engine and thermodynamic databases, has been developed to facilitate such calculations (Ref 7). With the integration of a back-diffusion model in the calculation, solidification conditions, such as cooling rate, can also be taken into account.
5281/10B/a0005501 16 / Simulation of Solidification
Fig. 25
Solidification of a single-crystal nickel-base superalloy. (a) Predicted velocity vectors (largest vector represents 6.3 mm/s) and solid fraction contours (in 20% increments). (b) Macrosegregation pattern (titanium concentration normalized by initial concentration in equal intervals between 0.87 and 1.34) showing freckle formation during upward directional solidification in 5 � 15 cm rectangular domain. Source: Ref 116
Hot Tearing Indicator. The constitutive model used to describe the material behavior in the semisolid state is the Gurson model (Ref 144–147), which was originally developed for studying the progressive microrupture through nucleation and growth of microvoids in the material of ductile and porous solids. When the material is considered as elasticplastic, the yield condition in the Gurson model is of the form: fðs; x; T; �ep ; Gu Þ ¼ F ðsÞ � Gu ð�; �ep ; fv Þ�ð� «p ; T Þ ¼0 (Eq 46) 1=2
where F ðsÞ ¼ ð3ðs � xÞ : ðs � xÞ=2Þ is the Mises stress in terms of the deviatoric stress s ¼ s � ðtrsÞI=3, k represents the plastic flow stress due to isotropic hardening, and x denotes back stress due to kinematic hardening. The accumulated effective plastic strain is written as: Z
t
�ep ¼
pffiffiffiffiffiffiffiffiffiffiffiffiffiffiffiffiffiffiffiffiffiffiffiffiffi ð2=3Þ«_ p : «_ p d�
(Eq 47)
in which q1 is a material constant and: f � ¼ fv f � ¼ fc þ
for fv � fc fu � fc ðfv � fc Þ fF � fc
for fv > fc
(Eq 50)
Here, fu = 1/q1, fc is the critical void volume fraction, and fF is the failure void volume fraction. Their values should be different for different materials. In this calculation for an indicator for hot tearing, constants are used. Here, q1 = 1.5, fc = 0.15, and fF = 0.25, as used in Ref 148. The Gurson coefficient characterizes the rapid loss of material strength due to the growth of void volume fraction, fv. When fv = fF, then f* = fu = 1/q1, and Gu = 0, for zero stress; that is, the stress-carrying capacity of the material vanishes. The evolution of the void volume fraction is described by the nucleation of the new void and the growth of the existing void: f_v ¼ f_nucleation þ f_growth
(Eq 51)
0
with the rate of void growth defined as:
with «_ p ¼ g_
@f @s
(Eq 48)
and g_ being the plastic flow parameter. The Gurson coefficient, Gu, is defined as: � � trðsÞ Gu ¼ �2f � q1 cosh þf1 þ ðq1 f � Þ2 g 2�
(Eq 49)
_p f_growth ¼ ð1 � f � Þtrð � � �« Þ� � 3f q1 trðsÞ � _ �f Þ sinh ¼ gð1 2k k
Fig. 26
Solidification of Pb-10Sn (wt%) in a cylinder at 10 min. (a) Isosurfaces of volume fraction of liquid and stream traces emerging from a channel. The color of the stream traces indicates the mixture concentration of tin (Sn), with corresponding levels shown in the upper color bar. The top isosurface j = 0.98, meshed to show channel penetration, is at z = 9 mm. (b) Isosurfaces of mixture concentration of tin, showing tin enrichment within channels and tin-rich plumes emerging from them. Source: Ref 133
f_nucleation ¼ e_ ht
(Eq 53)
where: (Eq 52)
In this study, the nucleation of the void is assumed to be strain controlled and is written as:
eht ¼
Z t pffiffiffiffiffiffiffiffiffiffiffiffiffiffiffiffiffiffiffiffiffiffiffiffiffi ð2=3Þ«_ p : «_ p d� tc � t � ts
(Eq 54)
tc
is defined as the hot tearing indicator. The symbol tc represents time at coherency temperature, and ts denotes time at solidus temperature. It is
5281/10B/a0005501 Simulation of Casting and Solidification Processes / 17
Fig. 27
Macrosegregation for directional solidification of a Pb-10Sn binary alloy. (a) Final tin composition after solidification. (b) Cut-off view of it
observed that the hot tearing indicator is, in fact, the accumulated plastic strain in the semisolid region, and it corresponds to the void nucleation. Therefore, it should provide a good indication for the susceptibility of hot tearing during solidification. The value of the hot tearing indicator is determined by finite-element analysis (Ref 149). For materials described by the viscoplastic or creep model, yield condition does not exist. The function j defined in Eq 46 can be used as a potential for the inelastic flow, so that the inelastic part of the strain rate can still be given in the form of Eq 48. Experiment Validation. Cao et al. performed some experiments to study hot tearing formation during solidification of binary MgAl and ternary Mg-Al-Ca alloys in a steel mold (Ref 150, 151), which is shown in Fig. 28. A hot cracking susceptibility was introduced, which is a function of maximum crack width, crack length factor, and the crack location. It
was found that it is easier to have a crack at the sprue end than at the ball end. It is less likely to have a crack in the middle of the rod. Also, the longer rod is easier to crack. Figure 29 shows the simulated results of a hot tearing indicator for a Mg-2%Al alloy casting. The computed hot tearing indicator agrees very well with the experiments. Figure 30 shows the experimental results of hot tearing at the sprue end of the rods for three different alloys. The calculated hot tearing indicators are shown in Fig. 31 accordingly. It can be seen that hot tearing is less severe as the aluminum content increases from 2 to 4% and then to 8% at the same location for the same casting with the same casting conditions. Again, the simulated hot tearing indicators agree well with the observations. The susceptibility rises sharply from pure magnesium, reaches its maximum at Mg-1%Al, and decreases gradually with further increase in the aluminum content.
The hot tearing indicator is calculated at the end of the sprue for the longest rod with a different alloy composition. For comparison, the hot tearing indicators as well as a crack susceptibility coefficient (CSC), which is defined as the temperature difference between fraction of solid at 0.9 and at the end of solidification, are shown in Fig. 32. Same as the experiment, the susceptibility of hot tearing rises sharply from pure magnesium, reaches its maximum at Mg-1%Al, and decreases gradually with further increase in the aluminum content. Similarly, different ternary magnesium alloys have different hot tearing susceptibility. The calculated CSC by this model for different alloys is shown in Fig. 33. The experimental hot tearing indicator (Ref 150, 151) is included in the same figure for comparison. The addition of calcium to magnesium-aluminum alloys can reduce the temperature range between fraction of solid at 0.9 and end of solidification, which is shown in Fig. 34; hence,
5281/10B/a0005501 18 / Simulation of Solidification
Fig. 28
Fig. 30
Steel mold for constrained rod casting. Source: Ref 150
Fig. 29
Hot tearing indicator for a Mg-2Al alloy casting
Close-up views of hot tearing (cracks) in the bottom rods near the sprue. (a) Mg-2Al. (b) Mg-4Al. (c) Mg-8Al
susceptibility to hot tearing formation will decrease as well. It indicates that the current hot tearing indicator can predict hot tearing trends very well. The alloy chemistry, casting geometry, and cooling conditions contribute to the formation of hot tearing, and they are included in this model directly or indirectly.
are presented next. First, a die casting process is modeled while focusing on the stress analysis of the casting and die and the gap formation between mold and part. Next, an example of modeling of an investment casting is presented. As mentioned earlier, radiation is very important for modeling of investment casting. In this example, radiation is discussed extensively.
Examples of Modeling Applied in Casting Industries
High- or Low-Pressure Die Casting
To demonstrate the application of modeling in the casting industry, a couple of examples
For such casting processes, metallic molds are used, occasionally with cooling or heating channels. It is called permanent mold casting
if the filling is by gravity. Otherwise, it is called die casting, for which a pressure is applied to provide rapid filling. These processes are mainly focused on high-volume components such as automobile parts. Fluid flow and stress analysis for both casting and mold are important to other casting processes. Because the molten metal is introduced into the mold by gravity, permanent mold casting flow analysis is similar to that of sand casting. However, back pressure or trapped gas cannot be ignored, because a metal mold is not permeable, unlike that of a sand mold. The flow analysis can be complicated because of the inclusion of the effect of back pressure in mold filling. If a relatively low pressure is applied to the sealed furnace, it is called a lowpressure casting process. The low pressure pushes the molten metal to fill the mold cavity slowly. For low-pressure casting filling analysis, the boundary conditions are pressure, which is a function of time instead of an inflow velocity. This is to simulate the furnace pressure controlling flow in the low-pressure casting presses. In permanent mold casting, the molds are used repeatedly. Hence, the molds develop a nonuniform temperature distribution during the initial cycles of the casting process that approaches a periodic quasi-steady-state condition. For a cyclic analysis, all casting parameters, such as the liquid pouring, dwell time, open time, and spraying conditions, must be considered for the calculation before the solidification analysis. As the modern foundry continues to evolve in implementing new technology, process modeling must also advance to meet the next
5281/10B/a0005501 Simulation of Casting and Solidification Processes / 19
Fig. 31
Hot tearing indicator in the bottom rods near the sprue developed in simulation. (a) Mg-2Al. (b) Mg-4Al. (c) Mg-8Al
indicated. Hot tearing and cracking can occur when the stresses in the local region go beyond the yield stress, thus requiring a tight coupling of the thermal and stress calculation. Another typical phenomenon involves the gap formed between casting and mold as the casting solidifies and shrinks. When this gap develops, there can be a significant reduction in heat transfer from the casting to the mold components where contact is lost (Ref 94). Conversely, there may be locations where, due to the shrinkage of the casting onto the core, an increasing contact pressure will increase the heat-transfer rate from casting to core. By accurately tracking the heat transfer, a better indication of surface shrink can be achieved. A multibody mechanical contact algorithm is employed to compute the contact and gap formation between the castings and die parts. Contact between different die parts is also considered. An automatic penalty number adjustment technique is implemented in the contact algorithm. Such a technique greatly enhances the stability and robustness of the contact computation algorithm. The variational form of the equilibrium equation with mechanical contact at any time, t, is written as (Ref 152): Z
Z Z �t � dudG s � gradðduÞdO � b � dudO � O O Gs Z xðuÞgðuÞn � dudG ¼ 0 þ Gc
(Eq 55)
Fig. 32
Comparison between hot tearing indicator (HTI) and crack susceptibility coefficient (CSC) for various aluminum contents in a magnesium alloy
hurdles facing foundry engineers. It is critical that these new hurdles—stress and deformation in the casting and mold, micro- and gas porosity, and as-cast mechanical properties—be accurately predicted and corrected. Beyond simply identifying shrink porosity and fill problems, numerical tools have been developed to predict defects at a microstructural level that can be used effectively by the foundry engineer. Knowing the answers to these questions early in the manufacturing process affords significant time- and cost-savings. The main goal of the casting process is to approach and achieve net shape. Large deformation or distortion in the part requires more rework, such as hot pressing, even after a heat
treatment operation. To aid in the understanding of why parts deform or develop residual stresses, simulation software can now predict thermally induced stresses, which include the effects of the strength or constraint of the mold. Simulating the strength of molding components has been proven as a necessary input in determining the amount of distortion in the casting, because the main prevention against significant warpage is the mold itself. Coupling the stress analysis with the thermal and fluid calculation gives a more clear understanding of the physical phenomenon. By comparing the mushy zone location and the evolution of stresses while cooling, problems such as hot tearing and cracking can be clearly
Here, a frictionless contact is considered for simplicity. In Eq 55, O represents the geometry of casting and all the mold parts, and G represents all the contact interfaces between all parts. The body forces and surface tensions are denoted by b and t, respectively. The augmented penalty function is given by x, while u is the displacement, n is the surface unit normal, g is the interface gap, and t is the surface traction. Thermal contact between parts is considered by adjusting the interface heat-transfer coefficient with respect either to the air gap width or the contact pressure, as computed by the mechanical contact algorithm. When the gap width is greater than zero, the adjusted heattransfer coefficient has the form: heff ¼
1 h0
1 1 þ ðhair þh rad Þ
(Eq 56)
where h0 is the initial value of the heat-transfer coefficient, hair is the conductivity of air divided by the gap width (if a vacuum is used, this term equates to zero), and hrad is the radiation heat-transfer coefficient. If the contact pressure is greater than zero, the effective heat transfer is increased linearly with pressure up to a maximum value. When the casting is ejected from the die, the mechanical contact is no longer applied to the
5281/10B/a0005501 20 / Simulation of Solidification point where a gap is opening up between casting and mold, assuming the presence of air. The bottom curve is from that same point but assuming a vacuum. The large variation in the coefficient illustrates the importance of accounting for local conditions. In addition, this example illustrates the value of reverse coupling of the mechanical deformations with the energy solution. This effect can be seen in Fig. 35 on the right, where the heat flux contours are plotted. The heat flux is greatest where the contact pressure is highest. Example 3: Deformation after Ejection. Postejection springback and further relaxation after mold removal can also be tracked, completing the necessary cycle to determine final part shape (Fig. 36). Finally, heat treatment processes may further define the final net shape. By appropriately simulating the thermal loading on the part during heat treatment, any additional shape change may be captured, either independent of the casting process or as a continuance of the deformation and residual-stress evolution formed from casting.
Fig. 33
Fig. 34
Comparison between hot tearing indicator (HTI) and crack susceptibility coefficient (CSC) for various magnesium alloy compositions
Solidification paths for some magnesium alloys
casting/die interfaces. Care must then be taken to apply an appropriate displacement constraint to prevent solid body movement. Example 2: Aluminum Die Casting. In this example (Fig. 35, Ref 153), a simple T-shaped casting of an A356 aluminum alloy in an H13
chromium hot work tool steel mold is simulated. The effective interface heat-transfer coefficient at two different points on the casting is plotted. The top curve is from a point experiencing increasing contact pressure as the casting contracts. The middle curve is from a
Investment Casting (Ref 154) The investment casting or lost wax process, as it is commonly called, is one of the oldest known manufacturing processes. The ability to produce near-net shapes minimizing machine cost makes the investment casting process one of the most attractive casting processes, especially for making exotic casting with expensive alloys. This process can be used to make complex shapes, from aircraft jet engine components to small, intricate castings used to make jewelry. The investment casting process does not require elaborate or expensive tooling and has the ability to produce several castings in one pour. This process is broadly described in the schematic sketch in Fig. 37. The various stages include creating the wax pattern, growing the investment shell, dewaxing, and pouring the casting. The investment casting process uses ceramic shells as molds. The ceramic shells can be preheated to very high temperatures, up to and above the liquidus temperature. Important and demanding applications of investment castings include aerospace and medical implant applications. Investment castings are commonly made from nickel-base superalloys, titanium alloys, aluminum alloys, cobalt-base alloys, and steels. Nickel-base alloys are used for jet engine structural castings as well as turbine airfoils. Structural castings normally have an equiaxed grain structure, whereas turbine airfoils have equiaxed grain, columnar grain, and singlecrystal types of structure. The unique features of the investment casting process include the use of high-temperature ceramic molds, frequently casting in a vacuum, a furnace withdrawal process for directional solidification, and strict requirements for
5281/10B/a0005501 Simulation of Casting and Solidification Processes / 21
1.40000E+03
1.20000E+03
h_eff (W/m^2 K)
1.00000E+03
8.00000E+02
Gap air Gap closed Gap vacuum
6.00000E+02
4.00000E+02
2.00000E+02
0.00000E+00 0
200
400
600
800
1000
Time (s)
Fig. 35
T-bar example shows the heat flux increasing in locations of higher contact pressure and decreasing where gaps develop
microstructure. At times, a centrifugal casting process may be used to improve mold filling. Hence, it is critical to apply some special treatments for modeling of the investment casting process. The outer contour of a shell mold generally follows the shape of the casting, unlike most other molds. Because the shape of the shell mold is determined by the procedure of repeatedly dipping the wax form into a ceramic slurry, followed by drying, it is somewhat freeform. It is thus difficult to generate a computeraided design representation of the shell geometry. Hence, it is necessary to use specialized meshing techniques to create a model of the shell. Some commercial packages can generate the shell automatically based on the investment process such that the thickness of shell will be different at different geometrical locations, such as convex sides, concave sides, flat surfaces, or some corners. Another unique feature for investment casting simulation involves solving the heattransfer problems. In general, the model should handle heat conduction in the core and the mold, convection and radiation across the metal and mold interface, and radiation and convection at the mold outer interface. If the alloys are cast in a vacuum environment, such as for most nickel- and titanium-base alloy castings, radiation heat transfer is the only method for heat loss from the mold surface to the furnace. For a radiation calculation, proper view factor calculations are very important. Sometimes, the view factors can change, for example, during the withdrawal process for direct chill and single-crystal castings. To change the cooling rate for some investment casting processes, insulation materials, such as kaowool, can be used to wrap specific areas of the shell. For such situations, this can be represented in the model by changing the shell surface emissivity or heat-transfer coefficient. The most significant mode of heat transfer in an investment casting process is through
Fig. 36
Stresses in the component (a) before and (b) after ejection
5281/10B/a0005501 22 / Simulation of Solidification
Fig. 37
Flow chart of the investment casting process
radiation. It is critical that this be fully understood and accounted for when planning the process parameters for any casting. One must understand the radiation effects during the metal pouring and cooling cycle, because selfradiation and external casting conditions will affect cooling rates and solidification patterns. Additionally, prepouring soaking determines the shell temperatures before the pour, and if this is not accurately taken into account, it will adversely affect the desired outcome. This section delves into radiation and the downstream effects in the casting of certain process scenarios:
Heat loss in the mold before pouring Self-radiation effects on solidification Cooling of the shell Pouring castings in ambient conditions versus in an enclosed chamber (i.e., a can) Effects of kaowool and other insulating media For a simulation program to model the physics of the process, the computer program must accurately mimic the various stages from wax injection to the actual pouring of the molten metal and the solidification process. In addition to the mold filling and solidification analysis, advanced computer simulation programs can also evaluate the thermally induced stress in the casting and underlying grain structure and mechanical properties of the final cast part. Accurate modeling of the trapped air and shrink porosity is critical to evaluate the existing gating system and feeder locations. Defects are usually observed in the last areas to fill, especially if the permeability of the shell is not appropriate and if the last liquid area during solidification is in the casting and not properly fed. In badly designed gating systems, the liquid metal can prematurely solidify, leading to cold laps and other such defects. It is essential
that the proper heat extraction from the casting to the investment shell is calculated. Due to the elevated temperature of the mold relative to its surroundings and the nature of the system setup, as has been previously stated, radiative heat transfer is the dominant mode of heat transfer. Because each location on the mold surface sees a different view of its environment, each will have a different rate of heat loss. For example, faces around the outer perimeter of the mold are exposed mostly to the ambient, while the view space of those facing the inside of the mold see mostly other hot regions of the casting. As a result, radiative view factor calculations are required to accurately account for the heat-exchange variations across the geometry. The initial mold temperature and heat loss to the environment prior to casting dictate the thermal profiles that exist at the time of pour. This creates a thermal gradient from the inside to the outside of the shell, depending on the self-radiating effects of the whole assembly. Most analysis packages on the market today (2010) assume basic radiation heat-transfer calculations making single-body assumptions that do not account for multiple bodies or shapes. Calculating view factors allows for multiple bodies and the shapes of those bodies to be simulated in the radiation heat transfer to give a much more precise and accurate calculation. Under a single-body assumption, each casting would heat or cool exactly the same, regardless of the casting orientation on the tree, even if it was a casting on the end of the runner or a part that was fully surrounded by other hot parts. Planning setup design for investment casting involves visualizing the “invisible” radiation heat-transfer effects. Therefore, to further understand radiation effects, analysis tools that are able to calculate the view factor radiation and shadowing effects are used to present various common investment casting scenarios.
Example 4: Radiative Cooling. A simple example given in Fig. 38 shows four test bar castings. Figure 38(a), which does not include the effects of self-radiation, shows all four test bars losing the same amount of heat at a given time. Even though the radiative heat effects are considered, there is no reflective heat from the hot surfaces; thus, all the test bars show exactly the same temperature profile, regardless of their location in the model. Figure 38(b) shows the effects of self-radiation on each specimen. As expected, the interior test samples retain heat and take longer to solidify than those on the outside, because the interior bars receive radiated heat from the test bars on either side of them. The outside bars receive heat from only one side. To prevent freezing of the metal or cold flow during filling, it is desirable to pour the casting as soon as possible when the mold is removed from the furnace. This is especially so for thin-shell molds, conductive shell material, or very thin parts. For small castings, where the mold is typically hand-moved from the furnace to the pouring bed, it is typical to have 10 to 20 s elapse before the metal is poured. Even this small amount of time can cause a significant reduction in temperature on shell faces that are open to the environment. Figures 39(a and b) show the effects of shell cooling between the time it takes the shell to be extracted from the furnace to the beginning of metal entering the mold cavity. In the casting, a 25 to 30 s time delay can cause certain regions of the casting to drop 300 to 400� . Note (Fig. 39a) how the inside walls of the shell on the end have cooled much more rapidly than the walls of central regions. With large shells or ones that must be moved from a furnace into a vacuum chamber, the elapsed time can be longer, and thus, the difference between internal shell temperatures and external temperatures may be quite large, potentially resulting in unexpected filling issues or patterns. In many investment castings, when the casting is poured, the shell glows, indicating the large amount of heat inside. During and after mold filling, solidification starts to take place. The energy content of the metal continually decreases by heat conduction through the cooler mold and by radiation from the mold surface. Exterior faces radiate this heat freely and allow for a relatively high rate of cooling. However, internal surfaces or locations where there is mostly part-to-part radiation are, in essence, insulating each other by radiating heat onto itself. It is quite common to have internal parts or parts involved in a high amount of radiation have a solidification pattern that is much different than parts that may be on the end of a row or more exposed to the ambient conditions. Therefore, it may be beneficial to design casting setups such that all of the parts experience the same heat transfer (also know as radiation) effects. By having the same cooling pattern, any changes to the design or rigging of the part
5281/10B/a0005501 Simulation of Casting and Solidification Processes / 23
Fig. 38
Test bar casting solidification time indicated by coloration. (a) Without self-radiation considered. (b) Effects of self-radiation considered
will apply evenly to each part. Otherwise, the casting engineer may be chasing a defect that occurs in one part position that does not occur in another. Example 5: Inline Gating. The case study in Fig. 40 shows an in-line gating design. The initial setup shows nine castings stacked next to
each other, with a common top-fed runner design. A coupled fluid and solidification analysis was run to understand the problems associated with molten metal flow and porosity. The computer analysis gave a very good indication of the flow pattern of the mold. The molten metal seems to fill most of the central casting
because the sprue is located right above it, then the other castings fill from the center outward. Because the central casting is already filled before the other castings, the temperature in the center casting is initially lower than the others. As the filling progresses to the entire mold cavity, the shell starts to become heated, thus reflecting heat to the outside. The central casting remains much hotter than the “outer” casting region due to the self-radiation effects. A quick look at the solidification plots shows similar results. The outside castings solidify quicker than the inside ones, even though the filling sequence was reverse. Figure 40(b) shows the porosity plot for the in-line gating design. The varying degree and size of porosity validates the fact that even though each part is exactly the same, the location on the tree greatly influences the solidification rate and porosity. Example 6: Ring Gate. To minimize the erratic flow and solidification pattern, a circular gating design is introduced. A ring gate on the top fed the castings from a central sprue. Due to the symmetric nature of the gating design, the flow pattern for the entire casting is very similar. Also, the fill rate for each part on the tree is the same, so the effects seen in the inline design, where the central casting filled much earlier than the others, is not observed. Also, due to the circular ring gate design, the radiation view factor that each part “sees” is the same for each part, leading to similar behavior in radiative and reflective heat from each other. An additional benefit of using a ring gate was that this design accommodated 12 castings on the tree instead of 9 in the in-line design. Figure 41 shows the temperature, solidification, and porosity plots of the ring gate design at a critical time in the cooling process. Although the filling pattern showed improvement with the ring gate design, the solidification pattern was similar to the one observed in the in-line design. The porosity magnitude was reduced by approximately 30% compared to the worst porosity observed in some of the inline design castings. Example 7: Selective Insulation. The casting engineer has a few variables with which to adjust and optimize when considering the rigging design. The preceding example focused on the configuration of the tree: how to place the various parts in reference to each other. The other controllable parameters are the emissivity of the shell faces, the temperature surrounding the shell (ambient or controlled enclosure temperature), and the emissivity of the casting environment (open-air cooling versus cooling in some chamber). Going to an extreme case, radiation can be eliminated by burying the shell in a sand bed. Figure 42 displays the cooling pattern on the shell for the in-line casting design when local insulation is applied on the shell. By putting a 1.2 to 2.5 cm (0.5 to 1 in.) kaowool (aluminosilicate) insulation on the critical regions to enhance the feeding of the casting, the temperature in
5281/10B/a0005501 24 / Simulation of Solidification
Fig. 39
Test bar casting temperatures (� F). (a) Cooldown inside. (b) Cooldown outside
Fig. 42
Test bar temperature plot with local insulation
resultant microstructures by controlling the amount of radiation to and from the casting. With a can, the temperature is not controlled; however, the can itself holds in heat by reflecting some of the heat back onto the part. With a casting chamber, the enclosure emissivity is controlled with specific chamber wall materials, and the temperature can be controlled with heaters or cooling systems. Other than the examples presented previously, current casting simulation technology has been applied extensively in other casting processes as well, such as sand, shell, semisolid, gravity permanent mold, lost foam, squeeze, continuous, and centrifugal castings.
Conclusions Fig. 40
Test bar. (a) Temperature plot. (b) Porosity plot
Fig. 41
Ring gate design at a critical time in the cooling process. (a) Temperature. (b) Solidification. (c) Porosity
any area of the shell can be effectively controlled by reducing the radiation heat-transfer loss through that region. To balance the cooling of the exterior faces of the shell compared to the interior shell
Modeling of casting and solidification has been used extensively in foundries to solve routine production problems. Casting defects, such as those related to filling, solidification, stress, and microstructure, can be predicted with confidence thanks to comprehensive models and the ability to compute thermophysical and mechanical properties of multicomponent alloys. As always, better understanding and accurate material properties, including mold materials, lead to improved predictive capabilities. Further development efforts should emphasize the enhancement of the accuracy of predicting and eliminating various casting defects. Coupling heat treatment simulation with casting simulation can then predict the final mechanical properties of the part in service.
locations, a can or other enclosing structure can be used to reflect radiation. Technologically advanced chambers, such as those used in single-crystal casting, are even engineered to force certain solidification behaviors and
REFERENCES 1. K.-O. Yu, Modeling for Casting and Solidification Processing, Marcel Dekker, Inc., 2002 2. Y.A. Chang, S. Chen, F. Zhang, X. Yan, F. Xie, R. Schmid-Fetzer, and W.A. Oates, Phase Diagram Calculation: Past,
5281/10B/a0005501 Simulation of Casting and Solidification Processes / 25
3.
4. 5.
6.
7.
8.
9.
10.
11.
12.
13.
14.
15.
16. 17.
Present and Future, Prog. Mater. Sci., Vol 49, 2004, p 313–345 H.L. Lukas, J. Weiss, and E.Th. Henig, Strategies for the Calculation of Phase Diagrams, CALPHAD, Vol 6 (No. 3), 1982, p 229–251 U.R. Kattner, The Thermodynamic Modeling of Multicomponent Phase Equilibria, JOM, Vol 49, 1997, p 14–19 N. Saunders and A.P. Miodownik, CALPHAD: Calculation of Phase Diagrams: A Comprehensive Guide, Elsevier Science Ltd, New York, NY, 1998, p 299–411 J. Guo and M.T. Samonds, Property Prediction with Coupled Macro-Micromodeling and Computational Thermodynamics, Model. Casting Solid. Proc., H. WengSing and Kaohsiung, Ed., Taiwan, 2004, p 157–164 J. Guo and M. Samonds, Thermophysical Property Prediction Coupled Computational Thermodynamics with Back Diffusion Consideration, J. Phase Equilib. Diff., Vol 28 (No. 1), Feb 2007, p 58–63 J. Guo and M. Samonds, The Thermophysical and Mechanical Property Prediction of Multicomponent Alloys by the Coupling of Macro-Micromodeling and Computational Thermodynamics, Modeling of Casting, Welding and Advanced Solidification Processes XI (Opio, France), 2006 N. Saunders, Z. Guo, X. Li, A.P. Miodownik, and J.-Ph. Schille, Using JMatPro to Model Materials Properties and Behavior, JOM, Dec 2003, p 65 H.D. Brody and M.C. Flemings, Solute Redistribution during Dendrite Solidification, Trans. Met. Soc. AIME, Vol 236, 1966, p 615 T.W. Clyne and W. Kurz, Solute Redistribution during Solidification with Rapid Solid State Diffusion, Metall. Trans. A, Vol 12, 1981, p 965 I. Ohnaka, Mathematical Analysis of Solute Redistribution during Solidification with Diffusion in Solid Phase, Trans. ISIJ, Vol 26, 1986, p 1045–1052 C.Y. Wang and C. Beckermann, Unified Solute Diffusion Model for Columnar and Equiaxed Dendritic Alloy Solidification, Mater. Sci. Eng., Vol 171, 1993, p 199 L. Nastac and D.M. Stefanescu, An Analytical Model for Solute Redistribution during Solidification of Planar, Columnar and Equiaxed Morphology, Metall. Trans., Vol 24, 1993, p 2107 V.R. Voller and C. Beckermann, A Unified Model of Microsegregation and Coarsening, Metall. Trans., Vol 30, 1999, p 2183 V.R. Voller, On a General Back-Diffusion Parameter, J. Cryst. Growth, Vol 226, 2001, p 562–568 M.C. Schneider, J.P. Gu, C. Beckermann, W.J. Boettinger, and U.R. Kattner,
18.
19.
20.
21.
22. 23.
24.
25.
26.
27. 28.
29.
30.
31.
Modeling of Micro- and Macrosegregation and Freckle Formation in SingleCrystal Nickel-Base Superalloy Directional Solidification, Metall. Mater. Trans. A, Vol 28, 1997, p 1517–1531 X. Yan, “Thermodynamic and Solidification Modeling Coupled with Experimental Investigation of the Multicomponent Aluminum Alloys,” Ph.D. thesis, University of Wisconsin-Madison, Madison, WI, 2001 C.Y. Wang and C. Beckermann, A Multiphase Solute Diffusion Model for Dendritic Alloy Solidification, Met. Trans. A, Vol 24, 1993, p 2787–2802 X.L. Yang, P.D. Lee, R.F. Brooks, and R. Wunderlich, The Sensitivity of Investment Casting Simulations to the Accuracy of Thermophysical Property Values, Superalloys, The Minerals, Metals & Materials Society, 2004 B. Alkan, R. Karabulut, and B. Unal, Electrical Resistivity of Liquid Metals and Alloys, Acta Phys. Pol. A, Vol 102, 2002, p 385–400 P.L. Rossiter, The Electrical Resistivity of Metals and Alloys, Cambridge University Press, New York, NY, 1987, p 137–272 A. Rudajevova, M. Stanek, and P. Lukac, Determination of Thermal Diffusivity and Thermal Conductivity of Mg-Al Alloys, Mat. Sci. Eng. A, Vol 341, 2003, p 152– 157 P.G. Klemens and R.K. Williams, Thermal Conductivity of Metals and Alloys, Int. Mat. Rev., Vol 31 (No. 5), 1986, p 197–215 D. Sichen, J. Bygden, and S. Seetharaman, A Model for Estimation of Viscosities of Complex Metallic and Ionic Melts, Met. Mat. Trans. B, Vol 25, Aug 1994, p 519–525 N. Saunders, X. Li, A.P. Miodownik, and J.P. Schille, Modeling of the Thermophysical and Physical Properties for Solidification of Al-Alloys, Light Metals, 2003, p 999–1004 ProCAST user’s manual and technical references, ESI, 2008 M. Rappaz and W.J. Boettinger, On Dendritic Solidification of Multicomponent Alloys with Unequal Liquid Diffusion Coefficients, Acta Mater., Vol 47 (No. 11), 1999, p 3205–3219 W.J. Boettinger, S.R. Coriell, A.L. Greer, A. Karma, W. Kurz, M. Rappaz, and R. Trivedi, Solidification Microstructures: Recent Developments, Future Directions, Acta Mater., Vol 48, 2000, p 43–70 J. Guo and M. Samonds, Microstructures and Mechanical Properties Prediction for Ti Based Alloys, J. Mater. Eng. Perform., May 17, 2007 J. Guo and M. Samonds, Modeling of Microstructures and Mechanical Properties of a + b Ti Based Alloys, Mater. Sci. Technol., Vol 3, 2005, p 41–50
32. A. Kermanpur, M. Mehrara, N. Varahram, and P. Davami, Improvement of Grain Structure and Mechanical Properties of a Land Based Gas Turbine Blade Directionally Solidified with Liquid Metal Cooling Process, Mater. Sci. Technol., Vol 24 (No. 1), Jan 2008, p 100–106 33. I. Steinbach, C. Beckermann, B. Kauerauf, Q. Li, and J. Guo, Three-Dimensional Modeling of Equiaxed Dendritic Growth on a Mesoscopic Scale, Acta Mater., Vol 47, 1999, p 971–982 34. M. Rappaz and P.H. Thevoz, Solute Diffusion Model for Equiaxed Dendritic Growth, Acta Metall., Vol 35, 1987, p 1487–1497 35. M. Rappaz and P.H. Thevoz, Solute Diffusion Model for Equiaxed Dendritic Growth: Analytical Solution, Acta Metall., Vol 35, 1987, p 2929–2933 36. P. Thevoz, J.L. Desbiolles, and M. Rappaz, Modeling of Equiaxed Microstructure Formation in Casting, Metall. Trans. A, Vol 20, 1989, p 311–322 37. M. Rappaz, Modelling of Microstructure Formation in Solidification Processes, Int. Mater. Rev., Vol 34, 1989, p 93 38. C.Y. Wang and C. Beckermann, Equiaxed Dendritic Solidification with Convection: Part I. Multiscale/Multiphase Modeling, Metall. Mater. Trans. A, Vol 27, 1996, p 2754–2783 39. Ch.-A. Gandin and M. Rappaz, Coupled Finite Element-Cellular Automation Model for the Prediction of Dendritic Grain Structures in Solidification Processes, Acta Metall. Mater., Vol 42, 1994, p 2233–2246 40. Ch.-A. Gandin, J.-L. Desbiolles, M. Rappaz, and P. Thevoz, Three-Dimensional Cellular Automaton-Finite Element Model for the Prediction of Solidification Grain Structures, Metall. Mater. Trans. A, Vol 30, 1999, p 3153–3165 41. H. Takatani, Ch.-A. Gandin, and M. Rappaz, EBSD Characterization and Modelling of Columnar Dendritic Grains Growing in the Presence of Fluid Flow, Acta Mater., Vol 48, 2000, p 675–688 42. G. Guillemot, Ch.-A. Gandin, and H. Combeau, Modeling of Macrosegregation and Solidification Grain Structures with a Coupled Cellular Automaton-Finite Element Model, Solidification Processes and Microstructures—A Symposium in Honor of Wilfried Kurz, TMS, Warrendale, PA, 2004, p 157–163 43. N. Ahmad, H. Combeau, J.-L. Desbiolles, T. Jalanti, G. Lesoult, J. Rappaz, M. Rappaz, and C. Stomp, Numerical Simulation of Macrosegregation: A Comparison between Finite Volume Method and Finite Element Method Predictions and a Confrontation with Experiments, Metall. Mater. Trans. A, Vol 29, 1998, p 617–630 44. J.-L. Desbiolles, P. Thevoz, and M. Rappaz, Micro-/Macrosegregation Modeling
5281/10B/a0005501 26 / Simulation of Solidification
45.
46. 47.
48. 49. 50.
51.
52.
53.
54.
55.
56.
57.
in Casting: A Fully Coupled 3D Model, Modeling of Casting, Welding and Advanced Solidification Processes X, TMS, Warrendale, PA, 2003, p 245–252 M. Bellet, V.D. Fachinotti, S. Gouttebroze, W. Liu, and H. Combeau, A 3DFEM Model Solving Thermomechanics and Macrosegregation in Binary Alloys Solidification, Solidification Processes and Microstructures—A Symposium in Honor of Wilfried Kurz, TMS, Warrendale, PA, 2004, p 41–46 D.J. Hebditch and J.D. Hunt, Observations of Ingot Macrosegregation on Model Systems, Metall. Trans., Vol 5, 1974, p 1557 W. Wang, A. Kermanpur, P.D. Lee, and M. McLean, Simulation of Dendritic Growth in the Platform Region of Single Crystal Superalloy Turbine Blades, J. Mater. Sci., Vol 38, 2003, p 4385–4391 J.S. Langer, Existence of Needle Crystals in Local Models of Solidification, Phys. Rev. A, Vol 33, 1986, p 435 D.A. Kessler and H. Levine, Velocity Selection in Dendritic Growth, Phys. Rev. B, Vol 33, 1986, p 7867 R.J. Braun, G.B. McFadden, and S.R. Coriell, Morphological Instability in Phase-Field Models of Solidification, Phys. Rev. E, Vol 49, 1994, p 4336–4352 J.A. Warren and W.J. Boettinger, Prediction of Dendritic Growth and Microsegregation Patterns in a Binary Alloy Using the Phase-Field Method, Acta Mater., Vol 43, 1995, p 689–703 W.J. Boettinger and J.A. Warren, The Phase-Field Method: Simulation of Alloy Dendritic Solidification during Recalescence, Metall. Mater. Trans. A, Vol 27, 1996, p 657–669 I. Loginova, G. Amberg, and J. Agren, Phase-Field Simulation of Nonisothermal Binary Alloy Solidification, Acta Mater., Vol 49, 2001, p 573–581 W.J. Boettinger and J.A. Warren, Simulation of the Cell to Plane Front Transition during Directional Solidification at High Velocity, J. Cryst. Growth, Vol 200, 1999, p 583–591 H.-J. Diepers, D. Ma, and I. Steinbach, History Effects during the Selection of Primary Dendrite Spacing. Comparison of Phase-Field Simulations with Experimental Observations, J. Cryst. Growth, Vol 237–239, 2002, p 149–153 J. Tiaden and U. Grafe, A Phase-Field Model for Diffusion and Curvature Controlled Phase Transformations in Steels, Proceedings of the International Conference on Solid-Solid Phase Transformations ’99 (JIMIC), M. Koiwa, K. Otsuka, and T. Miyazaki, Ed. A. Karma and W.J. Rappel, Phase-Field Method for Computationally Efficient Modeling of Solidification with Arbitrary Interface Kinetics, Phys. Rev. E, Vol 53, 1996, p 3017–3020
58. I. Steinbach, B. Kauerauf, C. Beckermann, J. Guo, and Q. Li, Three Dimensional Modeling of Equiaxed Dendritic Growth on a Mesoscopic Scale, Proceedings of the Eighth International Conference on Modeling of Casting and Welding Processes (San Diego, CA), B. G. Thomas and C. Beckermann, Ed., 1998, p 565–572 59. I. Steinbach, F. Pezzolla, B. Nestler, M. Seelberg, R. Prieler, G.J. Schmitz, and J. L.L. Rezende, A Phase Field Concept for Multiphase Systems, Physica D, Vol 94, 1996, p 135–147 60. J. Tiaden, B. Nestler, H.J. Diepers, and I. Steinbach, The Multiphase-Field Model with an Integrated Concept for Modelling Solute Diffusion, Physica D, Vol 115, 1998, p 73–86 61. J.Q. Broughton, A. Bonissent, and F.F. Abraham, The FCC (111) and (100) Crystal-Melt Interfaces: A Comparison by Molecular Dynamics Simulation, J. Chem. Phys., Vol 74, 1981, p 4029 62. A.A. Wheeler, W.J. Boettinger, and G.B. McFadden, Phase-Field Model for Isothermal Phase Transitions in Binary Alloys, Phys. Rev. A, Vol 45, 1992, p 7424–9439 63. G. Caginalp and W. Xie, Phase-Field and Sharp-Interface Alloy Models, Phys. Rev. E, Vol 48, 1993, p 1897–1910 64. W.J. Boettinger, J.A. Warren, C. Beckermann, and A. Karma, Phase-Field Simulation of Solidification, Ann. Rev. Mater. Res., Vol 32, 2002, p 163–194 65. W.J. Boettinger, A.A. Wheeler, B.T. Murray, G.B. McFadden, and R. Kobayashi, Calculation of Alloy Solidification Morphologies Using the Phase-Field Method, Modeling of Casting, Welding and Advanced Solidification Processes, 1993, p 79 66. S.G. Kim, W.T. Kim, and T. Suzuki, Phase-Field Model for Binary Alloys, Phys. Rev. E, Vol 60, 1999, p 7186 67. A. Karma, Y.H. Lee, and M. Plapp, Three-Dimensional Dendrite-Tip Morphology at Low Undercooling, Phys. Rev. E, Vol 61, 2000, p 3996 68. I. Steinbach and F. Pezzolla, A Generalized Field Method for Multiphase Transformations Using Interface Fields, Physica D, Vol 134, 1999, p 385 69. J.C. Ramirez, C. Beckermann, A. Karma, and H.-J. Diepers, Phase-Field Modeling of Binary Alloy Solidification with Coupled Heat and Solute Diffusion, Phys. Rev. E, Vol 69 (No. 52), May 2004, p 051607-1 to 051607-16 70. J. Guo, Modeling and Experimental Validation of Cast Iron Solidification, Fifth Decennial International Conference on Solidification Processing SP07, July 23– 25 2007 (University of Sheffield, U.K.) 71. D.M. Stefanescu, Solidification and Modeling of Cast Iron—A Short History of the
72. 73. 74.
75.
76.
77.
78.
79.
80.
81.
82.
83.
Defining Moments, Mater. Sci. Eng. A, Vol 413–414, 2005, p 322–333 W. Oldfield, A Qualitative Approach to Casting Solidification, ASM Trans., Vol 59, 1966, p 945 D.M. Stefanescu and S. Trufinescu, Kinetics of Solidification of Gray Iron, Z. Metall., Vol 9, 1974, p 610 H. Fredriksson and L. Svensson, Computer Simulation of Structure Formation and Segregation during the Solidification of Cast Iron, The Physical Metallurgy of Cast Iron, H. Fredriksson and M. Hillert, Ed., Elsevier, 1985, p 273–284 H. Fredriksson and L. Svensson, Simulation of Grey Cast-Iron Solidification in a Shaped Casting, Solidification Processing of Eutectic Alloys, D.M. Stefanescu, G.J. Abbaschian, and R.J. Bayuzick, Ed., The Metallurgical Society, Warrendale, PA, 1988, p 153–162 D.M. Stefanescu and C. Kanetkar, Computer Modeling of the Solidification of Eutectic Alloys: The Case of Cast Iron, Computer Simulation of Micro-Structural Evolution, D.J. Srolovitz, Ed., The Metallurgical Society, Warrendale, PA, 1985, p 171–188 J. Lacaze, M. Castro, C. Selig, and G. Lesoult, Solidification of Spheroidal Graphite Cast Irons, Modeling of Casting, Welding and Advanced Solidification Processes V, M. Rappaz, Ed., The Metallurgical Society, Warrendale, PA, 1991, p 473–478 E. Fras, W. Kapturkiewicz, and A.A. Burbielko, Micro-Macro Modeling of Casting Solidification Controlled by Transient Diffusion and Undercooling, Modeling of Casting, Welding and Advanced Solidification Processes VII, M. Croos and J. Campbell, Ed., The Metallurgical Society, Warrendale, PA, 1995, p 679–686 K.C. Su, I. Ohnaka, I. Yamauchhi, and T. Fukusako, Modelling of Solidified Structure of Castings, The Physical Metallurgy of Cast Iron, H. Fredriksson and M. Hillert, Ed., Elsevier, 1985, p 181–189 S. Chang, D. Shangguan, and D.M. Stefanescu, Prediction of Microstructural Evolution in SG Cast Iron from Solidification to Room Temperature, Metall. Trans. A, Vol 22, 1991, p 915 D.M. Stefanescu and C.S. Kanetkar, Computer Modeling of the Solidification of Eutectic Alloys: Comparison of Various Models for Eutectic Growth of Cast Iron, AFS Trans., 1987, p 139–144 L. Nastac and D.M. Stefanescu, Prediction of Gray-to-White Transition in Cast Iron by Solidification Modeling, AFS Trans., Vol 103, 1995, p 329–337 K.M. Pedersen, J.H. Hattel, and N. Tiedje, Numerical Modelling of Thin-Walled Hypereutectic Ductile Cast Iron Parts, Acta Mater., Vol 54 (No. 19), Nov 2006, p 5103–5114
5281/10B/a0005501 Simulation of Casting and Solidification Processes / 27 84. G. Lesoult, M. Castro, and J. Lacaze, Solidification of Spheroidal Graphite Cast Irons—I. Physical Modelling, Acta Mater., Vol 46 (No. 3), 1998, p 983–995 85. G. Lesoult, M. Castro, and J. Lacaze, Solidification of Spheroidal Graphite Cast Irons—II. Numerical Simulation, Acta Mater., Vol 46 (No. 3), 1998, p 997–1010 86. F.J. Bradley, A Stereological Formulation for the Source Term in Micromodels of Equiaxed Eutectic Solidification, Metall. Trans. B, Vol 24, 1993, p 539 87. R. Vijayaraghavan and F.J. Bradley, Micro-Model for Eutectoid Phase Transformations in As-Cast Ductile Iron, Scr. Mater., Vol 41 (No. 11), 1999, p 1247– 1253 88. D. Venugopalan, Prediction of Matrix Microstructure in Ductile Iron, Trans. Am. Foundrymen’s Soc., 1990, p 465 89. Q. Chen, E.W. Langer, and P.N. Hansen, Comparative Study on Kinetic Models and Their Effects on Volume Change during Eutectic Reaction of S.G. Cast Iron, Scand. J. Metall., Vol 24, 1995, p 48–62 90. M.I. Onsoien, O. Grong, O. Gundersen, and T. Skaland, Process Model for the Microstructure Evolution in Ductile Cast Iron: Part I. The Model, Metall. Mater. Trans. A, Vol 30, 1999, p 1053–1068 91. M.I. Onsoien, O. Grong, O. Gundersen, and T. Skaland, Process Model for the Microstructure Evolution in Ductile Cast Iron: Part II. Applications of the Model, Metall. Mater. Trans. A, Vol 30, 1999, p 1069–1079 92. J.R. Davis, ASM Specialty Handbook: Cast Irons, ASM International, 1996 93. V. Krutisˇ and J. Roucˇka, “Shrinkage of Graphitic Cast Irons,” internal report, ESI Group 94. J. Campbell, Castings, ButterworthHeinemann, Oxford, U.K., 1991 95. A.V. Kuznetsov and K. Vafai, Development and Investigation of Three-Phase Model of the Mushy Zone for Analysis of Porosity Formation in Solidifying Castings, Int. J. Heat Mass Transfer, Vol 38 (No. 14), Sept 1995, p 2557–2567 96. G.K. Sigworth and C. Wang, Mechanisms of Porosity Formation during Solidification: A Theoretical Analysis, Metall. Mater. Trans. B, Vol 24, April 1993, p 349–364 97. D.R. Poirier, K. Yeum, and A.L. Maples, A Thermodynamic Prediction for Microporosity Formation in Aluminum-Rich Al-Cu Alloys, Metall. Mater. Trans. A, Vol 18, Nov 1987, p 1979–1987 98. H. Combeau, D. Carpentier, J. Lacaze, and G. Lesoult, Modelling of Microporosity Formation in Aluminum Alloys Castings, Mater. Sci. Eng. A, Vol 173, 1993, p 155–159 99. P.K. Sung, D.R. Poirier, S.D. Felicelli, E.J. Poirier, and A. Ahmed, Simulations of Microporosity in IN718 Equiaxed
100.
101.
102.
103.
104.
105.
106.
107.
108. 109.
110.
111.
112.
Investment Castings, J. Cryst. Growth, Vol 226, 2001, p 363–377 J.D. Zhu and I. Ohnaka, Modeling of Microporosity Formation in A356 Aluminum Alloy Casting, Modeling of Casting, Welding and Advanced Solidification Processes V, 1991, p 435–442 S. Sabau and S. Viswanathan, Microporosity Prediction in Aluminum Alloy Castings, Metall. Mater. Trans. B, Vol 33, April 2002, p 243–255 D. See, R.C. Atwood, and P.D. Lee, A Comparison of Three Modeling Approaches for the Prediction of Microporosity in Aluminum-Silicon Alloys, J. Mater. Sci., Vol 36, 2001, p 3423–3435 R.C. Atwood and P.D. Lee, A ThreePhase Model of Hydrogen Pore Formation during the Equiaxed Dendritic Solidification of Aluminum-Silicon Alloys, Metall. Mater. Trans. B, Vol 33, April 2002, p 209–221 P.D. Lee, R.C. Atwood, R.J. Dashwood, and H. Nagaumi, Modeling of Porosity Formation in Direct Chill Cast AluminumMagnesium Alloys, Mater. Sci. Eng. A, Vol 328, 2002, p 213–222 S.D. Felicelli, D.R. Poirier, and P.K. Sung, Model for Prediction of Pressure and Redistribution of Gas-Forming Elements in Multicomponent Casting Alloys, Metall. Mater. Trans. B, Vol 31, Dec 2000, p 1283–1292 P.N. Anyalebechi, Analysis and Thermodynamic Prediction of Hydrogen Solution in Solid and Liquid Multicomponent Aluminum Alloys, Light Metals, 1998, p 827–842 K. Kubo and R.D. Pehlke, Mathematical Modeling of Porosity Formation in Solidification, Metall. Trans. B, Vol 16, June 1985, p 359–366 B. Chalmers, Principles of Solidification, John Wiley & Sons, Inc., 1964 E. Niyama, T. Uchida, M. Morikama, and S. Saito, Predicting Shrinkage in Large Steel Castings from Temperature Gradient Calculations, AFS Int. Cast Met. J., Vol 6, 1981, p 16–22 Y.W. Lee, E. Chang, and C.F. Chieu, Modeling of Feeding Behavior of Solidifying Al-7Si-0.3Mg Alloy Plate Casting, Metall. Trans. B, Vol 21, 1990, p 715– 722 V.K. Suri, A.J. Paul, N. El-Kaddah, and J. T. Berry, Determination of Correlation Factors for Prediction of Shrinkage in Castings—Part I: Prediction of Microporosity in Castings; A Generalized Criterion (AFS Research), AFS Trans., Vol 103, 1995, p 861–867 R.P. Taylor, H.T. Berry, and R.A. Overfelt, Parallel Derivation and Comparison of Feeding-Resistance Porosity Criteria Functions for Castings, HTD-Vol 323, National Heat Transfer Conference ASME, Vol 1, 1996, p 69–77
113. M.C Flemings and G.E. Nereo, Macrosegregation: Part I, Trans. Metall. Soc. AIME, Vol 239, 1967, p 1449–1461 114. M.C. Flemings, R. Mehrabian, and G.E. Nereo, Macrosegregation, Part II, Trans. Metall. Soc. AIME, Vol 242, Jan 1968, p 41–49 115. M.C. Flemings and G.E. Nereo, Macrosegregation, Part III, Trans. Metall. Soc. AIME, Vol 242, Jan 1968, p 50–56 116. C. Beckermann, Modeling of Macrosegregation: Application and Future Needs, Int. Mater. Rev., Vol 47 (No. 5), 2002, p 243– 261 117. A.F. Giamei and B.H. Kear, On the Nature of Freckles in Nickel Base Superalloys, Metall. Trans., Vol 1, 1970, p 2185–2192 118. S.M. Copley, A.F. Giamei, S.M. Johnson, and M.F. Hornbecker, The Origin of Freckles in Unidirectionally Solidified Castings, Metall. Trans., Vol 1, 1970, p 2193–2204 119. A. Hellawell, J.R. Sarazin, and R.S. Steube, Channel Convection in Partly Solidified Systems, Phil. Trans. R. Soc. (London) A, Vol 345, 1993, p 507–544 120. M.G. Worster, Convection in Mushy Layers, Ann. Rev. Fluid Mech., Vol 29, 1996, p 91–122 121. T.M. Pollock and W.H. Murphy, The Breakdown of Single-Crystal Solidification in High Refractory Nickel-Base Alloys, Metall. Mater. Trans. A, Vol 27, 1996, p 1081–1094 122. J. Guo, “Three-Dimensional Finite Element Simulation of Transport Phenomena in Alloy Solidification,” The University of Iowa, Iowa City, Iowa, 2000 123. J. Guo and C. Beckermann, ThreeDimensional Simulation of Freckle Formation during Binary Alloy Solidification: Effect of Mesh Spacing, Numer. Heat Transf. A, Vol 44, 2003, p 559–576 124. S.D. Felicelli, J.C. Heinrich, and D.R. Poirier, Simulation of Freckles during Vertical Solidification of Binary Alloys, Metall. Trans. B, Vol 22, 1991, p 847–859 125. S.D. Felicelli, D.R. Poirier, A.F. Giamei, and J.C. Heinrich, Simulating Convection and Macrosegregation in Superalloys, JOM, Vol 49 (No. 3), March 1997, p 21–25 126. P.J. Prescott and F.P. Incropera, Numerical Simulation of a Solidifying Pb-Sn Alloy: The Effects of Cooling Rate on Thermosolutal Convection and Macrosegregation, Metall. Trans. B, Vol 22, 1991, p 529–540 127. C.S. Magirl and F.P. Incropera, Flow and Morphological Conditions Associated with Unidirectional Solidification of Aqueous Ammonium Chloride, ASME J. Heat Transf., Vol 115, 1993, p 1036–1043 128. D.G. Neilson and F.P. Incropera, Effect of Rotation on Fluid Motion and Channel Formation during Unidirectional
5281/10B/a0005501 28 / Simulation of Solidification
129.
130.
131.
132.
133.
134.
135. 136.
Solidification of a Binary Alloy, Int. J. Heat Mass Transf., Vol 36, 1993, p 489– 505 D.G. Neilson and F.P. Incropera, ThreeDimensional Considerations of Unidirectional Solidification in a Binary Liquid, Numer. Heat Transf. A, Vol 23, 1993, p 1–20 H.-W. Huang, J.C. Heinrich, and D.R. Poirier, Numerical Anomalies in Simulating Directional Solidification of Binary Alloys, Numer. Heat Transf. A, Vol 29, 1993, p 639–644 S.D. Felicelli, D.R. Poirier, and J.C. Heinrich, Macrosegregation Patterns in Multicomponent Ni-Base Alloys, J. Cryst. Growth, Vol 177, 1997, p 145–161 S.D. Felicelli, J.C. Heinrich, and D.R. Poirier, Finite Element Analysis of Directional Solidification of Multicomponent Alloys, Int. J. Numer. Meth. Fluids, Vol 27, 1998, p 207–227 S.D. Felicelli, J.C. Heinrich, and D.R. Poirier, Three-Dimensional Simulations of Freckles in Binary Alloys, J. Cryst. Growth, Vol 191, 1998, p 879–888 S.D. Felicelli, D.R. Poirier, and J.C. Heinrich, Modeling Freckle Formation in Three Dimensions during Solidification of Multicomponent Alloys, Metall. Mater. Trans. B, Vol 29, 1998, p 847–855 J. Guo and J.Z. Zhu, Hot Tearing Prediction for Magnesium Alloy Castings, Mater. Sci. Forum J. Guo and J.Z. Zhu, Hot Tearing Indicator for Multi-Component Alloys Solidification, Fifth Decennial International Conference on Solidification Processing SP07, July 23–25, 2007 (University of Sheffield, U.K.)
137. A. Stangeland, A. Mo, M. M’Hamdi, D. Viano, and C. Davidson, Thermal Strain in the Mushy Zone Related to Hot Tearing, Metall. Mater. Trans. A, Phys. Metall. Mater. Sci., Vol 37 (No. 3), March 2006, p 705–714 138. D.G. Eskin, Suyitno, and L. Katgerman, Mechanical Properties in the Semi-Solid State and Hot Tearing of Aluminium Alloys, Prog. Mater. Sci., Vol 49 (No. 5), 2004, p 629–711 139. C. Monroe and C. Beckermann, Development of a Hot Tear Indicator for Steel Castings, Mater. Sci. Eng. A, Vol 413– 414, Dec 15, 2005, p 30–36 140. B. Magnin, L. Maenner, L. Katgermann, and S. Engler, Ductility and Rheology of an Al-4.5% Cu Alloy from Room Temperature to Coherency Temperature, Mater. Sci. Forum, Vol 1209, 1996, p 217–222 141. J. Zhang and R.F. Singer, Hot Tearing of Nickel-Based Superalloys during Directional Solidification, Acta Mater., Vol 50 (No. 7), April 19, 2002, p 1869–1879 142. M. Rappaz, J.M. Drezet, and M. Gremaud, New Hot-Tearing Criterion, Metall. Mater. Trans. A, Vol 30, 1999, p 449 143. J. Guo and M. Samonds, Microporosity Simulations in Multicomponent Alloy Castings, Modeling of Casting, Welding and Advanced Solidification Processes X (Sandestin, FL), D.M. Stefanescu et al., Ed., 2003, p 303–310 144. Z.L. Zhang, C. Thaulow, and J. Odegard, Complete Gurson Model Approach for Ductile Fracture, Eng. Fract. Mech., Vol 67 (No. 2), Sept 2000, p 155–168 145. J. Langlais and J.E. Gruzleski, Novel Approach to Assessing the Hot Tearing
146.
147.
148.
149. 150.
151.
152.
153.
154.
Susceptibility of Aluminium Alloys, Mater. Sci. Forum, Vol 167, 2000, p 331–337 A.L. Gurson, Continuum Theory of Ductile Rupture by Void Nucleation and Growth: Part 1—Yield Criteria and Flow Rules for Porous Ductile Media, J. Eng. Mater. Technol. (Trans. ASME), Vol 99, Ser H (No. 1), Jan 1977, p 2–15 V. Tvergaard and A. Needleman, Analysis of the Cup-Cone Fracture in a Round Tensile Bar, Acta Metall., Vol 32, 1984, p 157 A. Needleman and V. Tvergaard, Analysis of Ductile Rupture Modes at a Crack Tip, J. Mech. Phys. Solids, Vol 35, 1987, p 151 O.C. Zienkiewicz, R.L. Taylor, and J.Z. Zhu, The Finite Element Method: Its Basis and Fundamentals, Elsevier, 2005 G. Cao, S. Kou, and Y.A. Chang, Hot Cracking Susceptibility of Binary Mg-Al Alloys, Magnesium Technology 2006, A. A. Luo, Ed., TMS, 2006, p 57–61 G. Cao and S. Kou, Hot Tearing of Ternary Mg-Al-Ca Alloy Castings, Metall. Mater. Trans. A, Vol 37, Dec 2006, p 3647–3663 J.C. Simo, and T.A. Laursen, An Augmented Lagrangian Treatment of Contact Problems Involving Friction, Comput. Struct., Vol 42, 1992, p 97–116 M. Aloe, D. Lefebvre, A. Mackenbrock, A. Sholapurwalla, and S. Scott, “Advanced Casting Simulations,” internal report, ESI Group, 2006 A. Sholapurwalla and S. Scott, “Effects of Radiation Heat Transfer on Part Quality Prediction,” internal report, ESI Group, 2006