Various standardised test procedures exist to determine dishwasher wash performance (ANSI/AHAM ... The wash performance test prescribes a test procedure that will ..... Volume of water [litre] retained in cavity other than sump (e.g. on walls).
Simulation of key performance characteristics under uncertainty: dishwasher wash performance: DJ Pons and JK Raine
B11803 (Revision 3)
Simulation of key performance characteristics under uncertainty D J Pons1* and J K Raine2 1
School of Engineering, Christchurch Polytechnic Institute of Technology, Christchurch, New Zealand Department of Mechanical Engineering, University of Canterbury, Christchurch, New Zealand
2
Abstract: The engineering designer frequently has to deal with multiple uncertainties, especially at the early design stages or when working on products for which the body of knowledge is incomplete. Wash performance of dishwashers is one such case. This paper demonstrates the application of the design for system integrity (DSI) methodology to create a model to help predict wash performance. This is a complex problem because of the diverse uncertainties: stochastic, epistemic, and abstraction. The DSI model embodied the belief that two principal mechanisms contribute to wash performance: effectiveness of soil removal, and the effectiveness of the rinse process (i.e. lack of re-deposition of soil). The model was calibrated against wash data from a known machine, and then predicted the wash performance of a different brand of machine with qualitative differences in geometry. The results show that it is possible to develop models for highly uncertain systems, and this has important implications for early engineering design among other domains. Being able to simulate performance under considerable uncertainty, even if imperfectly, is potentially an important tool for the early design stages as it could (i) indicate
*
Corresponding author: School of Engineering, Christchurch Polytechnic Institute of Technology, PO Box 540, Christchurch, 8015, New Zealand. For Journal of Engineering Manufacture (Proceedings of the Institution of Mechanical Engineers Part B). First submitted 24 June 2003 as ‘Combining quantitative and qualitative variables in engineering design’, revised 28 November 2003, revised 10 March 2004.
1
Simulation of key performance characteristics under uncertainty: dishwasher wash performance: DJ Pons and JK Raine
promising design avenues, and (ii) indicate the risk in the design and the degree to which design issues have been resolved.
Keywords: epistemic, quantitative, qualitative, subjective, stochastic, uncertainty, dishwasher, wash performance, system model
1
INTRODUCTION
A persistently difficult aspect of engineering design is the need for the designer to simulate the key characteristics of a system that is inherently uncertain. This paper is the fourth in a sequence that explores the issue of uncertainty in engineering design. It addresses general problem of accommodating uncertainty in engineering and manufacturing applications, elaborates on the Design for System Integrity (DSI) methodology, and presents example simulation results from a study into dishwasher performance.
1.1
Context
The problem of having to make design decisions under uncertainty, and the associated body of literature, have been discussed in previous papers in this series. First, the general problem was described [1] as the need to ensure that a design has adequate integrity from all of several system perspectives (particularly manufacture, 2
Simulation of key performance characteristics under uncertainty: dishwasher wash performance: DJ Pons and JK Raine
market needs, performance, reliability), and through all stages of development (including specification, concept, embodiment, detail, testing, production, and sales). Second, the effectiveness of various methodologies for handling quantitative variables was discussed [2], with particularly emphasis on how Monte Carlo analysis, fuzzy theory, and DSI accommodate probabilistic (as opposed to deterministic) variables when the system relationships are expressible mathematically. The third paper [3] identified the various dimensions of uncertainty and presented methods whereby simulation systems could cope with qualitative variables (e.g. text) under imperfect knowledge of system behaviour.
1.2
Types of uncertainty
In the context of this work ‘uncertainty’ is differentiated into three independent types [3]: (1)
Epistemic uncertainty (e.g. objective vs subjective knowledge) describes the degree to which the body of knowledge has identified the input variables and can adequately predict system behaviour from them. Low epistemic uncertainty exists when the underlying physical phenomena are well understood and may be applied with high validity. The opposite is where knowledge is subjective and limited to expert opinion.
(2)
Stochastic uncertainty (e.g. deterministic vs probabilistic) describes the uncertainty about the precise value that the variable will take. In engineering it also arises from design indecision about the precise setting for a variable, 3
Simulation of key performance characteristics under uncertainty: dishwasher wash performance: DJ Pons and JK Raine
and in production it arises as process variability. It also arises from the variability of use or environment to which a machine is exposed. Both quantitative and qualitative variables (see below) may have stochastic uncertainty. (3)
Abstraction uncertainty describes a range of variable type from quantitative (numerical) to qualitative (nominal, textual). Qualitative variables appear in many engineering problems as descriptive text, e.g. the type of soil on dishware, and cannot always be converted to a numerical value.
Engineering problems readily exhibit all three types of uncertainty. For example, a designer could be trying to anticipate dishwasher performance from expert opinion (subjective knowledge with high epistemic uncertainty) for a type of soil (qualitative variable with high abstraction uncertainty) for which the mixture of constituents is uncertain due to variable user behaviour (stochastic uncertainty).
1.3
Existing approaches
The simultaneous occurrence of all three types of uncertainty in an engineering design problem is particularly vexatious. The conventional approach is to use scientific research to expand the body of knowledge. This requires identification of the variables affecting performance, experimentation to elucidate the underlying mechanics (including the relationships between the variables), and the development of a mathematical model with predictive power. The model would then be 4
Simulation of key performance characteristics under uncertainty: dishwasher wash performance: DJ Pons and JK Raine
interrogated to explore and optimise the design space. Many such systematic modelling methodologies exist and sufficiently mature to be embodied in software for engineering design use. Mature methods (and some prototypes) include those that model function [e.g. 4, 5, 6, 7, 8, 9, 10], measurement/control [e.g. 11], mathematics [e.g. 12], and mechanical event simulation with multi-physics [e.g 13].
While powerful, all these methods have the limitation of requiring that the system physics be well established, i.e. that epistemic uncertainty be negligible. In mechanical engineering systems this invariably requires experimentation, in turn requiring changes to hardware configurations. This process requires significant research resources which may be difficult to obtain. The reality is that the epistemic uncertainty in complex engineering systems cannot always be sufficiently eliminated. Consequently, the above conventional approaches may sometimes provide simplistic or inaccurate system models.
Even where epistemic uncertainty is negligible, there is still the residual problem that the variables in engineering systems usually present with stochastic uncertainty. Probabilistic computation mechanisms such as Monte Carlo analysis [14] are available to accommodate this, but only if there is no epistemic uncertainty. The presence of qualitative variables (abstraction uncertainty) further compounds the difficulty for the conventional engineering approaches.
Artificial intelligence (AI) strategies can accommodate the abstraction uncertainty. One established approach is to express the relationships as logical rules, and then 5
Simulation of key performance characteristics under uncertainty: dishwasher wash performance: DJ Pons and JK Raine
use an expert system [15, 16] to predict the consequences of various design changes (e.g. automotive design [17, 18]). Another approach is to measure the system output performance for given input variables, and then use a neural network [19, 20] to predict the performance for other values of those variables. This does not require that the internal relationships of the system be elucidated, but it does require a large case base of data in order to train the network. It can also be a brittle solution as the input and output variables cannot be redefined without retraining the network. A related method is genetic algorithms [21] which have been used in engineering concept design to search for possible solutions given qualitative variables and an evaluation criterion, e.g. [22]. A major limitation of all these approaches are that they accept stochastic uncertainty weakly, if at all.
Fuzzy theory can be a strong candidate for modelling uncertain system behaviour as it accepts stochastic uncertainty and to a lesser degree abstraction uncertainty too. A good example in the engineering design area would be the work of Antonsson and colleagues on the method of imprecision [23, 24]. However, fuzzy theory has the significant limitation of requiring that qualitative variables be ordered, but problems do not always present this way. It also requires low epistemic uncertainty.
Decision theory [25] can cope with all three types of uncertainty, at least to some degree. It accommodates subjective knowledge, and qualitative variables with stochastic uncertainty. As the name suggests, it is widely used to model decision problems (often financial) and risk. It is not well established in the engineering domain, presumably because it is weak at dealing with objective knowledge and 6
Simulation of key performance characteristics under uncertainty: dishwasher wash performance: DJ Pons and JK Raine
quantitative variables. Nonetheless, as shown in previous papers in this series, it is possible to obtain the functionality of both decision theory and probabilistic computation by using discrete combinatorial methods such as embodied in DSI [3].
DSI accommodates all three types of uncertainty, and is therefore an improvement over past practices. It is a methodology that supports engineering designers and managers by providing a probabilistic computation engine that permits both quantitative and qualitative random variables to be propagated through a system model, where that system model can also be uncertain. For quantitative variables DSI uses a numerical combinatorial approach on discretised input probability distributions, while qualitative variables are accommodated through a decision table. These methods are different manifestations of the underlying principle of discrete combination, and so the methods are closely integrated. DSI is not simply a Monte Carlo processor bolted onto a Decision table.
2
PROBLEM DEFINITION
The example system under consideration is the domestic dishwasher, and specifically the prediction of wash performance under complex uncertainty.
It is a familiar household appliance, and one might expect there to be a well established body of knowledge surrounding it. Indeed, the same design configuration is almost universally used: a wash cavity with a door (hinged at the bottom) and lip 7
Simulation of key performance characteristics under uncertainty: dishwasher wash performance: DJ Pons and JK Raine
seals, racks for dishware and spray arms to wet the dishware, a main wash pump and a drain pump, dispensers for detergent and rinse aid, electric heater element in the bottom of the wash cavity, electrical/electronic controller, and user interface. Dishwashers of fifty years ago have the same layout and operating principle. The improvements over the years have been incremental changes in performance and efficiencies in manufacture.
Despite the maturity of the design, it is surprising how little is actually known about the operating physics. This deficiency is beginning to be problematic for a manufacturing industry that operates in a mature product life stage, characterised by large volumes with relatively low profit per item, and significant global competition from similar products. Manufacturers now seek to differentiate their product from the many others on the market by cost or small performance improvements.
The primary engineering performance metrics of interest are noise, energy usage, water usage, washing performance, and drying performance. To this must be added the social performance metric of style, which is particularly important where products are positioned to sell at a financial premium. While manufacturers frequently refresh the style of their product, this is usually only superficial in an engineering sense. There is limited opportunity for substantial differentiation by product style because a dishwasher is highly constrained: required to fit into a welldefined cavity in kitchen joinery, and present only one basically flat face to the user. Consequently, manufacturers have little choice but to put significant effort into improving one of the above engineering metrics, or adding functionality (e.g. water 8
Simulation of key performance characteristics under uncertainty: dishwasher wash performance: DJ Pons and JK Raine
softener, electronic user interface features), and/or reducing cost.
Simulation of wash performance was selected as the example for this work because this is the dominant performance metric for a dishwasher, and the primary reason for purchase. Wash performance is typically measured as the amount of soil left on dishes after washing. It is varies significantly between different design configurations, and thus still offers opportunity for product differentiation. However, most designers are not focussed on improving only wash performance, but rather a cluster of interdependent characteristics. For example, it is known that decreasing water jet velocity reduces noise (desirable), but decreases wash performance (undesirable). Likewise increasing wash time, water temperature, number of rinse cycles and water volume all improve wash performance but worsen the energy or water consumption. Trying to differentiate a product by one of these characteristics immediately raises the problem for the designer of ensuring that the other characteristics are not too badly affected. This is a delicate optimisation problem. Yet there is no established methodology for assisting this process, which is surprising given the maturity of the industry.
There is no mechanism in the industry for simulating how a different design configuration will affect wash performance and other metrics. Instead the industry relies on manufacture of physical prototypes and their subsequent testing. Trends and statistical inferences are then made from the resulting data. However, data from prototypes are not necessarily robust as wash performance is notoriously variable even within a product type. Furthermore, these data are not published, due to the 9
Simulation of key performance characteristics under uncertainty: dishwasher wash performance: DJ Pons and JK Raine
competitive environment of the industry. Consequently, the literature on wash performance is non-existent. The principles behind important metrics such as wash performance are undocumented. There has been work in isolated areas such as manufacturability [26]. However, system models that can predict dishwasher wash performance or other metrics are lacking.
Various standardised test procedures exist to determine dishwasher wash performance (ANSI/AHAM [27]) or other metrics such as safety (UL 749 [28]) or energy usage [29]. The wash performance test prescribes a test procedure that will give a quantitative percentage for "wash index". However, this is not usable as the basis for a simulation system as it requires a complete working physical model, contains no underlying body of knowledge about wash performance, and neither identifies the variables nor the relationships between them.
Current understanding of dishwasher wash performance is therefore best described as qualitative expert opinion within insulated commercial enterprises.
A familiar challenge for engineering designers in all domains is the need to work at or beyond the limits of an existing body of knowledge. They have to make design decisions even if information is complete and the system behaviour cannot be simulated. This situation occurs in innovative design, as well as in the mature industries described above.
The hypothesis in this paper was that the DSI methodology could simulate the key 10
Simulation of key performance characteristics under uncertainty: dishwasher wash performance: DJ Pons and JK Raine
characteristic of wash performance despite the multiple dimensions of uncertainty. This is worth doing as designers need optimise this characteristic even if other product differentiating features (e.g. additional functionality, lower cost, lower energy usage, lower noise) are introduced. As dishwasher design is dominated by relatively large, and hence costly, plastic injection mouldings and pressed sheet metal parts, early optimisation of the design has large potential economic value for the manufacturer. A corollary is that remedial design work is expensive when changes are required to large parts late in the finalisation of the manufacturing processes, though early simulation may prevent this.
3
DEVELOPMENT OF WASH PERFORMANCE MODEL
To predict wash performance at early design it was necessary to address two critical questions: what variables affect wash performance, and what are the relationships between these variables (i.e. how can they be used to predict wash performance)? These are challenging questions given the existing uncertainties.
3.1
Method
The approach taken here was to distinguish between the various types of uncertainty, identify where they contribute to the problem, and then develop a model with a system that could accommodate these diverse uncertainties. 11
Simulation of key performance characteristics under uncertainty: dishwasher wash performance: DJ Pons and JK Raine
The input variables and relationships were derived from expert opinion, and uncertain opinion at that. The uncertainties in the problem include all the different dimensions identified above: type of data, random uncertainty, design indecisiveness, and subjectivity of knowledge. Quantitative information and objective relationships were included where available. The model was created using the Design for System Integrity (DSI) methodology and its software implementation.
The DSI model consists of a sequence of mixed subjective and objective calculations, expressed as a computation graph, with variables being either qualitative or quantitative and consisting of a probability distribution rather than a single value. The results are described below.
3.2
Wash standard ANSI/AHAM
The DSI model in this work was designed to utilise existing ANSI/AHAM data, and thus a brief discussion of that wash test is necessary. The standard describes test procedures for determining wash performance of dishwashers. It gives a “washing index” rating between zero (dirty) and 100 (clean). The test sequence is as follows: a load of dishware is soiled with various prescribed foods, left to dry for two hours and then washed on a normal cycle. Afterwards each item is visually examined for soil, which is may be apparent as particles or gross unwashed regions.
12
Simulation of key performance characteristics under uncertainty: dishwasher wash performance: DJ Pons and JK Raine
Each defect found attracts demerit points depending on the particle diameter. The demerit points are approximately linear with area, so larger particles of soil, which tend to correspond to unwashed regions, are more severely penalised. Each dishware item is scored and can get zero to nine demerit points. The frequency si of demerit points i = 1..9 is then used in Equation 1 to determine the wash index. An application of the method with example data is provided in Appendix A.
WashIndex = 100 −
1 [s1 + 2s 2 + 4{s3 + s 4 + s5 + s6 } + 6{s7 + s8 } + 8s9 ] .......Equation 1 8
The ANSI/AHAM test produces a wash score as a percentage and therefore has a quantitative outcome. The result is presented as deterministic, i.e. a single value with no indication of uncertainty. This implies a precision that is not necessarily there.
3.3
DSI model for wash performance
The DSI model retains the demerit point concept as this permits reuse of test data from the common ANSI/AHAM tests. However, from here onwards the approaches diverge as the ANSI/AHAM approach (Equation 1) is unmanageable as a simulation strategy since it is not based on behavioural physics but an arbitrary set of weights.
13
Simulation of key performance characteristics under uncertainty: dishwasher wash performance: DJ Pons and JK Raine
The DSI model groups residual soil into only two categories: small particles and large patches. The total number of each of these over the whole dishware load is simulated, and a different demerit weight is attached to each. The number of demerit points for each category is limited to ten. The demerit points for particles and patches are then simply added, and the total again limited to ten. The ’wash performance’ (as opposed to ANSI/AHAM ‘wash index’ or ‘washing index’) is then simply the complement of the total demerit points, expressed as a percentage. This part used simple mathematics and quantitative random variables, which presented no difficulty.
The challenging part was simulating the number of residual particles and patches of soil, since the variables are qualitative and the knowledge subjective. These models are described next.
3.4
Residual Soil patches - soil removal effectiveness
The model embodies the assumption that the number of residual soil patches is an indication of effectiveness of soil removal. The fundamental variables assumed to be active in determining this are shown in Table 1. Variable name
Type [3]
Description
Detergent Concentration Dishware axial height
Ordinal numerical Ratio
Jet velocity
Interval
Grams detergent per litre of wash water Depth of dishware, (bowls are greater) [mm] Water jet speed at exit from spray arm, in metres per second 14
Parameters of the distribution Probability function Probability function Histogram, calculated from other functions not shown here
Simulation of key performance characteristics under uncertainty: dishwasher wash performance: DJ Pons and JK Raine
Rack spacing
Ratio
Soil extent
Interval
Soil intensity
Nominal textual Interval
Soil patch demerit points, Sp Soil patch input, Np0
Interval
Soil patch weight, Wp
Ratio
Soil pre-treatment
Nominal textual Nominal textual
Soil thermal treatment
Pitch of wire rack for flatware [mm] Fraction of dishware covered by soil Degree of soiling Demerit points for residual patches of soil Total number of soiled patches loaded to machine, each patch being one ‘soil type’ (size immaterial). Number of demerit points per patch Manual rinse of dishware Only dried soil is used for ANSI/AHAM.
Probability function Probability function (light, medium, heavy) Probability function Probability function
Probability function (Hand rinse hot, hand rinse cold, no rinse) (Fresh, Dried, Reheated, Baked, Burned)
Soil type
Nominal textual
As specified by ANSI/AHAM with proportions determined from the relative masses of the soils. See [3: Fig. 5]
Sprayer main type
Nominal textual Nominal textual
Type of sprayer at bottom of wash cavity Type of sprayer (if any) in middle of wash cavity
Sprayer top type
Nominal textual
Type of sprayer (if any) at top of wash cavity
Wash cavity depth Wash cavity height Wash cavity width
Ratio Ratio Ratio
Metres Metres Metres
(Clean, Beverage, Sauce, Food Fragments, Rice, Peanut Butter, Mashed Potato, Egg, Oats, Breakfast Cereal, Fat, Jam, Other) (Fine spray, coarse spray, stationary jet, moving jet) (None, fine spray, coarse spray, stationary jet, moving jet) (None, fine spray, coarse spray, stationary jet, moving jet) Probability function Probability function Probability function
Wash pump manometric power
Ratio
watts
Probability function
Wash temperature
Ordinal numerical Interval
Temperature of wash water
Histogram
Minutes
Probability function
Sprayer middle type
Wash time
Table 1: Variables used in model for effectiveness of soil removal
All these variables had stochastic uncertainty, which was represented by using a probability distribution or histogram for each. The variables were then related together by various mathematical functions and decision tables.
15
Simulation of key performance characteristics under uncertainty: dishwasher wash performance: DJ Pons and JK Raine
The number of demerit points for soil patches Sp was modelled as dependent primarily on soil removal fraction and extent of wash coverage, with an initial quantity of soil patches and a demerit weight per patch also included:
S p = WP × N p 0 × (1 − (1 − Fsr ) × C sw ) .......Equation 2 where Wp
Soil patch weight (see Table 1),
Np0
Soil patch input (see Table 1), Soil residual fraction Fsr is given by:
Fsr = e
T ln( 0.85 )× wN TsrcN
.......Equation 3
where TwN
Wash Time N is the Wash time distribution reconditioned to remove the singularity at zero time (so that the origin is consistent with the rest of the data series)
TsrcN
Soil removal time CN is the Soil removal time reconditioned to remove the singularity at zero time, where Soil removal time is determined from a set of decision tables (‘maps’) using variables of Jet velocity, Detergent concentration, Wash Temperature, Soil intensity, Soil pretreatment, Soil thermal treatment, and Soil type [3].
16
Simulation of key performance characteristics under uncertainty: dishwasher wash performance: DJ Pons and JK Raine
Equation 3 determines the fraction of soil that remains at the end of the wash cycle, given stochastic uncertainty in both the wash time and the time required to remove the bulk of the soil. However, even if wash and removal times were deterministic and equal, there some soil (fraction p) would be expected to remain. Consequently, and on the basis of expert opinion, a simple dominance was not used but rather a decay function based on the exponential reliability equation. A value of p = 0.85 was set during calibration. The equation can be simplified but is left in its expanded form to make its origins explicit.
Csw
Soil wash coverage is given by:
Csw = 1 – (Soil Extent)x(1 + Dishware wash coverage).......Equation 4 where Dishware wash coverage is a determined from a decision table using Wash power density and Wash direct fraction, where Wash power density Pw is
Pw =
Pwm D w × Dd × Dh
.......Equation 5
where Pwm
Wash pump manometric power
Dw
Wash cavity width
17
Simulation of key performance characteristics under uncertainty: dishwasher wash performance: DJ Pons and JK Raine
Dd
Wash cavity depth
Dh
Wash cavity height
and Wash direct fraction is determined from a set of decision tables using variables of Rack spacing, Dishware axial height, Sprayer main type, Sprayer middle type, and Sprayer top type.
During implementation, the above set of relationships were represented as a DSI model, which is a graphical computational tree (or acyclic graph). Some of the variables are quantitative and the relationships mathematically precise. Even so the input variables are probability distributions that may be widened or narrowed to express the degree of random uncertainty or design indecision in the variable. The DSI process, whereby mathematical operators are applied to quantitative stochastic variables, has also been described previously [2]. Other relationships are subjective, and use decision tables, described previously [3] with an example from this particular case. It should be noted that the decision tables accommodate qualitative variables with stochastic uncertainty, as well as uncertainty of expert opinion (epistemic uncertainty).
A novel feature in this model is the inclusion of all three dimensions of uncertainty: epistemic (mathematical and subjective relationships), type of variable (quantitative and qualitative), and stochastic (random or indecision). This is a special feature of the DSI approach. Other methods are more constrained. For example, Monte Carlo analysis could accommodate only the mathematical relationships with random 18
Simulation of key performance characteristics under uncertainty: dishwasher wash performance: DJ Pons and JK Raine
quantitative variable, while decision theory would cope with the subjective expert opinion and the qualitative variables.
3.5
Residual Soil particles - rinse effectiveness
Inspection of wash tests strongly suggests that most of the small loose particles on the dishware are not unwashed regions of soil, but re-deposited from elsewhere. Consequently, many of the tests deliberately use ground spinach as one component of the imposed soil, as it provides a large number of small but conspicuous particles. The fundamental variables assumed to be active are shown in Table 2.
Variable name
Type [3]
Description
Cleaning cycles, Ncc
Interval
Number of wash and rinse cycles
Filter bypass ratio, Fb
Interval
Filter efficiency, Fe
Interval
Filter reliability, Fr
Interval
Soil intensity Soil particles calibration, Cc
Ratio
Fraction of total flow passing through the filter Fraction of soil removed per pass through filter, based on size of holes in filter Probability of filter working (i.e. not blocked) See previous Table Calibration constant, which can be interpreted as the effective number of soil particles to start with Number of demerit points per particle See previous Table Volume of water [litre] per wash or rinse fill Volume of water [litre] retained in cavity other than sump (e.g. on walls) Volume of water [litre] retained on dishware after wash
Soil particles weight, Wc Soil type Water fill volume, Vwf
Ratio
Water retained cavity, Vwc
Ratio
Water retained dish, Vwrd
Ratio
Ratio
19
Parameters of the distribution Histogram Probability function Probability function Probability function Probability function
Probability function Probability function Probability function Probability function
Simulation of key performance characteristics under uncertainty: dishwasher wash performance: DJ Pons and JK Raine
Ratio
Water retained sump, Vws
Volume of water [litre] retained in sump after drain
Probability function
Table 2: Variables used in model for effectiveness of soil removal
The number of residual soil particles (as opposed to patches) was modelled as dependent re-deposition, in turn determined by the effectiveness of the rinse process, the dilution of soil concentration by successive rinses (hence a power relationship), the characteristics of the filter (if any is provided) and the initial loading of particles. Thus the Soil particles demerit points Sc is:
S c = Wc × C c × N c 0 × Fwr × F fe …… Equation 6
where Wc
Soil particles weight
Cc
Soil particles calibration
Nc0
Soil particles initial is determined from a decision table using variables of Soil type and Soil intensity
Fwr
Water retained original fraction is given by:
Fwr = (Vwf − Vwr )
( N cc −1)
x
Vwrd .......Equation 7 VwfN cc
where Vwf Water fill volume Vwr Water retained volume:
Vwf = Vws + Vwc + Vwd .......Equation 8 where Vws
Water retained sump 20
Simulation of key performance characteristics under uncertainty: dishwasher wash performance: DJ Pons and JK Raine
Ffe
Vwc
Water retained cavity
Vwd
Water retained dish
Vwrd
Water retained dish
Ncc
Number of Cleaning cycles
Filter escape ratio:
F fe = 1 − Fe × Fb × Fr .......Equation 9 where Fe
Filter efficiency
Fb
Filter bypass ratio
Fr
Filter reliability
This assumes that residual soil particles are suspended in the water that remains after drainage, being diluted by each subsequent charge of wash or rinse water, that all the soil is freed at the first wash rather than partially over several washes, that not all the fill volume is able to be drained out as fluid remains in the sump and as a film on the wash cavity and dishware, and that the wash performance metric is only affected by those particles on the dishware. The detectable presence, rather than the size, of the particles is important in this model as in wash tests.
3.6
Calibration of DSI wash model
A dishwasher (ASKO ® type 1805) was used to calibrate the model [30]. This design has a conventional layout, with rotating spray arms at base and middle, 21
Simulation of key performance characteristics under uncertainty: dishwasher wash performance: DJ Pons and JK Raine
auxiliary fixed jets at top, and no filtration other than a filter plate. Only the crockery scores were used as (i) the glasses are suspected to be subject to other wash effects as they consistently have very much worse wash scores than other ware, which was evident in wash tests on other machines not shown here, and (ii) the cutlery is relatively close-packed in a small basket and there are potentially other effects operating there too. The raw ANSI/AHAM scores were stretched onto a 0-10 scale (Table 3), corresponding to the DSI ‘wash performance’ metric. The data were simply averaged to yield a mean ‘wash performance’ of 38%. By comparison, the same data with the elaborate weighting system of ANSI/AHAM produce a ‘wash index’ of 42%, with no measure of the variability.
Dishware item #1 #2 #3 Test CP11 Dinner Plate Fruit Bowls B/B Plates Saucers Cups Serving Dishes Test CP10 Dinner Plate Fruit Bowls B/B Plates Saucers Cups Serving Dishes
#4
#5
#6
#7
#8
#9
#10
3.3 10.0 10.0 1.1 10.0 6.7
1.1 10.0 10.0 6.7 10.0 2.2
6.7 10.0 3.3 1.1 10.0 5.6
5.6 10.0 10.0 4.4 6.7
5.6 6.7 10.0 7.8 10.0
4.4 4.4 1.1 2.2 10.0
8.9 5.6 3.3 2.2 4.4
6.7 2.2 2.2 3.3 5.6
6.7 10.0 6.7 2.2 5.6
10.0 2.2 10.0 4.4 10.0
10.0 10.0 4.4 4.4 10.0 6.7
7.8 10.0 7.8 4.4 5.6 5.6
5.6 10.0 4.4 4.4 10.0 3.3
5.6 10.0 5.6 2.2 10.0
2.2 1.1 4.4 2.2 6.7
6.7 2.2 5.6 6.7 4.4
10.0 10.0 8.9 3.3 7.8
10.0 3.3 3.3 1.1 10.0
8.9 7.8 5.6 3.3 10.0
4.4 2.2 10.0 2.2 5.6
Table 3: Data for two wash tests is shown here, with only the scores for crockery included. Scores have been stretched to a 0 to 10 scale on a proportional basis.
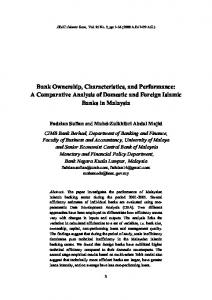
The data were also plotted as a histogram (Figure 1, see ‘Actual’ data). The wide spread of the data shows that wash performance is intrinsically variable. The DSI wash performance model was then adjusted to fit this wash performance, using the known characteristics of this product. In particular the parameters ‘Soil.Particles.Calibration’ and ‘Soil.Patch.Input’ are provided for calibration purposes. 22
Simulation of key performance characteristics under uncertainty: dishwasher wash performance: DJ Pons and JK Raine
Calibration was a significant activity in the development of this model. Not only was it necessary to fit a single point mean, but it was also necessary to show a statistically defendable fit to the shape of the distribution. This added additional degrees of constraint and complicated the calibration task.
After calibration the DSI predicted wash performance for this machine is shown in Figure 1. Simulation mean is 38.1% (c.f. actual 38%). There is no significant difference between the simulation and observed data at the 80% significance level using a Chi square test, confirming a reasonable calibration.
Figure 1: Wash performance for the ASKO 1805 with the bars showing measured
23
Simulation of key performance characteristics under uncertainty: dishwasher wash performance: DJ Pons and JK Raine
data, and the points showing the DSI simulation results. Horizontal axis is wash performance as percentage, from zero (dirty) to 100% (totally clean). The chart should be interpreted as a probability distribution that shows how frequently various wash scores occur among dishware items.
3.7
Predicting other wash performance
The DSI model was next used to predict the wash performance of a different dishwasher: a GE Profile GSD4330 [30]. The same DSI model as before was used, with the only change being different assertions on spray arms: the sprayer configuration was changed to a coarse spray at the middle of the cavity, and a spray arm at top. The results from the physical test (‘Actual’) and the DSI simulation are shown in Figure 2. The mean simulated wash performance of 48.6% compares favourably with that of 47.5 for the actual data (the average of the raw scores after stretching onto a 0-10 scale).
24
Simulation of key performance characteristics under uncertainty: dishwasher wash performance: DJ Pons and JK Raine
Figure 2: Wash performance for the GE Profile with the bars showing measured data, and the points showing the DSI simulation results. Horizontal axis is wash performance as percentage, from zero (dirty) to 100% (totally clean). The chart should be interpreted as a probability distribution that shows how frequently various wash scores occur among dishware items.
The simulation successfully predicts the trend in mean and the new distribution shape including the greater probabilities of higher wash performance. It demonstrates that the system can potentially distinguish small and qualitative changes in geometry configuration of a design, despite the high epistemic uncertainty.
25
Simulation of key performance characteristics under uncertainty: dishwasher wash performance: DJ Pons and JK Raine
4
DISCUSSION
The results of the DSI model for wash performance are in agreement with the physical test data. This outcome was achieved despite the large uncertainties in the system, and the mixture of uncertainties (e.g. objective and subjective knowledge, quantitative and qualitative variables). The DSI methodology is novel in being able to accommodate uncertainty to this extent, a feature that facilitated generation of a model in the complex area of wash performance. However, where uncertainty is high, limitations of validity will also be high, and these are discussed next.
One of the consequences of the DSI approach is that the model includes subjective knowledge and uncertain qualitative variables. This is both a strength and a weakness. The strength is that it permits a potentially useful predictive model to be created where it was not previously possible, as in this case for wash performance. The weakness is the reliance on subjective knowledge, with the possible inclusion of latent biases and imperfection of knowledge. These risks are reduced by the provision of a mechanism for transparency and systematic approach: DSI requires that an expert’s knowledge, and uncertainty thereof, be expressed systematically in the decision tables, i.e. there must be some rational basis for the beliefs. In turn this permits the expressed knowledge to be scrutinised and even debated between experts, which is a positive feature for ensuring robust design. All the same, a subjective model such as that developed here is unlikely to be either unique or perfectly accurate. Nonetheless, it may be better than no model, and permits the design space to be tentatively but rationally explored, even in highly uncertain 26
Simulation of key performance characteristics under uncertainty: dishwasher wash performance: DJ Pons and JK Raine
domains.
The intended application of the DSI methodology is to create a system model using all available information. Test data from physical prototypes can be included, as here, if available. However, if test data are unavailable then a model can still be developed, though it cannot be calibrated. Even so it can provide some support to the early design stages, as a mechanism to identify areas of large uncertainty (that might benefit from further research), or to steer design towards more promising solutions.
Feasibility of simulating complex uncertain systems with DSI has been demonstrated. Calibration on a limited data set has also been demonstrated. The simulation results should be interpreted as uncertain rather than firm conclusions, since they have not been fully validated. They are best treated as suggestions about design configurations that may be worth exploring.
Future work in this area could be to further validate the model by incorporating wash results from other dishwashers. With sufficient data it may be possible to produce a confidence envelope around the distribution for wash profile, and this could be useful in indicating the reliability of the result. Another possible area for further research or extension of DSI is subjective probability. DSI can operate with several types of uncertainty, which makes it an unusual methodology, but does not currently support subjective probability (e.g. ‘low likelihood’). This is a particularly difficult problem for all methodologies that operate in the uncertainty domains, as it involves personal risk 27
Simulation of key performance characteristics under uncertainty: dishwasher wash performance: DJ Pons and JK Raine
perceptions and cognitive behaviour which are not readily quantifiable.
While DSI has in this paper been shown to be applicable to modelling wash performance, the characteristics of this problem are readily apparent in many other domains. For example, a persistently difficult aspect of early engineering design in general is the need for designers to accommodate multiple uncertainties and ambiguities. The DSI methodology is applicable to such domains too. It may be used as a steering mechanism to identify qualitative design refinements that could be rewarding.
The DSI methodology also provides a tool for risk-management in design. A variable with large uncertainty shows a higher level of uncertainty in the design, and may suggest that design issues are inadequately resolved. Unlike other probabilistic tools such as the Monte Carlo method, DSI shows all intermediate variables as probability distributions (not shown here), so the analyst can explore where the uncertainty is originating.
5
CONCLUSIONS
Wash performance is a key characteristic for domestic dishwashers, one that affects the purchase decision. Consequently, it is important that dishwasher manufacturers maintain wash performance of their products even as they adjust design variables to achieve additional outcomes (e.g. lower cost, lower noise, less energy usage). 28
Simulation of key performance characteristics under uncertainty: dishwasher wash performance: DJ Pons and JK Raine
However, there has been little alternative for manufacturers other than building and testing physical prototypes, as there are no predictive models for wash performance.
The hypothesis of this paper was that a methodology could be developed to help predict wash performance at early design. This is a complex problem because of the diverse uncertainties: stochastic, epistemic, and abstraction. The application of the DSI methodology demonstrated that such a model could be developed, accommodating all three types of uncertainty.
The model embodied the belief that two principal mechanisms contribute to wash performance: effectiveness of soil removal, and the effectiveness of the rinse process. In other words, one part of the problem of wash performance is assumed to be getting the soil off the dishware, and the next part is preventing it from being redeposited. The model was calibrated against wash data from a known machine, and then successfully predicted the wash performance of a different brand of machine with qualitative differences in geometry. The wash model presented here should be considered a prototype.
The value of the Design for System Integrity (DSI) methodology is that objective relationships (mathematical operators) may be used where a model is well enough understood, and subjective relationships (decision tables) may be used where there is only an expert belief, and uncertain at that. It is not necessary to create separate models for each type of knowledge. Furthermore, both quantitative and qualitative variables, and uncertain ones at that, may be incorporated in the one model. 29
Simulation of key performance characteristics under uncertainty: dishwasher wash performance: DJ Pons and JK Raine
The results show that it is possible to develop models for highly uncertain systems, and this has important implications for early engineering design. Being able to simulate performance, even under uncertainty, is potentially an important tool for the early design stages as it could (i) indicate promising design avenues, and (ii) indicate the risk in the design and the degree to which design issues have been resolved.
Acknowledgement We gratefully acknowledge the involvement of our late colleague Dr Ken Whybrew (University of Canterbury, 2001) in the co-supervision of Dirk Pons’ doctoral research, on which this paper is based.
Appendix A: Example of ANSI/AHAM method for determining wash index
This appendix clarifies the ANSI/AHAM method with example data. The number of demerit points depends on the particle size (Table A1). Example raw data for demerit points are shown in Table A2. The number of times each score (i = 1…9) occurs is shown in Table A3. Then the frequency is determined as a percent of the total number of dishware items in that dishware category (Table A4). Next, Equation 1 is applied to determine a wash index for each dishware category (Table A5). Finally, these wash indices are added together using weights to give the wash index (Table A5). The weights are determined as the number of dishware items in the category divided by the total number of items.
30
Simulation of key performance characteristics under uncertainty: dishwasher wash performance: DJ Pons and JK Raine
Particle size
Demerit points per particle
< 3.2 mm
1
3.2 to 6.4 mm
3
6.4 to 9.5 mm
7
> 9.5 mm
9
Table A1: ANSI/AHAM demerit points depend on the particle size.
Dishware item #1 #2 #3 #4 #5 #6 #7 #8 #9 #10 Crockery Dinner Plate Fruit Bowls B/B Plates Saucers Cups
3 9 9 1 9
Serving Dishes
6 2 5
Glasses
9 9 9 9 9 9 9 9 9 9
Cutlery Dinner Forks Salad Forks Knives Teaspoons Teaspoons
4 2 9 9 4
Serving utensils
9 9 5
1 9 9 6 9
9 5 9 6 3
6 9 3 1 9
4 9 6 9 3
5 9 9 4 6
9 5 9 8 4
5 6 9 7 9
8 5 9 9 3
4 4 1 2 9
9 7 9 9 8
8 5 3 2 4
3 7 6 9 4
6 2 2 3 5
9 5 9 9 5
6 9 6 2 5
7 3 9 9 6
9 2 9 4 9
8 4 9 9 6
Table A2: Raw wash data scores [30] for ASKO 1805, Detergent Amounts 15 & 30g, programme Normal, test reference CP:11 of 15/07/1998. The numbers are the demerit points for each of up to 10 dishware items. The worst possible score in this test is 9.
31
Simulation of key performance characteristics under uncertainty: dishwasher wash performance: DJ Pons and JK Raine
Fault type x 0 1 2 3 4 5 6 7 8 9 Sub Total
Crockery 0 4 7 4 5 6 8 1 1 17 53
Glasses 0 0 0 0 0 0 0 0 0 10 10
Total
Cutlery 0 0 1 5 6 6 5 3 4 23 53 116
Table A3: Count of various fault (0-9) occurrence, for different categories of ware. Fault type x 0 1 2 3 4 5
Crockery 0.0% 7.5% 13.2% 7.5% 9.4% 11.3%
Glasses 0.0% 0.0% 0.0% 0.0% 0.0% 0.0%
Cutlery 0.0% 0.0% 1.9% 9.4% 11.3% 11.3%
6 7 8 9
15.1% 1.9% 1.9% 32.1%
0.0% 0.0% 0.0% 100.0%
9.4% 5.7% 7.5% 43.4%
Table A4: Frequency of fault is used to determine the wash index for each ware type, and the overall wash index.
Wash index Weight
Crockery 42.0% 0.456897
Overall wash index
Glasses Cutlery 0.0% 31.1% 0.086207 0.456897 33.4%
Table A5: Wash index is determined for each ware type, and then the overall wash index.
References
[1]
Raine, J.K., Pons, D.J., and Whybrew, K. The design process and a
32
Simulation of key performance characteristics under uncertainty: dishwasher wash performance: DJ Pons and JK Raine
methodology for system integrity. Journal of Engineering Manufacture (Proceedings of the Institution of Mechanical Engineers Part B), 2001 Vol 215, p569-576.
[2]
Pons, D.J., and Raine, J.K. Relative effectiveness of mechanisms for simulating uncertainty in quantitative systems. Journal of Engineering Manufacture (Proceedings of the Institution of Mechanical Engineers Part B), 2003, Vol 217, p531-540.
[3]
Pons, D.J., and Raine, J.K. Design with uncertain qualitative variables under imperfect knowledge. Journal of Engineering Manufacture (Proceedings of the Institution of Mechanical Engineers Part B), submitted 2003.
[4]
Pahl, G., and Beitz, W. Engineering Design: A systematic approach, 1988, Springer-Verlag (Berlin) and The Design Council (London), Wallace K (ed).
[5]
Hubka, V., Eder W.E., Design Science, 1996, Springer_Verlag, Berlin, ISBN 3-540-19997-7.
[6]
Bracewell, R.H., Chaplin, R.V., Langdon, P.M., Li, M., Oh, V.K., Sharpe, J.E.E., and Yan, X.T. Integrated platform for AI support of complex design (Part 1): Rapid development of schemes from first principles. In AI system support for conceptual design, Proceedings of the 1995 Lancaster International Workshop on Engineering Design, (Ed. Sharpe, J.), 1996, p 17033
Simulation of key performance characteristics under uncertainty: dishwasher wash performance: DJ Pons and JK Raine
188 (Springer, Belin).
[7]
Bracewell, R.H., Chaplin, R.V., Langdon, P.M., Li, M., Oh, V.K., Sharpe, J.E.E., and Yan, X.T. Integrated platform for AI support of complex design (Part 2): Supporting the embodiment process. In AI system support for conceptual design, Proceedings of the 1995 Lancaster International Workshop on Engineering Design, (Ed. Sharpe, J.), 1996, p 189-207, (Springer, Belin).
[8]
Zlotin, B. and Zusman, A. Managing Innovation Knowledge: The Ideation Approach to the Search, Development, and Utilization of Innovation Knowledge. http://www.ideationtriz.com/paper_Managing_Innovation.htm, 1999, accessed on 29 Jan 2001
[9]
Ishii, M., and Tomiyama, T. A synthetic reasoning method based on a physical phenomenon knowledge base. In AI system support for conceptual design, Proceedings of the 1995 Lancaster International Workshop on Engineering Design, (Ed. Sharpe, J.), 1996, p 109-123, (Springer, Belin).
[10]
Owen, C.L. (ed), Design for integrity, 1993, Insitute of Design Communications Center, Illinois Institute of Technology, Chicago, Illinois USA
[11]
LabVIEW, National Instruments Corporation, http://www.ni.com/labview/, 2004 accessed 25 February 2004 34
Simulation of key performance characteristics under uncertainty: dishwasher wash performance: DJ Pons and JK Raine
[12]
Mathcad, Mathsoft, http://www.mathsoft.com/solutions/enterprise/, 2004, accessed 25 February 2004
[13]
Algor, Core packages, http://www.algor.com/products/default.asp, 2004, accessed 25 February 2004
[14]
Vose, D. Quantitative risk analysis. 1996, Wiley, ISBN 0-471-95803-4
[15]
Biondo, S.J. , Fundamentals of expert systems technology, 1990, Ablex Publishing, New Jersey
[16]
Giarratano, J., and Riley, G. Expert systems: principles and programming, 1994, PWS Publishing Company, Boston
[17]
Candy, L., Edmonds, E., and Patrick, D., Interactive knowledge support to conceptual design. In AI system support for conceptual design, Proceedings of the 1995 Lancaster International Workshop on Engineering Design, (Ed. Sharpe, J.), 1996, p 260-278, (Springer, Belin).
[18]
Cunningham, A., and Smart, R. Computer-aided parts estimation. AI Magazine, 1993, 14: 3, p 39-49
[19]
Haykin, S. Neural Networks, 1994, Macmillan College Publishing Company, 35
Simulation of key performance characteristics under uncertainty: dishwasher wash performance: DJ Pons and JK Raine
ISBN 0-02-352761-7
[20]
Noguchi, H. Exploratory study on `Cross-Inference Method' for supporting idea generation process of industrial designers, 1998, International Conference on Knowledge Based Intelligent Electronic Systems, p 384-389.
[21]
Santillan-Gutierrez, S., and Wright, I. Solution clustering with genetic algorithms and DFA: an experimental approach. In AI system support for conceptual design, Proceedings of the 1995 Lancaster International Workshop on Engineering Design, (Ed. Sharpe, J.), 1996, p37-53, (Springer, Belin).
[22]
Hudson, M., and Parmee, I. The application of genetic algorithms to conceptual design. . In AI system support for conceptual design, Proceedings of the 1995 Lancaster International Workshop on Engineering Design, (Ed. Sharpe, J.), 1996, p 17-36, (Springer, Belin).
[23]
Wood, K.L., and Antonsson, E.K. Computations with imprecise parameters in engineering design: background and theory. Journal of Mechanisms, Transmissions, and Automation in Design, 1989, v 111 n 4 p 616-625
[24]
Antonsson, E.K., and Otto, K.N. Imprecision in engineering design. Journal of Mechanical Design, Transactions Of the ASME 117B, 1995,Jun p 25_32
36
Simulation of key performance characteristics under uncertainty: dishwasher wash performance: DJ Pons and JK Raine
[25]
Clemen, R.T. Making hard decisions, 1996, 2e, Duxbury Press
[26]
Jancsurak, J., Expert Advice Without Consulting the Experts, Appliance Manufacturer, 1991, Vol 39, Issue 9, p58-61
[27]
ANSI/AHAM. Household electric dishwashers DW-1-1992, 1992, American National Standard, Association of Home Appliance Manufacturers, 20 North Wacker Drive, Chicago, Illinois 60606.
[28]
UL 749 HOUSEHOLD DISHWASHERS Seventh edition, Underwriters Laboratory Inc., Northbrook, ISBN 0-7629-0197-7, 1997
[29]
Castro, N.C. Test proceedure development for residential dishwashers, Appliance Engineer, 1999, Vol. 56, No. 8, p 70-76
[30]
Gin, B. Personal communication, September 2000, Range & Dishwasher Division, Fisher & Paykel, Mosgiel, New Zealand.
List of figure captions
Figure 1:
Wash performance for the ASKO 1805 with the bars showing measured data, and the points showing the DSI simulation results. Horizontal axis is wash performance as percentage, from zero (dirty) to 37
Simulation of key performance characteristics under uncertainty: dishwasher wash performance: DJ Pons and JK Raine
100% (totally clean). The chart should be interpreted as a probability distribution that shows how frequently various wash scores occur among dishware items.
Figure 2:
Wash performance for the GE Profile with the bars showing measured data, and the points showing the DSI simulation results. Horizontal axis is wash performance as percentage, from zero (dirty) to 100% (totally clean). The chart should be interpreted as a probability distribution that shows how frequently various wash scores occur among dishware items.
END OF PAPER
File name: 04IMechE_WashModelQuanQualE22.doc
38