Initially, exponential growth is the ... are the growth of rumors, sale of new products, epidemics, ... ted in the coordinate axes, where the vertical axis shows the.
International Conference on Modelling, Simulation and Applied Mathematics (MSAM 2015)
Simulation of Technological Parameters Changing with the Satiation Effect Gennadiy Rubin, Marina Polyakova* and Gennadiy Gun Nosov Magnitogorsk State Technical University 38, Lenin avenue, Magnitogorsk, Russia *Corresponding author
Abstract—Dynamics of several processes quantity parameters has S-shape curve character. It is proved by the fact that process may be described by two parameters: potentional limit of the growth and resource determinating this growth. Firstly such processes were investigated in biology. Later this approach was spread on many other processes and technological systems development as well. At present time S-shaped curves are considered to be universal and sometime are used in order to describe the technological systems progress. In this paper mathematical model is carried out in order to describe S-shaped curve. S-shaped dynamics and its mathematical model make it possible to forecast processes quality parameters based on known reference points. Keywords-forecasting; technology; transformation; S-shaped development curve
I.
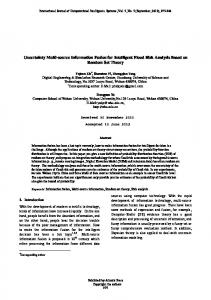
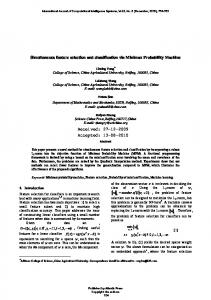
FIGURE I. S-SHAPED CURVE OF SYSTEMS DEVELOPMENT. (1 STAGE – ORIGINATION OF THE SYSTEM; 2 STAGE – RAPID DEVELOPMENT OF THE SYSTEM, MATURITY; 3 STAGE – PERIOD OF GROWTH SLOWDOWN, STABILIZATION AND DECLINE OF CHARACTERISTICS)
INTRODUCTION
S-shaped growth is also called sigmoidal growth. FIGURE 1 shows a general example of S-shaped growth. The curve begins at less than the equilibrium amount. Initially, exponential growth is the dominant behavior of the curve. Then, at the inflection point, the curve begins an asymptotic approach to an equilibrium. Examples of systems that exhibit this behavior are the growth of rumors, sale of new products, epidemics, diffusion and populations with limited resources.
Such curves are characterized by asymptotic tend toward 0 (or to some other minimum limit) when the time variable t decreases and by the tendency to some maximum limit L when the time variable increases; by the period of accelerated growth until moment tb; by the period of slowdown in the growth after moment tb.
The analysis of the system under study starts using the Sshaped curve and the law of system development [1, 2]. This law states that engineering systems (irrespective of the objective) undergo three successive development stages: slow growth, fast avalanche growth and stabilization of one of the main operational characteristics of the system. The curve plotted in the coordinate axes, where the vertical axis shows the value of one operational characteristic and the horizontal axis shows how long the engineering system has been in existence or the expenditures on its development, is referred to as the Sshaped line of the life cycle of the engineering system. The Sshaped curve displays the qualitative development of the engineering system.
It should be noted that a number of relationships between different technical parameters have the same form. Different mathematical equations are proposed to describe S-shaped curve with different extent of accuracy [2, 3]. To describe these relationships Pearl-Reed and Hampertz equations are used
One can see that S-shaped curve has three representative zones (see FIGURE 1). The exponentional growth of system is observed in zone I. In zone III the growth tendency changes to asymptotic one through the inflection point tb (zone II). In other words this curve has both salience and concavity areas. That very point which connects these areas is the inflection of curve.
© 2015. The authors - Published by Atlantis Press
178
P
L 1 ae bt
where P is the system parameter; L is limiting value of the parameter; a, b are parameters; t is time. These formulas were obtained as solutions of differential equations describing development of populations of living organisms. Justification of application of these formulas is based on some similarities between biological processes on the one hand and economic and technical processes on the other hand. One of the disadvantages of modern approaches is the absence of the process start-up and the process end in the mathematical model. In real-time processes, which develop within some finite time period, it is impossible to interpret
asymptotic tendency to some value. As a result, a need arose in a new mathematical model of S-shaped relationships. There are a number of methods of scientific and technological forecasting, which have been developed so far and which are used at present. These methods are based on analysis of data bases contained in application for inventions and in the issued patent documentation. Some approaches make use of complex assessment of engineering significance and economic feasibility of application of the analyzed patents and determine the exploitability of various technological solutions. In many countries making use of patent information determines the research and development policy of companies and production associations [4]. These methods can be considered to be more or less satisfactory, when it comes to forecasting for the next 5-10 years of manufacture of a certain product or forecasting of performance improvement for the equipment in operation. Forecasting methods can be divided into two groups: quantitative ones, based on extrapolation of well known trends and models, and qualitative ones, which are based on expert evaluations and these methods can give an idea of the possible major changes in the system being forecast. The main advantage of qualitative forecasts is that they are capable of predicting the principal turning points in the system being forecast. However, in most cases the forecasts are based on subjective expert experience, thus reducing significantly the predictive value of the research [5, 6]. Mathematical forecasting models are the most common and reasonably rigorous methods of analysis of development trends in technology. They offer qualitative description of the growth rate for real-life forecast objects, make it possible to study the way in which different factors influence this development [7, 8]. S-shaped curves have been applied on a wide scale in economical and technical forecasting to model dynamics of different processes [9-11]. However, in order to forecast the system development, it is necessary to develop a mathematical model, which will make it possible to determine the pace of system development.
Transformation of all calculations in this case is purely technical. The rate of change of the parameter in the vicinity of the interval limits is reduced to 0
dP dt
t t 0
dP dt
t t f
0
And it increases with the increase of the distance to the limiting values
d 2P d 2P a , t t t , b , t b t t f 0 b dt 2 dt 2 where a ≥ 0, b ≥ 0 is the acceleration and the slowdown of the growth rate, respectively, tb is the boundary of the periods of acceleration and slowdown of the parameter growth. S-shaped curve of the parameter change implies its continuous change (continuity of the graph) and smoothness of the growth (absence of breaks of the curve), i.e. continuity of the growth rate (continuity of the first derivative), which is provided by the continuity of the parameter and its first time derivative in the point tb, i.e.
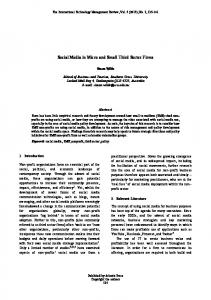
II. THEORY AND METHODS First, we will introduce the symbols and define requirements to such a model (FIGURE 2).
t , t
The period of time of the process development is denoted
as 0 f , and the corresponding values of the analyzed characteristic are
FIGURE II. ELEMENTS OF S-SHAPED DYNAMICS
P t0 P0 , P t f Pf
P tb 0 Ptb 0,
and
dP dt
We consider the P(t) function to be increasing. Symmetrical variant of the function is also possible, when the parameter decreases from the initial to the final time instant.
t tb 0
dP dt
t t b 0
From these conditions we obtain a set of two equations
0,5atb t0 2 P0 0,5bt f tb 2 Pf atb t0 bt f tb where the unknown variables are a, b, tb.
179
t d (t d t b )
It is obvious that these equations don’t define all three parameters. From these equations it is resulted that evidence of one parameter entirely specifies two another ones and, hence, all system dynamics. Generally speaking it is easier to determine inflection point tb as a changeover from accelerated growth character to decelerated one. It is proposed to use this statement for forecasting.
on the level of
For further analysis we consider the point of time tb to be known. Then
V
V , tb t 0
b
V , t f tb
IV. CONCLUSION
Pf P0 t f t0
where is the average speed of the parameter growth for the period of study.
P (t ) V
(t t 0 ) 2 P0 , t 0 t t b ; tb t0
P ( t ) V
(t f t ) 2 t f tb
(10)
Thus, the model of process development offers an effective forecasting method of growth dynamics for some parameter and the time periods of some process.
III. RESULTS AND DISCUSSION
a
1 Pd ( Pd Pb ) 3 .
Pf , t b t t f .
Known variables of the growth rate v or the value of P at some point of time t make it possible to determine the acceleration value a or slowdown value b, and, consequently, all the path of the parameter variation within the corresponding time interval. Then, if the initial parameters (t0, P0) or terminal parameters (tf, Pf) of the path are known, one can calculate the back off point (transition from acceleration to slowdown). Consequently, points O, B and F lie along a straight line. In practice, the points of time ta and tb, when ν = V, are of great interest. In real-life time series with nonsystematic random error these points, unlike many others, can be determined quite accurately.
Mathematical model of S-shaped curve is carried out based on suppositions (2), (3) and (4). In our opinion they entirely characterize processes with accelerated growth character to decelerated one. This approach may be used for forecasting processes quality parameters based on known reference points of S-shaped curves. Undoubtedly S-shaped curves can’t be used for all processes forecasting. Current stage of development is characterized by development of nanotechnology, which is the key factor of the sixth stage in technology development. On the other hand, uneven development of different industries, market relations, the need to respond quickly to the changes in consumer needs and demand require some mathematically based tool aimed at determining the right time for implementation of innovative developments in operating industrial facilities [12]. From this point of view the proposed mathematical tool is of great practical interest for such processes which development is characterized by accelerating growth with further deceleration. ACKNOWLEDGEMENT The research work was carried out in accordance with the government order of the Ministry of Education and Science of the Russian Federation executed by Nosov Magnitogorsk State Technical University (contract 11.1525.2014). Authors appreciate Denis Savinov for his inestimable help. REFERENCES [1]
[2]
The analysis carried out by the authors makes it possible to offer the following algorithm of analysis of the S-shaped time series.
[3]
1. Point tb is defined as the point where the value of speed growth is lower to the right, than to the left
[4]
Pb P Pb P t t
[5] [6]
2. If tb and Pb are known, one can determine the average speed V .
[7]
3. If V is known, one can determine the time point td and the value of Pd.
[8]
4. After this one can forecast the end of the S-shaped process, which will take place at the time point
[9]
180
C.M. Christensen. Exploring the limits of the technology S-curve. Part I: Component Technologies. Production and Operations Management, vol. 1(4), 1992, pp. 334-357 M.M. Naim, D.R.Towill, System dynamics and learning curves, International system dynamics conference, 1994 M. D. Liu, K. J. Xu, S. Horpibulsuk, A mathematical function to represent S-shaped relationships for geotechnical applications, Proceedings of the Institution of Civil Engineers, Geotechnical Engineering. GE3, 2013, pp. 321–327 T. U. Daim, G. Rueda, H. Martin, G. Pisek, Forecasting emerging technologies: use of bibliometrics and patent analysis, Technological forecasting and social change, Vol. 73, 2006, pp. 981-1012 J. R. Meredith, S. J. Mantel, Project management: A Managerial approach. John Wiley & Sons Ltd., 1995 T. Modis, A scientific approach to managing competition, The Industrial physicist,Vol. 9(1), 2003, pp. 24-27 B. Dattee, Challenging the S-curve: patterns of technological substitution, DRUID Summer Conference 2007 on Appropriability, proximity, routines and innovation. Copenhagen, CBS, Denmark, 2007 S. Makridakis, M. Hibon, The M3-Competition: results, conclusions and implications, International Journal of Forecasting, Vol. 16, 2000, pp. 451-476 M.M. Naim, D.R. Towill. Modelling and forecasting industrial innovations via the transfer function S-shaped learning curve, The
International Journal of Advanced Manufacturing Technology, Vol. 8 (5), 1993, pp. 329-343 [10] R. Neumann, Innovation and the S-curve, LIFT Conference: driving innovation - based growth, 2013 [11] D. Kucharavy. TRIZ instruments for forecasting: past, present, and future. INSA Strasbourg - Graduate School of Science and Technology, Strasbourg. Tutorial at ETRIA TFC, Frankfurt, Germany, 2007 [12] E. Golubchik, M. Polyakova, A. Gulin, Adaptive approach to quality management in combined methods of material processing, Applied Mechanics and Materials, Vol. 656, 2014, pp. 497 - 506
181