Simulation of the 3D Sound Propagation and Radiation of a Railway Air Conditioning Unit based on Transfer Matrix Techniques Jan Troge1, Rudolf Starobinski2, Welf-Guntram Drossel1, Holger Kunze1, Björn Knöfel1, Moritz Linke1 1
Fraunhofer Institute for Machine Tools and Forming Technology IWU 09126 Chemnitz, Reichenhainer Straße 88, Germany 2
Silencers. Consulting and engineering,
22301 Hamburg, Dorotheenstraße 76, Germany
ABSTRACT The air conditioning unit (AC unit) is one of the major sound sources for exterior and interior noise of a railway vehicle. The design of such devices is a compromise between main functions like efficiency, fluid mechanics, thermodynamics and acoustics. Especially the acoustical behavior of an air conditioning unit needs to be quantified in every state of the development process, starting in an early design phase. For this purpose preferably simple and fast calculation tools are needed, which can be easily built up and adapted in a short time. Within a research project at the Fraunhofer Institute for Machine Tools and Forming Technology IWU an acoustical calculation model, based on transfer matrices of the different components, has been created to give a sufficiently accurate description of the sound power radiated by an AC unit. In a first step, the sound power of important sources has been characterized by measurement data. Furthermore, the acoustical transfer behavior of ducts and additional components like condensers or evaporators has been individually investigated and implemented in the model using transfer elements. Finally, the sources and transfer components were combined to give a complete representation of the acoustical properties of the air conditioning unit, which can be used for parameter variation studies and noise reduction. Keywords: Noise, Vibration, Simulation, Sound propagation, Air conditioning unit, Railway
1. INTRODUCTION The sound radiation of the air conditioning unit of a railway vehicle can have a significant environmental impact especially in case of parked vehicles close to residential areas. The sound and vibration sources inside of the AC unit have a major influence on the exterior and interior noise level of the complete railway car. The acoustical behavior as well as the system properties needs to be quantified in an appropriate way by the manufacturer, starting in an early design phase. In this paper, the implementation of electro-acoustical analogies into a network model of an AC system is described in order to get a sufficiently accurate description of the radiated sound power. In a first step, the sources and system components have been analyzed, converted into a network description and verified using measurement data. In a next step, a complete calculation model of the AC system has been 1
[email protected]
1
built-up to calculate the sound power radiation. The results have also been verified using measurement data. The complete system analysis and understanding of all acoustical phenomena were the basis for the optimization of the acoustical system which have been simulated and evaluated using the calculation tool. In a last step the optimization measures have been implemented and tested in a functional prototype in order to reduce the overall sound power level and environmental impact.
2. SUBJECT OF INVESTIGATION: AIR CONDITIONING UNIT FOR RAILWAY VEHICLES Basically the railway AC system can be divided into two functional sections. The condenser section includes the cooling circuit with the compressor, condenser and condenser fan. The quantity of each component depends on the actual system design. The main functions are compressing the cooling medium, dissipating the heat from the compressed fluid and releasing the heated air into the environment. The air treatment section is the second functional part which consists of fresh air fan, evaporator and heater for mixing, heating or cooling fresh and recirculation air for the passenger compartment (Figure 1).
Figure 1 - Example design and components of an air conditioning unit [1]. The contributions of the two sections to the sound radiation of the whole system are different due to their diverse functionality. The condenser part contributes mainly to the exterior noise level of the AC system because of the condenser air inlets at the side and the air outlet on the top of the system. The sound radiation into the passenger compartment is strongly influenced by the sound power which is induced into the duct-system of the vehicle by the air treatment section. From the acoustical point of view, there are two major sound sources of an AC-system, the ventilator and the compressor, where the ventilator is the dominant one. Depending on its operating point, the acoustical excitation spectrum usually has a broad-band character with single tonal frequencies which are well noticeable by human hearings. The compressor is a significant vibration source with minor sound radiation [2]. Different acoustical measurements showed that the contribution to the overall sound power level can be disregarded. Other AC components like condenser, heater and evaporator are passive elements which do not induce sound power into the system [3].
3. 3D-CALCULATION MODEL FOR THE PREDICTION OF THE SOUND PROPGATION AND RADIATION OF AN AC UNIT The air conditioning unit of railway vehicles basically contains one major acoustical source type, the ventilator. It has varying contributions to the overall sound power level radiated into the environment and the passenger compartment depending on the operation mode of the s ystem. The radiated sound from a source is transferred, partly reflected or absorbed by air guiding elements like ducts or volumes inside the system. The acoustical modes inside a duct in flow direction or in the cross-section influence the spatial sound pressure distribution which can cause an increased or
2
decreased sound pressure level. This behavior is considered in a 3-dimensional wave guide description for ducts and volumes in the model. Additional components in the air flow with a porous character like condensers, evaporators or heaters as well as installed absorbing materials have a damping effect on the sound waves inside the system. These passive elements are included as resistances within the calculation tool. Figure 2 presents an overview of the different elements used in the prediction model for sound propagation and radiation of an air conditioning unit.
Figure 2 - Overview of the elements used in the prediction model for sound radiation of an air conditioning unit. The requested calculation results of the simulation tool are pressure distribution or sound power radiation of particular outlet sections e.g. exterior sound power level radiated into the environment or interior sound power level at the air outlet to the passenger compartment. Furthermore , the acoustical transfer behavior of the whole AC system in the frequency range can be characterized in order to identify critical system frequencies. 3.1 Network Description of Acoustical Elements The characteristics of the elements of an acoustical system can be described using methods of electro-acoustical analogy. The AC system can be generally modeled by a set of connected volumes and ducts which communicate with their surrounding environment through defined openings. The air-ducting elements are filled with a massless and incompressible medium which does not have any density changes within an element. The corresponding coordinates of acoustical networks are pressure 𝑝 (analogous to velocity 𝑣 in mechanical and voltage 𝑢 in electrical networks) and volume velocity 𝑞 (analogous to force 𝐹 in mechanical and current 𝑖 in electrical networks). The mathematical product of the network coordinates is a power dimension. Acoustical sources are represented by monopoles or dipoles within the volumes which excite the connected acoustical system. A system element can be modeled as a set of acoustical 𝑀-ports using its transfer matrix, where 𝑀 is the total number of pairs of variables 𝑝 and 𝑞 on its entrances (ports). The acoustical properties of the 𝑀-port are described by a system of 𝐿 linear algebraic equations in the form 𝐴𝑀 ∙ 𝑋𝑀 + 𝐴0 = 0
(1)
where 𝑋𝑀 are the input variables 𝑞𝑀 and 𝑝𝑀 with a total number of 2 ∙ 𝑀, 𝐴𝑀 the matrix of coefficients of the linear equations system and 𝐴0 the column of free variables depending on the sources. A complex acoustical system is considered as a classical connection of acoustical 2𝑀-poles for each sub-system. The linear equations for a closed system can be solved using standard methods of the network theory. Besides the main transfer matrices of the elements, an additional matrix of sensors 𝐶𝑀𝑆 connecting pressure and velocity inside of an element (e.g. at some fixed points within a volume)
3
to the variables on the connecting points of a M-port is included in the description. When joining two elements, the common ports become internal ones and they are excluded from 𝑀-port description. So the quantity of external ports is changed. When joining the sub-systems of an AC system, all port variables are excluded from the equations describing the overall acoustical properties. The solution is represented in the form of a column vector calculated from the source variables and their corresponding transfer functions to the sensors. To investigate sound radiation through an outlet, a set of sensors covering the outlet surface has to be specified. The radiated power through a chosen physical surface is defined as the sum of products of velocities and pressures at the sensor points located on the surface, which is connected to a terminating impedance (e.g. free field impedance of surrounding air). Individual functional blocks of the AC system can be investigated separately by joining just the corresponding sub-system elements [5]. 3.2 Modeling of Ducts and Volumes as Waveguide Elements The most typical elements of air-conditioning systems are channels of constant cross section. The acoustical behavior of duct-like elements has theoretically two limiting values. For high frequencies they show a mass determined characteristics and for low frequencies friction plays an important role. Modeling ducts with concentrated elements like acoustical mass or damping is just valid for a small frequency range since all duct dimensions need to be small compared to the wave length inside the medium. Because of the large dimensions of the air-ducting components in the AC system, the wavelengths in the interesting frequency range match the size of the duct and standing waves can occur in flow direction as well as in the cross section [4]. To consider these possible modes in the calculation tool, the acoustics of ducts are simulated using 3D waveguides. In terms of the circuit theory, they can be described as a 𝑀-port, where 𝑀 = 2𝑇 and 𝑇 is the considered number of partial waves in the transversal section of the duct. A specific property of waveguides is the possibility of decomposition of their descriptions into partial waveguides (2-ports resp. 4-pole) corresponding to the separate acoustical modes. The quantity of considered modes (𝑚, 𝑛) in the cross section of a waveguide is needed as basic data for the calculation tool depending on the geometric parameters width and height (w, ℎ). Partial descriptions of separate waveguides are combined to one 𝑀-port in the presented model. The corresponding characteristics for ducts filled with a sound absorption material are also included in the model [5], [6], [7]. A test setup has been used for verification of the waveguide description. Ducts with different dimensions have been excited by a defined velocity 𝑞1 using a volume velocity source on one side of the channel. On the other end microphones measured the sound pressure distribution 𝑝2 in the cross section (Figure 3). These measurement data have been used to calculate the transfer admittances 𝑞1 /𝑝2.
Volume velocity source
Microphones
Figure 3 - Test setup for the measurements of transfer admittances of a 3D-waveguides
Figure 4 shows comparative results of the calculated and measured transfer admittance for an investigated channel. The calculation results show very good accuracy up to 600 Hz and a sufficient accurate coincidence up to 2000 Hz. Even though the waveguide model does only include the acoustical behavior inside a duct and not any structure-borne sound effects, the results are a very good representation of the acoustical behavior of a duct. The further use of the calculation tool like octave band and third-octave band calculations does not need a more precise description which would lead to an increased modeling complexity and calculation time. The number of modes which need to be
4
included in the waveguide model has to be chosen according to the geometrical shape of the duct and the interesting frequency range.
Figure 4 - Simulated and measured transfer admittance of a 3D waveguide. 3.3 Noise Source Characterization of Ventilators The ventilator as the major acoustical source needs to be quantified in an appropriate way in order to get correct source data for the calculation tool. The accuracy of the absolute values of the sound power output directly depends on the quality of the calculation input data. For that reason, different possibilities for quantification of fan noise have been evaluated and verified, which are the manufacturer data of the ventilator, measurement data and estimated values from the working parameters of the fan. Fan manufacturers often provide single values for the sound power in certain operating points which can be recalculated in octave bands. In most cases there are no third-octave band data available and a conversion from octave bands is not possible. To prove manufacturer data and quantify the noise radiated by ventilators under different working conditions, an acoustical ventilator test rig has been set up (Figure 5). It consists of a rigid wall with an open window for placing the ventilator which has to be analyzed. The outlet side of the fan is located on one side of the wall. The inlet side of the fan is connected to a long air duct through the open window in the dividing wall to generate steady flow conditions and evenly distributed inflow at the fan inlet. The air duct is connected to a sound absorber in order to minimize reflections and sound radiation on the inlet side. The air flow can be adjusted at the air inlet of the sound absorber and is measured at the inlet orifice of the fan. The fan outlet noise is determined measuring different microphone positions on a measurement surface. To characterize the sound radiation of the fan under different working conditions, a complete acoustical performance map has been measured. For this purpose the fan runs at constant rotation speed while the volume flow is adjusted to certain values.
Figure 5 - Test rig setup for sound power measurement of ventilators [6].
5
In Figure 6 an examplary acoustical performance map is represented. The sound power level in the third octave band is illustrated using a color map (green – low sound power level, red – high sound power level). The graphic indicates critical working conditions in terms of high sound ra diation which can be used to identify an optimum operating point. rpm in 1/min
overall level in dB
volume flow low 50 543 70,5 771 77,6 974 81,7 1128 85,1 1280 88,1 1538 92,2 1580 93,0 volume flow medium 1 543 68,0 771 74,3 974 79,0 1128 82,5 1280 84,6 1538 88,3 1580 89,1 volume flow medium 2 543 70,6 771 76,3 974 81,3 1128 84,5 1280 86,9 1538 90,6 1580 91,9 volume flow high 543 73,6 771 80,7 974 85,3 1128 88,7 1280 91,6 1538 95,4 1580 96,7
Third Octave Bands in Hz 63
80 100 125 160 200 250 315 400 500 630 800 1000 1250 1600 2000 2500 3150 4000 5000 6300 8000
Sound Power Level
48 dB
69 dB
91 dB
Figure 6 - Example for an acoustical performance map of a ventilator Additionally, two approximation methods for fan noise [8], [9] have been evaluated and compared to the measurement data. The estimations use ventilator parameters e.g. electrical power, circumferential speed, degree of efficiency and geometrical data to calculate a sound power spectrum in an empirical way. A comparison of manufacturer’s data, the results of the test rig measurements and data estimated by the two approximation methods for an exemplary radial ventilator shows a significant spread between the obtained sound power levels (Figure 7).
Figure 7 - Comparison of linear sound power levels of a radial ventilator. The measurement data from the test rig have been chosen as most accurate input source data for the calculation model. A large uncertainty is shown by the approximation methods and the acoustical data from the ventilator manufacturers, which strongly underestimate the radiated noise. The fan as a sound source represents an acoustical dipole which basically acts as a velocity converter. This approximation leads to an equivalent scheme of the fan as a multimodal sound power source. The source strength was defined by comparisons of the octave sound power measurements at the acoustical test rig and a calculation of the sound radiation on a test rig calculation model using a dipole model with uniform excitation in frequency range.
6
3.4 Model Build-up and Calculation The first step in terms of building up an acoustical network model of an AC system is abstracting the real geometries and components into acoustical network elements like ducts, volumes, sources or resistances. The abstraction inevitably changes the acoustical characteristics of elements and slightly displaces resonant frequencies of elements in particular. But these frequency shifts do not have an essential influence on octave or third octave spectra levels of the sound radiation, which are the main results the calculation tool is intended for. The number of modes (𝑚, 𝑛), used to describe the acoustical behavior of ducts (see chapter 3.2), have to be chosen in an adequate way in order to get a proper model in the frequency range of interest in combination with a short calculation time. The system abstraction needs to be done in all possible sound propagation directions in order to get a sub-system for each direction. In this way the three-dimensional sound propagation inside the system is easily described. The considered number of modes in the cross sections (𝑚, 𝑛) have to be chosen separately for each sub-system as well as the boundary conditions at the open ports which need to be defined e.g. free field impedance or sound reflecting conditions. The separate models for the different propagation directions are joined using connection elements which define boundary conditions for pressure 𝑝 and velocity 𝑞 at the joining points. The number and position of the connections can be chosen separately. It is possible to define a point or a surface connection. The system abstraction can then be easily converted into an acoustical network, which is represented in a topological input file with elements, connection points, number of input and output sections and sensors for generating results. The geometrical and physical properties of the real system are represented by corresponding parameters of the model elements.
Figure 8 - Schematic procedure of model build-up All elements are finally joined to one transfer matrix. The defined sensor variables are calculated by solving the residual equation system. For systems with more than one fan source the method of power summation of separate, not correlated sources, is used. Thereby, calculation time is considerably reduced. Main influences on calculation time, despite the model size, do have the parameters frequency range, frequency step and maximum number of modes in the cross sections (𝑚, 𝑛).
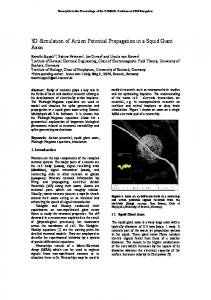
4. VERIFICATION OF THE NETWORK MODEL The introduced calculation method has been verified on different railway AC systems. The simulation model has been built up to calculate the exterior sound power level of the units, which is an interaction of noise contributions of several sources depending on the operating mode. First the radiated sound power of an AC unit has been measured in an anechoic room using an intensity probe. The measurement set up is shown in Figure 9. In order to measure just the contribution to the exterior noise level, the air outlet to the passenger compartment has been encapsulated. To verify the calculation tool, the complete system in different operating modes as an interaction of several sources as well as single excitations at different source positions have been evaluated separately.
7
Figure 9 - Sound power measurement setup of the AC system in a semi-anechoic room. In a first step, single excitations by individual ventilators have been investigated for the model verification. The results of calculation and measurement of the sound power for one fan source is presented in Figure 10. There is a good correlation between simulated and measured sound power data.
Figure 10 - Comparison of simulated and measured exterior sound power levels of an AC system with one fan excitation. The differences at the lower frequency bands are presumably due to the systematic deviation of the intensity probe measurement. Especially when positioning the probe in the air flow, an overestimation of the sound power can be observed. Regarding the overall sound power level, there is a very good prediction accuracy of the acoustical network model.
Figure 11 - Comparison of simulated and measured exterior sound power levels of an AC system in cooling mode (interaction of 4 source excitations).
8
For the simulation of an AC-system in cooling mode, a superposition of 4 fan excitations is needed. The contribution of each source has been calculated separately and then summed up to an overall sound power level of the system which is presented in comparison to the measurement data in Figure 11. As already mentioned, there are some differences at the low frequencies between the calculated and measured sound power levels due to the measurement method. For middle and higher frequency bands, measurement and simulation correlate quite well. The simulation tool also allows quantifying the acoustical transfer properties of an AC system. By calculating a sound power output under the constraint of a uniform excitation of a source, the transfer function of output sound power to input sound power can be calculated. The transfer function clearly shows which frequency ranges are weakly damped or even amplified on the sound propagation path from the sources to the outlets of the system. This information is really important in the early development process of an air conditioning unit. In combination with the sources quantification data , it is possible to quickly identify critical frequency ranges. Figure 12 shows the exemplary transfer functions of two calculated systems.
Figure 12 - Simulated transfer function of two different AC systems using uniform excitation. In case of the system 2, the design of the internals of the AC unit leads to an amplification of the 250 Hz band. The ventilators installed in a system are most commonly chosen from a thermo- and fluid-dynamical design point of view. To avoid high sound radiation in the increased frequency band of system 2, the ventilators should have a low sound power level in the third-octave bands from 200 - 315 Hz.
5. ACOUSTICAL OPTIMIZATIONS USING THE CALCULATION TOOL In a last step, the verified acoustical network model has been applied to reduce the sound radiation of an AC unit. The prototype, which has been used for model verifications, needed to be optimized for a reduction of the sound radiation. With the help of parameter variation studies, the contribution of the internals of the system on the overall sound power level has been analyzed. The derived optimization measures have been implemented in a new design of the AC system. Furthermore, the excitation potentials of the sources have been correlated with the transfer behavior of the new system design. As a result the original radial ventilators needed to be replaced by axial ventilators which have a lower noise emission in critical frequency ranges at comparable working conditions. The optimization measures have been implemented in a new prototype of the AC-system. In Figure 13, the calculated sound power of the original and optimized system is presented. A significant sound power reduction in octave bands above 250 Hz can be determined which leads to a less annoying character of the noise emission. The overall sound power level shows a reduction of approx. 9 dB which is corresponding to approx. 12.5% of the originally radiated sound power. The improvement has also been evaluated by intensity probe measurements which showed a similar result.
9
Figure 13 - Calculated sound power level of the original and optimized AC system
6. CONCLUSION In this work, a straightforward calculation method has been presented which can be used to simulate the acoustical behavior of AC systems. It allows calculating absolute sound power values for the sound radiation of a system as well as acoustical transfer functions from the source positions to the system outlets or its subsystems with a sufficient accuracy for an industrial development process. The simulation model can be built up and adapted rapidly using geometry data of the internal system elements. A very short calculation time – compared to finite element analysis – gives the opportunity to do parameter studies and sensitivity analysis for the optimization of the sound radiation in an early design phase.
7. ACKNOWLEDGMENTS The research has been funded by the European Union as part of the European Regional Development Fund (ERDF) and by the Free State of Saxony (Sächsische Aufbaubank, SAB). The funding is gratefully acknowledged. The research work in this project has been done in close collaboration with Prof . Rudolf Starobinski and the AC system manufacturer Faiveley Transportation Leipzig GmbH & Co. KG in Schkeuditz, Germany. Also, the authors would like to thank Mr. Philipp Truxa, who contributed with his Diploma Thesis much to the presented results.
REFERENCES [1] [2]
[3]
[4] [5] [6] [7] [8] [9]
Kunze, J.: Technical Information HVAC-System S95T, Faiveley Transport Leipzig GmbH & Co. KG, Schkeuditz, 2010. Troge, J.; Knöfel, B.; Drossel, W.-G.; Kunze, H.; Linke, M.: Structure-borne Sound Source and Transfer Path Analysis of coupled Structures using the Example of a Railway Air Conditioning Unit. Internoise 2013, Innsbruck, 2013. Linke, M. ; Starobinski, R. ; Drossel, W.-G. ; Kunze, H. ; Troge, J. ; Knöfel, B. : Simulation of the Sound Radiation of an Air Conditioning Unit from a Railway Vehicle using Transfer Matrix Techniques. AIA-DAGA 2013, Meran, Italy, 2013. Lenk, A.; Pfeifer, G.; Wertschützky, R.: Elektromechanische Systeme. Springer , Berlin, 2000. Starobinski, R.: Intake and exhaust mufflers. Chapter 10 in the handbook “Noise and vibration control in vehicles”, pp. 201-270, Politechnika, St. Petersburg, 1993. Truxa, P.: Akustische Modellierung der Schallabstrahlung eines Bahnklimagerätes. Diploma Thesis, Hochschule Mittweida, Germany, 2012. Munjal, M.L.: Acoustics of ducts and mufflers with application to exhaust and ventilation systems. Wiley , New York, 1987. Müller, G.: Taschenbuch der Technischen Akustik – 3. Auflage. Springer-Verlag, Berlin, 2004. Eck, B.: Ventilatoren – 5. neubearb. Aufl. Springer-Verlag, Berlin, 1991.
10