International Conference
Nuclear Energy for New Europe 2005 Bled, Slovenia, September 5-8, 2005
Simulation of Water Hammer Experiments Using RELAP5 Code Algirdas Kaliatka, Mindaugas Vaisnoras Lithuanian Energy Institute Breslaujos 3, LT-44403 Kaunas, Lithuania
[email protected],
[email protected] ABSTRACT The rapid closing or opening of a valve causes pressure transients in pipelines. The fast deceleration of the liquid results in high pressure surges upstream the valve, thus the kinetic energy is transformed into the potential energy, which leads to the temporary pressure increases. This phenomenon is called water hammer. The intensity of water hammer effects will depend upon the rate of change in the velocity or momentum. Generally water hammer can occur in any thermal-hydraulic systems and it is extremely dangerous for the thermalhydraulic system since, if the pressure induced exceeds the pressure range of a pipe given by the manufacturer, it can lead to the failure of the pipeline integrity. Due to its potential for damage of pipes, water hammer has been a subject of study since the middle of the nineteenth century. Many theoretical and experimental investigations were performed. The experimental investigation of the water hammer tests performed at Fraunhofer Institute for Environmental, Safety and Energy Technology (UMSICHT) [1] and Cold Water Hammer experiment performed by Forschungszentrum Rossendorf (CWHTF) [2] should be mentioned. The UMSICHT facility in Oberhausen was modified in order to simulate a piping system and associated supports that are typical for a nuclear power plant [3]. The Cold water hammer experiment is interesting and instructive because it covers a wide spectrum of particularities. One of them is sub-cooled water interaction with condensing steam at the closed end of the vertical pipe at room temperature and corresponding saturation pressure [4]. In the paper, the capabilities of RELAP5 code to correctly represent the water hammer phenomenon are presented. Paper presents the comparison of RELAP5 calculated and measured at UMSICHT and CWHTF test facilities pressure transient values after the fast closure (opening) of valves. The analyses of rarefaction wave travels inside the pipe and condensation of vapour bubbles in the liquid column are presented. The influence of the control volume sizes in pipe components to the computational results is presented as well. The acquirement of knowledge will allow to develop RELAP5 code model for the analysis of accidents with the phenomenon of water hammer for the nuclear power plants. 1
INTRODUCTION
Due to its potential for damage of pipes, water hammer has been a subject of study since the middle of the nineteenth century. Many theoretical and experimental investigations were performed. The experimental investigation of the water hammer tests performed at Fraunhofer Institute for Environmental, Safety and Energy Technology (UMSICHT) and Cold Water
054.1
054.2
Hammer experiment performed by Forschungszentrum Rossendorf (CWHTF) should be mentioned. The UMSICHT facility in Oberhausen was modified in order to simulate a piping system and associated supports that are typical for a nuclear power plant. The main task of experiments conducted at Fraunhofer UMSICHT is to get pressure surges under control and to use results of experiments for developing new methods for the prevention of water and cavitational hammer [3]. The Cold water hammer experiment is interesting and instructive because it covers a wide spectrum of particularities. One of them is sub-cooled water interaction with condensing steam at the closed end of the vertical pipe at room temperature and corresponding saturation pressure. The Cold Water Hammer experiment described in the present paper is a simple facility where overpressure accelerates a column of liquid water into the steam bubble at the closed vertical end of the pipe. Severe water hammer with high pressure peak occurs when the vapour bubble condenses and the liquid column hits the closed end of the pipe [4]. Generally water or steam hammer can occur in any thermal-hydraulic systems and it is extremely dangerous for the thermal-hydraulic system since it can lead to the failure of the pipeline integrity. Aim of this analysis is to perform calculations with RELAP5 code to assess a code capability of calculating water hammer type transients. The code capabilities to predict various phenomena can be evaluated only from the comparison between calculation results and experimental data gathered in test facilities. Therefore, the objective of the present analysis is to validate the RELAP5 code model by comparing the numerical water hammer results with those of the experimental investigation performed at the UMSICHT and CWHTF test facilities. 2
SIMULATION OF UMSICHT TEST FACILITY EXPERIMENTAL CASE
2.1
Facility and Experiment
For the RELAP5 analysis we consider water hammer test performed at Fraunhofer Institute for Environmental, Safety and Energy Technology (UMSICHT) at Oberhausen, Germany. These water hammer experiments have been initiated under the WAHALoads research project of the 5th Framework Programme of the European Union. The existing UMSICHT facility in Oberhausen is being modified in order to simulate a piping system and associated supports that are typical for a nuclear power plant. Preliminary design is being performed with the support of Framatome ANP, Offenbach in consultation with EDF, Clamart. Fluid dynamic loads, global structural response and possible fluid-structure interaction were investigated experimentally. The experiments were conducted using the dynamic behaviour of closing and opening valves in a steady-state liquid flow. The test rig design includes two 240 m pipes with high and low levels (difference in height: 10 m) and inner diameters of 54 mm and 108 mm respectively [3]. A centrifugal pump produces steady-state flow from the storage tank through the pipework with the inner diameter of 108 mm and approx. 200 m length back to the tank. The tests were carried out with water at room temperature and in the range of initial velocities v0 between 1 and 6 m/s [5]. We consider scenario with 4 m/s initial water velocity, liquid temperature 295 K and pressure 1 bar. The transient was initiated by the rapid closure of a valve at an initial time t = 0 s. During the first phase of the transient, a rarefaction wave was travelling inside the pipe towards the downstream reservoir. As a consequence, the cavitation occurred downstream of the valve.
Proceedings of the International Conference “Nuclear Energy for New Europe 2005”
054.3
2.2
UMSICHT Facility Test Case Simulation with RELAP5 Code
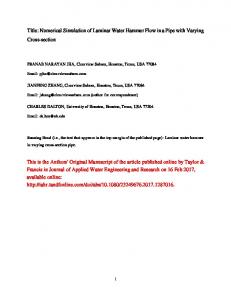
The model employing RELAP5/Mod3.3 code was developed according to the experimental facility (Fig. 1).
62.3 m
Flow direction VALVE 754
PIPE 753
0.0 m
p1
SINGLE JUNCTION 752 18.2 m
PIPE 755
WM
103.2 m
18.4 m
500 TANK 1
104.1 m
p2
650 TANK 2
68.3 m
BRIDGE
PO3
SINGLE JUNCTION 759
202.7 m
200.4 m 207.2 m
149.8 m
PIPE 758
RAMP
167.3 m
SINGLE JUNCTION 757
15O 129.9 m
Figure 1: UMSICHT RELAP5/Mod3.3 code model nodalization scheme A two time-dependent volumes (components “500” and “650”) with specified constant pressures and temperatures to obtain steady state liquid velocity 4 m/s were simulated in the model. Such an approach has allowed to avoid modelling the pump, which operates in actual piping system of facility. Facility piping from the tank upstream the shut-off valve (component “754”) was simulated using the pipe component “753”. The segment of actual facility piping with the bridge downstream the valve was modelled using the pipe component “755”. Last segment of piping with the ramp was modelled employing the pipe component “758”. The model scheme has been selected being based on investigations presented in a paper [6]. Employing RELAP5 code for water hammer analysis, a very close attention must be paid to the cell (control volume) size (if the pressure wave is expected to have a very rapid rate of increase, then the cell nodalization scheme must be implemented to give a small length dimension) [7]. A number of RELAP5 calculations with different control volume sizes for the pipe elements “753”, “755” and “758” was carried out to obtain the pressure peaks without high rate of change at steady state water velocity 4 m/s. Graphs in Fig. 2 shows performed analysis to estimate the influence of control volume sizes in the pipe component “755”. The pipe was divided into 10, 25, 48, 85 and 97 control volumes. As it is seen from figure the values of pressure peaks and the frequencies of cavitational pressure peaks are different in these investigated cases. However, dividing the pipeline component “755” into 85 control volumes is enough because the further reduction of control volumes size does not influence both the pressure peaks and frequencies of cavitational pressure peaks. As it has been mentioned, the similar analysis was performed for all pipeline elements, i. e. components “753”, “755”and “758”.
Proceedings of the International Conference “Nuclear Energy for New Europe 2005”
054.4
relap5 pipe 755 = 10 c. v.
5
relap5 pipe 755 = 25 c. v. relap5 pipe 755 = 48 c. v.
Pressure, MPa
4
relap5 pipe 755 = 85 c. v. relap5 pipe 755 = 97 c. v.
3 2 1 0 0
2
4
6
8
10
Time, s Figure 2: RELAP5 calculations using different control volume sizes in the pipe component “755”. Using the described model the water hammer test analysis was performed and obtained results were compared with measurements of the water hammer test performed at UMSICHT test facility. Model was employed to simulate investigation for steady state liquid velocity 4 m/s. Figure 3b shows the pressure curve from the UMSICHT experimental data (dot line) in comparison with the calculated RELAP5/Mod3.3 code data (continuous line). Pressure was monitored at the position P03 (Fig. 1) downstream the shut-off valve. 2.3
UMSICHT Facility Test Case Simulation Results
Simulation of the process shows, that after the valve has been closed, the pressure decreases to the saturation pressure, which is close to vacuum. The void (steam) fraction increases and reaches a value of over 0.9, i.e. the tube is almost empty within the time span 0 – 3 seconds (Fig. 3a). The water flows back in the slug, the steam fraction decreases rapidly and, then the steam is completely condensed. Therefore, the pressure peak at the measuring position (P03) downstream the check valve is observed and it is caused by the collapse of the void in this place. The pressure wave travels through the pipeline. It is reflected at the entrance into the storage tank and returns. Pressure of the reflected wave is smaller in comparison with the first pressure peak. When this wave reaches the closed valve, a new cavitation bubble is generated. This process repeats for several times and a series of water hammers with decreasing amplitudes is observed. The pressures of the following cavitational processes decrease with time due to the friction between the liquid and structure. The calculation results for the first calculated pressure peak (i. e. time point of peak appearance and maximum value of the peak) match very well the measured value of pressure (Fig. 3b). Also the second pressure peak and time of this peak occurrence agrees quite good in comparison with experimental data. Concerning the following pressure peaks, the dumping of the pressure peaks is stronger in our results than in experiment, and the peaks appear with rather different frequency. However, correct prediction of the first cavitation hammer it is the most important. Achieved value of the first pressure peak is the most dangerous in Proceedings of the International Conference “Nuclear Energy for New Europe 2005”
054.5
comparison with the following pressure peaks and can lead to damages of plant's equipment (valves, pumps, pipe bends) up to leakage of the pipe system. 1 relap5 calculated at P03
Void fraction, -
0.8
a 0.6
0.4
0.2
0 0
2
4
Time, s
6
8
5
measured pressure at P03 relap5 calculated at P03
4 Pressure, MPa
10
b 3 2 1 0 0
2
4
6
8
10
Time, s
Figure 3: Simulated pressure and average void fraction downstream the closed valve (P03) for an initial liquid velocity of v0 = 4 m/s 3 3.1
SIMULATION OF COLD EXPERIMENTAL CASE
WATER
HAMMER
TEST
FACILITY
Facility and Experiment
The CWHTF consists of a pressure vessel (tank), a pipe line with two straight sections (one horizontally and one vertically oriented), two 90o bends (curvature radius 306 mm) and a fast opening valve. The total length of the pipeline is about 3 metres, the outer pipe diameter is about 219 mm and the wall thickness 6 mm. The vertical pipe region is terminated by a lid flange which acts as a bouncing plate [4]. Proceedings of the International Conference “Nuclear Energy for New Europe 2005”
054.6
At the beginning, the valve is open and the pipeline is filled with water at room temperature. The top section of the vertical part of the pipeline contains air (α = 1.0). The valve is then set to closed position and holds initial pressure in the vessel and in the first part of the pipeline. The air from the evacuation area is then being evacuated by the vacuum pump. The pressure is reduced close to the saturation pressure at the given fluid temperature. The transient starts when the fast acting valve is opened again. The pressure difference between the tank and the closed end, and condensation of steam in evacuation area, accelerates water in the pipe, and the water hammer appears when the water column is abruptly stopped by the closed end of the pipe. The process can then repeat but with a weaker intensity of pressure peak due to the dissipation processes. The height of the pressure peak is proportional to the velocity of water at the moment of reaching the closed end. A higher initial pressure in the tank and/or larger evacuation area LE increase the acceleration and consequently the velocity of water column and hence the pressure peak. The water level in the vertical pipe and in the vessel (before evacuation) varied between 0.15 m and 0.35 m for the different test series. The valve opening time was some 0.021 s. The free volume beneath the bouncing plate was evacuated to evaporation pressure (p2 = 0.029 bar). Gas pressure in the vessel is 1 bar. With an evacuation height of 0.3 m the pressure amplitude of some 40 bars was obtained [2]. 3.2
Cold Water Hammer Facility Test Case Simulation with RELAP5 Code
hG=0.91 m
Air
air evacuated area
VESSEL
LE=0.3 m
The model employing RELAP5/Mod3.3 code was developed according to the cold water hammer experimental facility data (Figure 4).
PIPE 753
hL=0.81 m
water only
Water
p1
p2 - evacuation pressure PIPE 755
VALVE 754
Figure 4: Geometry of RELAP5/Mod3.3 cold water hammer experimental facility model In order to obtain the most realistic boundary conditions for the wave reflection on the reservoir, it is necessary more precisely represent gas and liquid volumes in the vessel, Proceedings of the International Conference “Nuclear Energy for New Europe 2005”
054.7
according to the experiment. In our model a pressure vessel (tank) is modelled using a RELAP5 pipe component with set initial conditions (pressure, temperature). In the experiment 290601, the pressure vessel of 800 mm diameter and 1.72 m height contains hL = 0.81 m of water and hG = 0.91 m of gas. Volume hG was modelled using RELAP5 noncondensable input. Selecting non-condensable input consists of specifying type (Card 110) and mass fraction (Card 115) of species and by selecting options 4, 5, 6 on the volume initial condition cards. The same pipe component “753” as well as for modelling of pressure vessel (tank) is used to simulate the facility pipeline with two straight sections (one vertically and one horizontally oriented) from the tank upstream the fast opening valve (component “754”). This segment of pipeline “753” in the RELAP5 code is modelled with 16 volumes with total length of the pipeline 0.8 m, where the length of one computational volume is Dx = 0.05 m. A pipeline downstream the fast opening valve with two straight sections (one horizontally and one vertically oriented) and with the closed end was simulated using the pipe component “755”. The pipeline “755” in the RELAP5 code is modelled with 50 volumes with total length of the pipeline 2.5 m, where the length of one computational volume is Dx = 0.05 m also. Evacuation length LE = 0.3 m represents the top of the vertical pipe section, which contains the mixture of steam and air. This free volume above this level in real experiment is evacuated through a hole in the bouncing plate by the vacuum pump. This phenomenon was modelled using RELAP5 non-condensable input also. 3.3
Cold Water Hammer Facility Test Case Simulation Results
Transient starts and the fast acting valve (component “754”) is opened (valve opening time is 0.021 s). The pressure difference between the tank and the closed end, and condensation of steam in evacuation area, accelerates water in the pipe, and the water hammer appears when the water column is abruptly stopped by the closed end of the pipe. The process can then repeat but with a weaker intensity of pressure peak due to the dissipation processes. The height of the pressure peak is proportional to the velocity of water at the moment of reaching the closed end. The experiment starts at time t = 0.0 s when the fast opening valve (component “754”), which separates two different states in the pipeline is rapidly open. Due to the pressure difference between the tank and the closed end the liquid column is accelerated into the closed end of the pipe. When liquid water reaches closed end, very strong water hammer occurs. After that the velocity in the pipe changes the direction, pressure is decreased near the closed end, the vapour bubble near the closed end is formed again, and the phenomenon repeats again, but with lower intensity due to the dissipation. The total mass transfer rate per unit volume at the vapour/liquid interface in the bulk fluid for vapour generation/condensation is presented in Figure 5a. It can be clearly seen from this figure that the pressure peak is formed each time when vapour in the evacuation area is condensed and the water column reaches the closed end. During the pressure peak, the water velocity change direction, the pressure drops to the saturation level again and vapour is generated during the flashing process until reflection from the tank. The negative vapour generation rate means condensation and the positive – evaporation. When the condensation changes into the evaporation, the pressure peaks appear. Graphs in Figure 5b shows calculated pressure time-history in a point just near the closed end of the pipe. Calculated pressure with RELAP5 is compared to the measured pressure. The first pressure peak rises at time of 0.15 s approximately after the valve closing. This first calculated pressure peak match very well the measured first pressure peak as well as in UMSICHT facility test case simulation, but the following peaks are stronger in calculated Proceedings of the International Conference “Nuclear Energy for New Europe 2005”
054.8
results and appear with different frequency (Fig. 5b). However, as it has already been mentioned, correct prediction of the first cavitation hammer is the most important analysing the safe operation of the hydraulic systems.
Vapor generation rate, kg/m3s
1.5
simulated with relap5 code
1
a 0.5 0 -0.5 -1 -1.5 0
0.1
0.2
0.3
0.4
0.5
Time, s
4
Experiment simulated with relap5 code
Pressure, MPa
3 b
2 1 0 0
0.1
0.2
0.3
0.4
0.5
Time, s Figure 5: Pressure time-history and total mass transfer rate per unit volume near closed end of the pipeline employing RELAP5 code 4
CONCLUSIONS
This work aims to show capabilities of RELAP5 computer code to simulate water hammer phenomenon. Paper presents the comparison of RELAP5 calculated and measured at UMSICHT and CWHTF test facilities pressure transient values after the fast closure Proceedings of the International Conference “Nuclear Energy for New Europe 2005”
054.9
(opening) of valves. Correct prediction of such transients is very important analysing the safe operation of the nuclear power plants. Calculated the first pressure peak (i. e. time moment of peak appearance and maximum value of the peak) matches the measured value of pressure very well in both simulated cases, but the following peaks appear with different time delay. Anyway, correct prediction of the first cavitation hammer it is the most important. Achieved value of the first pressure peak is the most dangerous in comparison with the following pressure peaks and can lead to damages of plant's equipment (valves, pumps, pipe bends) up to leakage of the pipe system. The analyses of rarefaction wave travels inside the pipe and condensation of vapour bubbles in the liquid column are presented. The influence of the control volume size in pipe components to the computational results is discussed. The acquirement of knowledge will allow to develop RELAP5 code model for the analysis of accidents with the phenomenon of water hammer for the nuclear power plants. ACKNOWLEDGMENTS The authors would like to acknowledge the valuable assistance by Dr. Iztok Tiselj. REFERENCES [1] Homepage: http://www.cordis.lu/fp5-euratom/src/lib_finalreports.htm: Two-Phase Flow Water Hammer Transients and Induced Loads on Materials and Structures of Nuclear Power Plants (WAHALOADS) [2] S. Potapov and E. Altstadt, Coupled Fluid-Structure Analysis with Europlexus Fast Dynamics Software of The CWHTF Experiment, The 6th International Conference on Nuclear Thermal Hydraulics, Operations and Safety (NUTHOS-6), Nara, Japan, October 4 – 8, 2004, pp. 1-17. [3] A. Dudlik, S. B. H. Schönfeld, O. Hagemann, and H. Fahlenkamp, Water Hammer and Cavitation Hammer in Process plant Pipe Systems, Kerntechnik, vol. 68, 2003, pp. 91-96. [4] E. Altstadt, H. Carl, and R. Weis, Fluid-Structure Interaction Experiments at the WaterHammer Test Facility of Forschungszentrum Rossendorf, Jahrestagung Kerntechnik, 2002, pp. 59 – 64. [5] A. Dudlik, S. Schlüter, Dynamic Valve Characteristics- Measurement and Improved Calculation of Pressure Surges, 8th International Conference on Pressure Surges, The Hague, The Netherlands; April 12-14, 2000, pp.105 – 114. [6] A. Kaliatka, E. Uspuras, M. Vaisnoras, Justification of RELAP5 Code for Modelling Water Hammer Phenomenon by Employing UMSICHT Test Facility Data, Power Engineering, Vol. 3, The Lithuanian Academy of Sciences, 2004, pp. 1 – 6. [7] RELAP5/MOD3.3 Code Manual, Volume 5, User’s Guidelines, Nuclear Safety Analysis Division, NUREG/CR-5535, Rev 1 – Vol V, December 2001, p. 6.
Proceedings of the International Conference “Nuclear Energy for New Europe 2005”