ABSTRACT. The BRTS buses runs on dedicated corridors, trespassing by other vehicles or objects increase chance of accidents. At present there is no ...
International Journal of Computer Applications (0975 – 888) Volume 47– No.9, June 2012
Simulation of WSN based Accident Monitoring and Avoiding System for BRTS Corridors using Ptolemy II Harshal Arolkar, PhD.
Kashyap Dhamecha
Darshan Patel
Associate Professor, GLSICT, Ahmedabad, Gujarat, India
M.Tech Students, Department of Computer Science, Gujarat University, Ahmedabad, Gujarat, India
M.Tech Students, Department of Computer Science, Gujarat University, Ahmedabad, Gujarat, India
ABSTRACT The BRTS buses runs on dedicated corridors, trespassing by other vehicles or objects increase chance of accidents. At present there is no automatic system available for monitoring the movements of bus or avoiding possibility of accidents on BRTS corridor. In this paper we have proposed system that uses WSN to monitor vehicular movement and avoid accidents. Wireless sensor network have became most interesting area of research since last decade. The nodes in wireless sensor networks are capable of monitoring the conditions and cooperatively communicate to the network. Each node in the network has critical impact on the system behaviour, so it is important to simulate the functioning of the nodes before its deployment in real world. In this paper we have simulated an accident monitoring and avoiding system using wireless sensor network for Bus Rapid Transit System. This paper is divided into five sections. Introduction of BRTS and wireless sensor network is given in section I, overview of proposed architecture and its solution is discussed in section II, information of the tool used for simulation is given in section III. Simulation work of proposed architecture for accident avoidance is shown in section IV. Finally conclusion is given in section V.
Keywords Accident, BRTS, Ptolemy II, VisualSense, WSN
1. INTRODUCTION On 14th October 2009 BRTS was launched in Ahmedabad. Currently there are 75 bus stations available in its phase one. The approximate distance between two stations is around 500m. The total length of the BRTS route is 45 km in phase one and will be further extended by 20 km in next phase. Total 730 buses are approved for this project in Ahmedabad BRTS, out of them around 200 buses are currently running. [12]. There is an increase in chances of accident due to trespassing by other vehicles, persons, animals or fallen objects on the BRTS corridors. Table 1 shows the result of survey done by the team of JANMARG in 2009-2010 [2]. As of now only 200 buses are running on corridors but if it will increase to 730 buses, this in turn also raises the chances of more number of accidents. At present there is no automatic system available for monitoring as well as avoiding possibility of accidents on BRTS corridor; we have proposed a solution to the same using wireless sensor network in [7].
Table 1: Survey of Accidents on BRTS Route Accidents involving BRTS Vehicles From15th Oct ‟09 to 14th June „10 Month
1st
2nd
3rd
4th
5th
6th
7th
8th
Total number
2
1
2
6
6
4
4
5
Fatalities
0
0
0
0
1
0
0
0
Serious injury
0
0
0
0
0
0
0
0
Minor injury
0
0
0
2
1
0
0
0
Accidents
2. RELATED WORK Chen Wenjie et. al in [4] and Tubaishat, M.et. al in [10] have proposed an intelligent transportation systems both using the wireless sensor technologies. In [4] the concentration is on improving the average speed of the road network and thus improves the efficiency of the road network. While in [10] the concentration is on traffic monitoring and traffic control. Both these papers though good in architecture, do not metion details about accident monitoring and control. Chen Wenjie et. al. in [3] and Malik Tubaishat et. al. in [8] have discussed how to control the traffic at intersections using wireless sensor networks. The main focus in both these paper is to identify the density of the traffic at cross section and then vary the signal timings. In India number of people using vehicles for commuting to work is very large, which increases traffic. Especially at the intersection in rush hours it is very difficult to handle traffic and also it leads in wastage of time. All state governments are trying to provide the people with alternative, economic and better transport facilities. Bus Rapid Transit System (BRTS) is one such initiative. We have proposed solution that uses the wireless sensor networks to reduce chances of accidents for BRTS corridors in the next section.
12
International Journal of Computer Applications (0975 – 888) Volume 47– No.9, June 2012
3. PROPOSED ARCHITECTURE AND SOLUTION The proposed architecture as described in [7], consists of wireless sensor network, database and mobile services. Sensor node deployed on the BRTS corridors will sense trespassing. Sensor will send information to the control centre if it in some trespassing within corridors. The control centre will generate a message and send it to the appropriate entity like, bus driver or security guards.
component called director. The Discrete Event (DE) domain of the Ptolemy II provides execution sequence where components can interact with each other via events with time stamps. DE domain supports dynamical changes in topology and multi threading. In multi thread, one thread can execute the simulation and other thread can change structure of model [9]. Because of its flexibility to simulate in different abstract level model for a same platform and capability of combining models with behavior defined in different domain, it is the best suitable simulation framework [11]. In Ptolemy II various specialized tool has been created from this framework, viz, HYvisual, Kepler, VisualSense. HYvisual is for hybrid system modeling, Kepler is for scientific workflow and VisualSense is for modeling and simulation of wireless network and sensor networks.
5. SIMULATION OF ACCIDENT MONITORING AND AVOIDING A simulator Ptolemy II is actor oriented; hence it requires creating a composite actor according to requirement. Simulation of the proposed architecture is described below.
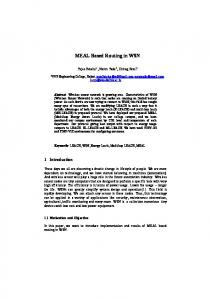
Figure 1: Architecture for Monitoring Bus Corridor In the proposed architecture, shown in Figure 1, at the lowest level, sensor nodes are deployed to sense different types of obstacle on the BRTS route. The BRTS route is divided into number of wireless sensor clusters. Individual sensor nodes within the clusters will communicate and coordinate to create a cluster. Once the cluster is formed, sensor nodes within the cluster will transmit data using multi-hop mechanism to cluster head which acts as the gateway. The gateway serves to communicate between source sensor node and control centre which may be at far distance from the place of object. Based on the data received the control centre looks into the database and creates a message for appropriate entity (security guard or bus driver) and sends message through mobile service. Bus driver who receive this message will know about the obstacle beforehand and thus can take appropriate action to avoid the accident. In the same way a security guard who receives the message, can go to the place of trespassing and take appropriate action if need be.
4. SIMULATION TOOL Modeling of wireless sensor networks requires sophisticated representation and analysis of communication channels, sensors, ad-hoc network protocols, localization strategies, energy consumption in sensor nodes, etc [6]. We have chosen Ptolemy II as a simulation tool. Ptolemy II has been under development since 1996, it is a successor to Ptolemy Classic, which was developed since 1990. The core of Ptolemy II is a collection of Java classes and packages. Ptolemy II is an open source software framework supporting actor oriented design. Actors built in java, are components that execute concurrently and communicate through message via communication ports. In Ptolemy II computation of the model is taken care by
We have generated one scenario for the simulation purpose in which there are three different routes including two cross roads. Accordingly five areas have been defined for the BRTS route and at the each cross road there is one security guard manning the cross road. Random trespassing of vehicles other than the BRTS buses has been done. Figure 2 shows the above mentioned scenario. Along with the said scenario other composite actors that we had to create are sensor node, gateway node, control centre and mobile service centre. The description of the same is mentioned as below.
Area 1 Route 1
Area 2
Area 3 Route 2
Area 4 Route 2
Area 5 Route 3
Figure 2: Route Scenario
5.1 Sensor Node A sensor node that emulates a motion detector has been created in VisualSense. We have created active motion detectors, these detectors send microwave or ultrasonic pulse in its range and according to the reflection it receives; it then identifies the obstacle. 32 such homogeneous sensor nodes have been created for the simulation. A sample sensor node is shown in Figure 3. The sensor is capable of detecting any activity of trespassing like unauthorized vehicles or animals, within the range of 200m radius. Each sensor node has been tagged with identification like sensor1, sensor2 and so on. A radio channel has been used to transmit the signal within its range. Whenever an object arrives in the range of the sensor; a signal will be reflected back to sensor using same channel and the node will identify it as an obstacle. A hop by hop mechanism has been implemented such that the message
13
International Journal of Computer Applications (0975 – 888) Volume 47– No.9, June 2012 reaches the gateway node, which also works as an aggregator. Delay Channel is used for multi hoping. Route 1 is covered with 7 sensor nodes, route 2 with 17 and route 3 with 8 nodes.
the messages to be sent to particular security guard and/or bus drivers. In case any sensor node goes down, it won‟t affect the whole system but produce delay in response time. The delay in the response time will vary, depending on location of the sensor nodes that have failed. Figure 5 shows the scenario where trespassing by other vehicle causes accident with BRTS buses, which is indicated by circle. With the use of proposed architecture this kind of accidents can be avoided. Table 2 shows an analysis, where the system will inform bus driver well in advance about that obstacle, this will reduce the chances of accidents. Column 2, 3, 4 in Table 2 is for normal case where bus driver is not aware about obstacles on route, and column 5, 6, 7 shows result after using our proposed system. Importantly column 6 shows time to react for the bus driver to avoid accident.
6. CONCLUSION
Figure 3: Composite Actor for Sensor Node
5.2 Gateway Node As mentioned in the architecture, the gateway node will receive information about detected obstacle from all the sensors through multi hop message passing. Gateway node has to provide this information to control centre. Before transferring the information, the gateway will map the location of the sensor that sent the data. The control centre thus will directly know about the location of the obstacle. If required this information may be aggregated and only single message may be sent. All gateway nodes will broadcast the information to control centre through erasure channel. ErasureChannel is a model of a wireless channel with a specified loss probability. If the loss probability is greater than zero then on each call to the “transmit” method for each receiver in range, with the specified probability, the transmission to that receiver will not occur. Whether a transmission occurs to a particular receiver, which is independent or whether it occurs to any other receiver.
5.3 Control centre The centralized node will receive the information from all gateway nodes through erasure channel. After receiving the area in which obstacle or trespassing is detected, control centre will try to look for the security guards and BRTS buses available within that area. For identifying the BRTS bus within the particular area, control centre will broadcast the query to each cluster. The query contains the name of area from which available buses are needed to be identified. Particular cluster will then send the list of available buses to control centre. After acquiring the list of buses and security guard to whom messages can be sent will be indentify. A database lookup will be done to extract information (mobile number) of these people. The list of entities to whom the messages are to be sent will finally be sent to mobile service centre. Figure 4 shows the output of this simulation. It shows information of each sensor node that has sensed the obstacle within their range. It also displays aggregated as well as unaggregated information at gateway node and the list of the person to whom message will be sent, extracted by control centre as well as mobile service centre. And finally it displays
This paper addresses the system for monitoring the movement of buses on the route of BRTS. The main aim of the system is to reduce accidents and improve the quality of transport system. The simulation results are encouraging and show that proper monitoring may reduce the accidents to large extents. It has been proved here that providing information of an obstacle to the bus driver well in advance reduces accidents, because bus driver will get some time to react and to avoid the accident. The physical implementation of the said system thus guarantees reduced accidents and better quality of transport system.
7. REFERENCES [1] Amrita Rai and Govind Singh Patel, July 2008, “Multiple traffic control using wireless sensor and density measuring camera”, Sensors and Transducers Journal, Vol. 94, Issue 7, pp.126-132. [2] BRTS survey Ahmedabad.
report
by
team
of
JANMARG,
[3] CHEN Wenjie, CHEN Lifeng, CHEN Zhanglong, TU Shiliang, "A Realtime Dynamic Traffic Control System Based on Wireless Sensor Network", Proceedings of the 2005 International Conference on Parallel Processing Workshops, 2005 IEEE. [4] Chen Wenjie, Gao Liqiang, Chen Lifeng, Chen Zhanglong, TU Shiliang, "An Intelligent Guiding and Controlling System for Transportation Network Based on Wireless Sensor Network Technology", Proceedings of the The Fifth International Conference on Computer and Information Technology, CIT '05, pp 810-814, 2005 IEEE. [5] Cook, D. J. and Das, S. K, October 2004,"Smart Environments: Technologies, Protocols, and Applications",Wiley Publications, ISBN: 978-0-47154448-7. [6] Documentation of "Visualsense: Visual Modeling For Wireless And Sensor Network Systems" [7] Dr. Harshal Arolkar, Kashyap Dhamecha, Darshan Patel, January 2012,“Architecture for Accident Monitoring in BRTS Corridors using Wireless Sensor Network”, Vol. 2 Issue 1 ISSN (Online) : 2230-8849. [8] Malik Tubaishat, Yi Shang and Hongchi Shi, "Adaptive Traffic Light Control with Wireless Sensor Networks", IEEE, 2007.
14
International Journal of Computer Applications (0975 – 888) Volume 47– No.9, June 2012 [9] Philip Baldwin, Sanjeev Kohli, Edward A. Lee, Xiaojun Liu, Yang Zhao, April 26-27, 2004, "Modeling of Sensor Nets in Ptolemy II", In Proc. of Information Processing in Sensor Networks, (IPSN), Berkeley, CA, USA. [10] Tubaishat, M., Zhuang, P., Qi, Q. and Shang, Y. (2009), Wireless sensor networks in intelligent transportation systems. Wireless Communications and Mobile Computing, 9: 287–302. doi: 10.1002/wcm.616
[11] V. Rosello, J. Portilla, Y. E. Krasteva, T. Riesgo, 2009 ,"Wireless Sensor Network Modular Node Modeling and Simulation with VisualSense", IEEE. [12] Working paper on Traffic volume characteristics & Junction Management by team of BRTS, October 2005.
Figure 4: Obstacle Identification and Avoidance
Figure 5: Scenario of Accident Occurrence
15
International Journal of Computer Applications (0975 – 888) Volume 47– No.9, June 2012 Table 2: Outcome of Simulation Accident Occurrence Scenario number
1
2
3
4
5
6
Total number of accident
3
Accident Avoidance
Area in which accident occurs
Time at which accident occurs in second
Time at which message reaches at bus driver
Time to react for bus driver
Status of accident avoidance (yes/no)
Area 1
23.02
20.015
3.005
Yes
Area 3
36.05
34.008
2.042
Yes
Area 5
59.00
57.51
1.49
Yes
Area 4
11.01
09.03
1.98
Yes
Area 5
59.00
57.51
1.49
Yes
Area 5
59.00
57.51
1.49
Yes
Area 1
23.02
20.015
3.005
Yes
Area 3
36.05
34.008
2.042
Yes
Area 4
11.01
09.03
1.98
Yes
Area 5
59.00
57.51
1.49
Yes
Area 1
23.02
20.015
3.005
Yes
Area 4
11.01
09.03
1.98
Yes
Area 5
59.00
57.51
1.49
Yes
Area 3
36.05
34.008
2.042
Yes
Area 4
11.01
09.03
1.98
Yes
2
1
4
3
2
16