Developments In Business Simulation & Experiential Exercises, Volume 21, 1994. 83 ... business courses assign grades based on competitive performance.
Developments In Business Simulation & Experiential Exercises, Volume 21, 1994 SIMULATION PERFORMANCE AND LEARNING REVISITED John Washbush & Jerry Gosenpud University of Wisconsin-Whitewater
ABSTRACT
management courses. Wolfe and Roberts (1993) argued further that simulation games have external validity in predicting future career success of players.
Learning scores were developed for consecutive classes of undergraduate business-policy course students participating in simulations. One-way analysis of variance performed on learning scores between subjects finishing in the top and bottom of their industries indicated a strong, significant tendency for bottom performers to learn more in the first study, but not in the replication. Learning score data were also analyzed using topmiddle-bottom classifications. No significant results occurred, but throughout there was a tendency for poorer simulation performers to learn more. These studies strongly suggest that simulation performance and learning do not covary, and they argue for continuing research.
Greenlaw and Wyman (1973) are not alone in questioning the validity of simulations. In an empirical investigation, Thorngate and Carroll (1987) found that, as the number of contestants in a simulation increased, luck played a more important role in determining a winner. They tried to eliminate the effects of luck by increasing the differences in skill level of participants, but were only partially successful. The implication of these results is that performance is not a pure reflection of learning that other factors including luck are important determinants of performance, and that simulation performance may not be a valid reflection of learning. Other studies have dealt with the specific kinds of learning goals accomplished in a simulation. Whiteley and Faria (1989) concluded that simulation games are effective in improving quantitative skills but are not effective in improving the acquisition of applied or theoretical knowledge. Wellington and Faria (1991) found no relationship between examination performance and simulation performance. They suggested that simulation play involves skills that may not be directly measurable by normal multiple-choice exams and further suggested that the pedagogical value of simulations should be focused on the development and acquisition of decision-making and interpersonal-communication skills as opposed to the acquisition of business principles and knowledge.
GENERAL An assumption most teachers make is that superior performance on a graded activity in a course is to be rewarded as an indicator of superior learning. According to Anderson and Lawton (1992), most teachers who use simulations do in fact grade on performance. They found that 93% of 146 surveyed academic users of simulations in undergraduate and graduate business courses assign grades based on competitive performance. This seems reasonable because intuition would suggest that people who perform best in simulations have learned how to play the game better. However, our research (Washbush & Gosenpud, 1993; Gosenpud & Washbush, 1993) indicates that this intuition may be seriously misplaced. We found that there was no linear relationship between learning and competitive performance, and, in some cases, poorer performers learned more than better performers. It seems quite plausible that those who perform best in a simulation simply happen upon an effective strategy at the beginning of the game and coast from then on, learning little, while players who begin poorly and struggle to improve over the period of play learn a great deal because of their efforts to compete and improve.
The. formal hypotheses of this study were:
The purpose of this paper is to continue the examination of the relationship between student learning and total enterprise (TE) simulation performance. An earlier paper (Washbush and Gosenpud, 1993) suggested that learning and simulation performance do not positively co-vary. For the present study, we continued the use of a set of researcher-prepared pen and paper examinations which test knowledge, skills, and abilities relevant to the simulation environment. From these tests we derived a learning performance measure and used it in comparison with simulation performance. The findings reported here support our contention that, while learning occurs over the period of simulation play, learning and simulation performance are not positively related. They also support our previous contention that learning may be linked to the effort students exert to compete and improve simulation standing.
(1)
Students who demonstrate superior performance in the simulation exhibit superior learning.
(2)
Students learn over the course of playing the simulation. METHOD
Subjects, Design and Procedure The subjects of this study were students enrolled in the required undergraduate Administrative Policy course at the University of WisconsinWhitewater. We initially studied one section (n — 43) that met during the spring, 1992 semester, and then conducted a replication (n - 39) during the fall, 1992 semester. The same instructor taught each section and used the Micromatic simulation (Scott & Strickland, 1985). Each section contained two Micromatic industries that were exposed to similar, but not identical, market characteristics. In all industries, play encompassed 13 quarters plus a practice round. All industries were identical with respect to decision factor weights and evaluative criteria. Game performance was 20% of the course grade; 5% of the course grade reflected peer ratings of individual contribution. Play was on a team basis throughout each semester. Teams ranged in size from 2 to 4, but the majority contained 3 members.
BACKGROUND There is extensive literature dealing with the topic of student learning in the simulation environment. However, the studies undertaken have had widely divergent purposes with equally divergent results. Some studies have dealt with the general validity of simulations for learning purposes. Greenlaw and Wyman (1973) questioned the validity of simulations for teaching purposes, but in a review of studies dealing with validity, Keys and Wolfe (1990) concluded that games are internally valid for use in strategic
Learning To measure learning, the researchers developed and used two parallel forms of a multiple-choice and short-essay examination. The examinations contained questions and situations routinely
83
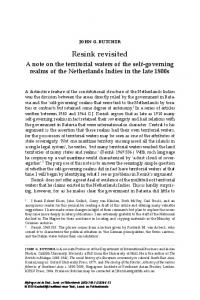
Developments In Business Simulation & Experiential Exercises, Volume 21, 1994 TABLE 1 ONEWAY ANOVA LEARNING VS SIMULATION STANDING RANKING BY TOP, BOTTOM SPRING 1992
confronted by companies competing in Micromatic. These included manipulating and analyzing the marketing-mix, making operating decisions, determining costs, understanding the consequences doing financial and cashflow analysis, and understanding the relationship between capacity and marketing expenses. The questions tapped analytical, synthesis, and application skills of the Bloom Taxonomy (Bloom, 1956). We administered Form 1 as a pre-test at the beginning of the semester. Students completed Form 2 at the end of the semester (as an announced final examination which counted 10% of course grade). Learning over the period of play was defined as the difference in percentage score for Form 2 minus percentage score for Form 1 (Learning — - %1). A positive learning score indicated learning improvement.
SOURCE Finishing Error Total LEVEL
At game’s end we categorized company performance within the industry, but with allowance for general performance aver the last half of play. We then used these categorizations in two sets of statistical analyses:
2.
The team performed in the Top, Middle or Bottom of the performance scores in their respective industry.
MS 398.0 90.9
F 4.38
TABLE 2 ONEWAY ANOVA LEARNING VS SIMULATION STANDING RANKING BY TOP, BOTTOM FALL 1992 SOURCE DF SS MS F Finishing Level 1 46.9 46.9 0.48 Error 32 3152.7 98.5 Total 33 3199.6
Performance Categories
The team performed in the Top or Bottom of the performance scores in their respective industry.
SS 398.0 3726.6 4124.6 MEAN
p 0.043
ST DEV 1(Top) 22 11.538 11.131 2 (Bottom) 21 17.669 7.499 Note: Positive learning scorns indicate Test 1 to Test 2 improvement-
Performance At the end of each round of play we determined quarterly and cumulative simulation performance using the normalized scoring routine contained in the Micromatic software. The scoring factors used were: after-tax earnings (40%), return-on-sales (30%), and return-on-assets (30%). We deliberately did not use leverage-manipulable factors (return-on-equity, earnings-pershare) to calculate performance.
1.
DF 1 41 42 N
Level
LEVEL
N
MEAN
ST DEV
1 (Top) 2(Bottom)
13 21
12.927 15.343
7.208 11.246
TABLE 3 ONEWAY ANOVA LEARNING VS SIMULATION STANDING RANKING By TOP, MIDDLE, BOTTOM SPRING 1992 SOURCE DF SS MS F Finishing Level 2 351.7 175.9 1.86 Error 40 3772.9 94.3 Total 42 4124.6 LEVEL N MEAN ST DEV 1 (Top) 19 11.689 11.249 2 (Middle) 9 14.589 10.094 3(Bottom) 15 18.166 6.969
RESULTS Data were pooled for each semester’s industries. Th. first hypothesis was that students who demonstrate superior performance in the simulation exhibit superior learning. Tables 1 through 4 pertain to that hypothesis. Table 1, for students enrolled in the Spring ‘92 semester, displays the results of a one-way analysis of variance (Oneway ANOVA) of learning scorns between than finishing in the top and bottom of their industries. This table clearly shows the lack of a positive relationship between learning arid performance. On the contrary, there was a strong, statistically significant tendency, for teams that performed poorly in the simulation to learn more. Table 2 displays a similar analysis for the replication (students enrolled during the Fall ‘92 semester). Although 39 students completed the course, live students, including one complete team, did not take the pre-test (Form 1). Accordingly, the data reflect 34 students. While, the analytic results are consistent with those shown in Table 1, they are not statistically significant. Nevertheless, there was a clear lack of a positive relationship between learning and performance.
P 0.495
P 0.168
The results shown in Table 4 indicate that those finishing in the middle hams more than those in the top and bottom, and bottom learning was nearly Identical to that of top. These results were not statistically significant.
In order to explore those data from a slightly different perspective, we analyzed the performance results for each phase of the study according to Top-Middle-Bottom performance. Table 3 shows results for the Spring semester. Learning was progressively greater for middle to bottom performers. However, these results were not statistically significant.
84
Developments In Business Simulation & Experiential Exercises, Volume 21, 1994 TABLE 4 ONEWAY ANOVA LEARNING VS SIMULATION STANDING RANKING BY TOP, MIDDLE, BOTTOM FALL 1992 SOURCE D SS MS F F Finishing Level 2 147.1 73.5 .75 Error 31 3052.5 98.5 Total 33 3199.6 LEVEL
N
MEAN
ST DEV
1 (Top) 2 (Middle) 3(Bottom)
17 12 15
12.760 17.234 12.941
8.122 8.728 11.398
teams performing in the middle of their industries achieved superior learning scores compared to those who led. In the replication (Table 4), bottom performers achieved approximately the same learning as the leaders, but well below those finishing in the middle. Performance patterns in one industry of the replication suggested that some teams, perhaps feeling that their situation was unrecoverable, may have simply surrendered. In that industry, a single team dominated from the third round of play and two teams rapidly sank to the bottom and remained there from the fourth round through the end of play. Those two teams exhibited the lowest team-average learning scores in their industry (and the lowest and fourth lowest teamaverage learning scores in both industries competing at that time). This may explain why bottom category teams performed poorly in the replication. The other industry playing at that time was more uniformly competitive, and teams in it did not exhibit a similar pattern of performance and learning scores.
p 428
These observations are similar to those made in our previous research where several teams in an industry with an undisputed leader seemed to give up, do poorly, and achieve very low learning scores (Washbush and Gosenpud, 1993). There are other possible explanations including a lack of competitive motivation or a sense of hopelessness preceding the start of play. Nevertheless, the phenomenon’s repetition suggests the presence of a complex set of variables that can exert a strong negative influence on some teams.
These results led us to reject the first hypothesis—top simulation performers did not obtain higher learning scores. In fact, they consistently exhibited the poorest learning performance. The second hypothesis was that students learn over the course of playing the simulation. We conducted t-tests on the differences in pre- (Test 1) and post-test (Test 2) percentage scores for each semester’s participants to determine whether or not learning had occurred. Table S displays the results of these analyses.
t-Test Spring 1992 Fall 1992
TABLE 5 t-TESTS PERCENTAGE SCORE DIFFERENCES PRE VS. POST-TEST SPRING 1992 & FALL 1992 n Mean Diff. STD t 43 14.555 9.91 9.63 34 14.419 9.85 8.54
Simulation team effort should be stronger when team members collectively believe that they have something to gain, intellectually or emotionally, by striving to improve performance. Such efforts, taken in good faith and with coherent effort (i.e., the struggle to compete, learn, or improve) should enable players to better understand techniques of analysis and decision making, and positive learning should result. Riding the crest or wallowing in the trough seem to produce little cognitive effect. Such teams appear to coast, do not struggle, and learn the least. It’s an old story—No pain, no gain!
p 0.00 0.00
The consistency of results in our studies, now having been conducted over five separate industries, using two instructors, and over two different periods of time, sends a clear message: Learning and simulation performance do not positively co-vary. ft is important, therefore, that instructors, who desire to grade solely on learning, not incorporate simulation performance standing in final grades. Incorporating performance standing in grades is only legitimate to that extent that instructors desire to mirror the reward-behavior of the marketplace.
Thus, as measured by our instrumentation, our studies showed that players learned, and they learned what the game intended to teach—namely financial statement and data analysis, understanding the consequences of decisions, and applying that understanding to subsequent decision-making situations. DISCUSSION
The similarity of results also substantiates a need for continuing research along the lines outlined in this paper. An important future concern should be to define and examine the conditions under which supportive struggle occurs and is sustained. Our studies suggest the existence of this struggle as a type of performance-related behavior. Although these performance-related variables are not easily controlled by researchers, they are probably measurable, researchable, and useful in explaining why some people learn and others do not. Understanding the presence and potential of these would be vital to all who desire to make the simulation experience as rewarding as possible for all participants, not just those who “win.”
This study dealt with the relationship between learning and performance in the total enterprise simulation. We found that there was no direct, positive linear relationship between the two variables. Those who performed best did not learn the most; those who performed the worst did not necessarily learn the least. On the other hand, as indicated in the results section, students did learn. The fact that learning occurred supports the validity of the simulation as a learning experience. Struggle to Improve As shown in Tables 3 and 4, in both the original and replication groups,
85
Developments In Business Simulation & Experiential Exercises, Volume 21, 1994 REFERENCES Anderson, PH. & Lawton, L. (1992) A survey of methods used for evaluating student performance on business simulations. Simulation & Gaming 23, 490- 498 Bloom, B. (ad.) (1956). The Taxonomy of Educational Objectives. Handbook I: The Cognitive Domain. New York: David McKay. Gosenpud, J. & Washbush, J. (1993) Comparing the simulation with the case approach: again! But this time using criteria appropriate for the simulation. Developments in Business Simulation & Experiential Exercises 20, 126. Greenlaw, P.S. & Wyman, F.P. (1973). The teaching effectiveness of games in collegiate business courses. Simulating & Games, 4, 259-294. Keys, B. & Wolfe, J. (1990). The role of management games and simulations in education and research. Journal of Management 16, 307336 Scott, T.W. & Strickland A.J. (1985) Micromatic: A Management Simulation Boston: Houghton Mifflin. Thorngate W. & Carroll, B. (1987) why the best person rarely wins Simulation & Games 18, 299-320. Washbush, J. & Gosenpud, J. (1993) The relationship between total enterprise simulation performance and learning. Developments in Business Simulation & Exercises 20, 141. Wellington, W.J. & Faria, A.J. (1991) An investigation of the relationship between simulation play, performance level and recency of play on exam scores. Developments in Business Simulation & Experiential Exercises, 18, 111-115. Whiteley, T.R. & Faria, A.J. (1989) A study of the relationship between student final exam performance and simulation game participation. Simulation & Games, 20, 44-64 Wolfe, J. & Roberts, C.R. (1993) A further study of the external validity of business games: five year peer group indicators. Simulation & Gaming, 24, 21-33
86