May 12, 2009 - Simulations were run on a standard Toshiba Satellite laptop computer with 2.0 Gb of RAM and 1.8-GHz dual core. Intel processor using ver.
The AAPS Journal, Vol. 11, No. 2, June 2009 ( # 2009) DOI: 10.1208/s12248-009-9111-6
Research Article Theme: Towards Integrated ADME Prediction: Past, Present, and Future Directions Guest Editors: Lawrence X. Yu, Steven C. Sutton, and Michael B. Bolger
Simulations of the Nonlinear Dose Dependence for Substrates of Influx and Efflux Transporters in the Human Intestine Michael B. Bolger,1,2,3 Viera Lukacova,1 and Walter S. Woltosz1
Received 7 January 2009; accepted 20 April 2009; published online 12 May 2009 Abstract. The purpose of this study was to develop simulation and modeling methods for the evaluation of pharmacokinetics when intestinal influx and efflux transporters are involved in gastrointestinal absorption. The advanced compartmental absorption and transit (ACAT) model as part of the computer program GastroPlus™ was used to simulate the absorption and pharmacokinetics of valacyclovir, gabapentin, and talinolol. Each of these drugs is a substrate for an influx or efflux transporter and all show nonlinear dose dependence within the normal therapeutic range. These simulations incorporated the experimentally derived gastrointestinal distributions of transporter expression levels for oligopeptide transporters PepT1 and HPT1 (valacyclovir); System L-amino acid transporter LAT2 and organic cation transporter OCTN1 (gabapentin); and organic anion transporter (OATP1A2) and P-glycoprotein (talinolol). By assuming a uniform distribution of oligopeptide transporter and by application of the in vitro Km value for valacyclovir, the simulations accurately reproduced the experimental nonlinear dose dependence. For gabapentin, LAT2 distribution produced simulation results that were much more accurate than OCTN1 distributions. For talinolol, an influx transporter distribution for OATP1A2 and the efflux transporter P-glycoprotein distributed with increasing expression in the distal small intestine produced the best results. The physiological characteristics of the small and large intestines used in the ACAT model were able to accurately account for the positional and temporal changes in concentration and carrier-mediated transport of the three drugs included in this study. The ACAT model reproduced the nonlinear dose dependence for each of these drugs. KEY WORDS: expression; intestine; saturation; simulation; transporter.
INTRODUCTION Many drug molecules are substrates for carrier-mediated intestinal transport, and there have been many reviews of drug interaction with the ATP-binding cassette (ABC) superfamily and the solute carrier (SLC) superfamily of transporters in the literature (1–7). At the apical membrane of enterocytes, the ABC transporters primarily result in efflux, while the SLC transporters facilitate influx. On the basolateral membrane, some members of the SLC family exhibit bidirectional transport. All of these transporters are thought to have evolved in order to facilitate absorption of hydrophilic nutrients that could not be well absorbed by a passive mechanism and to protect the animal or human from potentially poisonous hydrophobic xenobiotic molecules. Classification of drug molecules on the basis of metabolism and transport resulted in the development of a Biopharmaceutics Drug Disposition Classification System 1
Simulations Plus, Inc., 42505 10th Street West, Lancaster, California 93534, USA. 2 6 6th Street, Petaluma, California 94952, USA. 3 To whom correspondence should be addressed. (e-mail: bolger@ simulations-plus.com)
where highly metabolized (generally hydrophobic) molecules are assigned to class II and hydrophilic molecules that are excreted renally and in many cases are substrates for endogenous transporters are assigned to class III (8). Transporters also play an important role in distribution and elimination. Vectorial drug transport from blood to bile through the liver has been studied and modeled using simulation methods (9–11). These models included transporters in the basolateral membrane and in the cannilicular membrane. Finally, the study of drug interaction with transporters using simulation methods can help address a topic of growing concern to the US FDA: drug–drug interactions mediated by molecules competing for transporter sites (12,13). Modeling and simulation have played a significant role in our understanding of the dynamics of drug interaction with intestinal enzymes and transporters (14–20). The first application of Michaelis–Menten kinetics to model absorption was applied to 500-mg oral administration of cefatrizine (21) in which a one-compartment model for comparison of absorption by first-order, zero-order, or Michaelis–Menten kinetics was applied. Those authors concluded that the Michaelis–Menten simulations provided a statistically significant improvement in the optimized fit to in vivo data with a Km value of 2.4 μM. Sinko
353
1550-7416/09/0200-0353/0 # 2009 American Association of Pharmaceutical Scientists
354 and Amidon (22) used in situ rat single-pass perfusion to measure the Km for cefatrizine at 600 μM. This value of Km was applied to accurately simulate the nonlinear dose dependence of three doses of cefatrizine using a model based on seven small intestine compartments (14). Critical to accurate simulation of drug interactions with intestinal transporters is the knowledge of the regional distributions of transporter expression in the intestinal tract. Several groups have now used reverse-transcriptase polymerase chain reaction (RT-PCR) to measure the regional expression of messenger RNA (mRNA) specific for intestinal transporters (23–26). These studies are the foundation of our ability to simulate the nonlinear dose dependence for substrates of intestinal transporters. Our previous work with talinolol and the advanced compartmental absorption and transit (ACAT) simulations described here represent the first demonstrations of gastrointestinal simulation for saturable processes involving influx and efflux transporters using experimental regional distributions of transporters. It should be noted that very few experimental distributions of transporter expression have been verified by quantitation of protein rather than mRNA. For this study, the human distribution of P-glycoprotein is the only transporter for which protein expression has been measured. Although the authors are aware that mRNA levels do not always quantitatively predict protein expression levels, in the absence of additional data, we have assumed that mRNA levels reasonably well reflect the local expression of transporters and can be used for these simulations. For this study, two substrates for influx transport (valacycovir and gabapentin) and one substrate for both influx and efflux transporters (talinolol) were selected. The substrates for influx transporters exhibit decreasing bioavailability with increasing dose due to saturation of PepT1, HPT1, or LAT2. Talinolol is a substrate for the influx transporter Oatp1a5 in rat small intestine, but the Km value is 2 mM, and so it is not likely to saturate at normal therapeutic doses (27). OATP1A2 is the closest human equivalent to rat Oatp1a5 (28), so equal Km values for rat and human transporters were assumed.1 Talinolol is also a substrate for an efflux transporter and exhibits greater than proportional increases in area under the curve (AUC) with increasing dose due to saturation of the ATP-binding cassette transporter P-glycoprotein (P-gp). Three groups have reported the intestinal distribution of PepT1 (23–25), one group has reported the distribution of HPT1 (24), two groups have reported the distribution of P-gp (26,23), one group has reported the distribution of OCTN1 (25), one group has reported the distribution of LAT2 (29), and one group has reported the distribution of OATP1A2 (25). Each of these regional distributions was employed in GastroPlus simulations to find out which of them would best explain the clinical data for the nonlinear dose dependence of absorption for the different transporter substrates. Another objective was to determine if the Km values from in vitro studies could be used
Bolger, Lukacova and Woltosz directly in the ACAT simulations. This test provided a strong validation of the physiological accuracy of the ACAT model. Oligopeptide transporters are known to be expressed preferentially in the proximal intestine (duodenum, jejunum, and ileum), and both valacyclovir and amoxicillin have been shown to be substrates (30). One group reported very high levels of expression of PepT1 in the duodenum (approximately fivefold higher than jejunum) (24). Another group reported the highest expression of PepT1 in the ileum (23), and a third group reported a uniform distribution of PepT1 throughout the small intestine (25). Another oligopeptide transporter, HPT1, is also reported to be uniformly distributed in the small intestine (24). This study answers the question: What is the impact on simulation results using these three distributions? Gabapentin has been reported to be a substrate for two different intestinal transporters (31,32). At the apical membrane of the enterocytes, OCTN1 is the predominant transporter, while at the basolateral membrane of the enterocyte, LAT2 is the primary transporter. Simulation methodology answers the question: Which of these two transporters best accounts for the shape of the Cp vs. time profile and the nonlinear in vivo dose dependence? Talinolol is likely to be a substrate for an influx transporter (OATP1A2) and has also been shown to be a substrate for an efflux transporter (P-gp) both on the apical membrane of the enterocytes (33). Here, we ask the question: How does the distribution of OATP1A2 and P-gp affect the results and interplay between dose and regional transport? METHODS Simulations Simulations were run on a standard Toshiba Satellite laptop computer with 2.0 Gb of RAM and 1.8-GHz dual core Intel processor using ver. 6.0.0020 of the GastroPlus software. ACAT Model The ACAT model in GastroPlus was used to simulate the nonlinear absorption of five oral doses (100 to 1,000 mg) of valacyclovir, four oral doses (400 to 1,600 mg) of gabapentin, and four oral doses of talinolol (25 to 400 mg). The ACAT model compartment volumes, transit times, radii, pH, and lengths are listed in Table I. The relative physiological distribution of influx transporters PepT1, HPT1, OCTN1, LAT2, OATP1A2, and P-gp are listed in Table II. In all cases except for the P-gp protein expression measured by Mouly et al., the regional distributions represent mRNA expressions quantified by RT-PCR Northern blot analysis [(23), #2877] (24–26). GastroPlus simulations of the nonlinear dose dependence of Cp vs. time profiles for the three studied drugs were compared using these distributions. Valacyclovir
1
Note: Added in proof. Talinolol has been demonstrated to be a substrate for both human OATP1A2 and OATP2B1 in Xenopus oocytes (Ikumi Tamai, personal communication).
Valacyclovir is a polar ampholyte prodrug of acyclovir with high solubility and low passive permeability. Its absorption is completely dependent on oligopeptide transporters
Simulation of Carrier-Mediated Drug Transport in the Intestine
355
Table I. ACAT Model Compartment Parameters for Fasted Human Physiology Volume (mL)a
Compartment
b
Stomach Duodenum Jejunum1 Jejunum2 Ileum1 Ileum2 Ileum3 Caecum Asc. Colon
47 42 154 122 94 71 49 47 50
Radius (cm)
Length (cm)
Transit time (h)
pH
9.67 1.53 1.45 1.29 1.13 0.98 0.82 3.39 2.41
28.3 14.1 58.4 58.4 58.4 58.4 58.4 13.2 27.6
0.25 0.26 0.93 0.74 0.58 0.42 0.29 4.19 12.57
1.3 6.0 6.2 6.4 6.6 6.9 7.4 6.4 6.8
Volume of the small intestinal compartments was calculated as πr2 L×0.4. This represents the volume of fluid in the compartment volume as 40% of the geometrical volume of the compartment b Volume of the stomach was set at 47 mL in the fasted state and was independent of the length and radius a
(34,30,35). Table III lists the biopharmaceutical properties and references used in the simulation of the nonlinear dose dependence. Dissociation Constants Valacyclovir is ionized throughout the pH range in the gastrointestinal tract. The molecule has three major sites for ionization (36). Valacyclovir has high solubility throughout the physiological pH range (1.7–7.5), and our simulations predict it to be rapidly dissolved without precipitation for all five oral doses. Passive Permeability The effective permeability of valacyclovir measured in a steady-state uptake procedure in rat was found to be concentration-dependent with a Km = 1.2 mM (30). The permeability of valacyclovir in Caco-2 cells (1.70×10⁻⁶ cm/s) that were transiently transfected with PepT1 (Caco-2/hPepT1 cells) was found to be stereoselective for the L-amino acid and was tenfold more permeable than acyclovir (37). In addition, the permeability of valacyclovir was five times greater in Caco-2/hPepT1 cells than in Caco-2 cells that were not transfected with PepT1. This implies that the passive transcellular permeability of valacyclovir should be quite low (0.34×10⁻⁶ cm/s) compared with highly permeable molecules
like propranolol (26.6×10⁻⁶ cm/s) (38). Using this ratio and the experimental human jejunal effective permeability (hPeff) of propranolol (2.72×10⁻⁴ cm/s), the passive transcellular hPeff for valacyclovir was estimated to be 0.03×10⁻⁴ cm/s and was used for all simulations.
IV Pharmacokinetics Valacyclovir is rapidly hydrolyzed both in the lumen of the intestine and in the cytoplasm of the enterocyte. Virtually no valacyclovir (97 0.086 0.611 0 5811
(47) (45) Calculated by ADMET Predictor (43) (not detectable) (43)
Plasma unbound (%) Renal clearance (L h−1 kg−1) Vss (L/kg) First pass extraction (%) LAT2 transporter Km (μM)
(31) Set as GFR × fup for 41 year-old female Vss calc. (46) Not metabolized Fitted across five oral doses
Simulation of Carrier-Mediated Drug Transport in the Intestine
357
Table V. Key Biopharmaceutical and Pharmacokinetic Properties of Talinolol Property
Value
LogD7.4 Solubility (at pH 7.4 mg/mL) Jejunal permeability (cm/s)a pKa values Plasma unbound (%) Clearance (L h−1 kg−1) Vc (L/kg) k12 (h−1) k21 (h−1) k13 (h−1) k31 (h−1) First pass extraction (%) P-gp transporter Km (μM) OATP1A2 Km (μM)
1.08 1.23 1.29×10⁻⁴ Base=9.43 45 0.38 1.21 1.37 0.98 0.52 0.14 0 6.3 2000
a
Reference (59) (59) (27) (59) (60) Fitted from 30 mg i.v. data Fitted from 30 mg i.v. data Fitted from 30 mg i.v. data Fitted from 30 mg i.v. data Fitted from 30 mg i.v. data Fitted from 30 mg i.v. data Not metabolized Optimized across four oral (27)
(61) (61) (61) (61) (61) (61) doses
The permeability was measured in rat (1.29×10⁻⁴ cm/s) and converted to human permeability (4.06×10⁻⁴ cm/s) by considering the correlation between rat and human jejunal effective permeability (62)
of LAT2 has not been determined, the intracellular sites for other neutral amino acids are in the millimolar range (44). For this study, we fitted the apparent Km for the intracellular basolateral transporter binding site of gabapentin based on the regional distribution of the LAT2 transporter. Dissociation Constants Gabapentin is ionized in the stomach and is zwitterionic at pH values from 6 to 8 throughout the small and large intestines. The molecule has two major sites for ionization: a carboxylic acid (pKa =3.68) and a primary amine (pKa =10.7) (43). Gabapentin has high solubility throughout the physiological pH range (1.7–7.5) (45) and is predicted to be rapidly dissolved without precipitation using all four oral doses in our simulations.
was 49% and the F is reported to decrease to 29% at steadystate following a 1,600-mg tid dose (49). The fraction unbound in plasma used in the simulations was 98% (31). The pharmacokinetics of gabapentin following a single 400-mg solution dose (48) and the nonlinear dose dependence of escalating capsule doses from 400 to 1,600 mg tid (49) has been reported. In addition, a recent study compared 600 mg of Neurontin™ tid to an 1,800-mg gastric-retentive extended release formulation (50). The published distributions of intestinal OCTN1 (25) and intestinal LAT2 (29) were used for the GastroPlus simulations of gabapentin. The RMSE of the simulated vs. observed plasma concentration vs. time (Cp vs. time) profiles were determined for each distribution of transporter. Talinolol
Passive Permeability The effective permeability of gabapentin was measured using the in situ single-pass intestinal perfusion technique in fasted rats (43). The contribution of both passive and carriermediated transport was determined. The passive permeability was not significantly different than zero and the active component was saturable and concentration-dependent. Rather than run the gabapentin simulation in GastroPlus without any passive permeability, we decided to use the estimated human jejunal permeability from ADMET Predictor (S+Peff). The estimated value of S+Peff was 0.04×10⁻⁴ cm/s, and this value was used for all gabapentin simulations.
We have previously reported simulations of the nonlinear dose dependence, pharmacokinetics, and pharmacodynamics for talinolol. This study will compare the accuracy of those simulations with more recently reported distributions of P-gp (15). The methods for GastroPlus simulations and biopharmaceutical properties for talinolol were reported previously (15) and are repeated briefly here. Key biopharmaceutical properties used in the simulations of talinolol are shown in Table V. Talinolol is a moderately hydrophobic weak base that is 99.9% cationic at pH=6.5 and has moderate human jejunal permeability. Talinolol also has four instances of a type II pattern of electron donors which has been suggested to be
Physiologically Based Pharmacokinetics Physiologically-based PK was used with a calculated value of Vss using the method of Berezhkovskiy (46) along with the reported value for plasma protein binding (fup= 98%) (31) and logD7.4 =−1.1 (47) as a starting point for optimization/fitting in GastroPlus across all five doses. Plasma concentration vs. time data in humans for one 400-mg PO solution dose (48) and four tablet PO doses from 400 mg tid up to 1,600 mg tid (49) were obtained. The reported mean absolute bioavailability (F) of the 400-mg PO IR tablet dose
Table VI. Percent Absorbed and Bioavailable for Oral Valacyclovir Using Englund PepT1 Distribution Dose (mg)
Fa%
F%
F% without active transport
100 250 500 750 1,000
81.7 76.7 70.9 66.7 63.5
53.8 50.5 46.7 43.8 41.7
1.5 1.5 1.5 1.5 1.5
358
Bolger, Lukacova and Woltosz Table VII. Comparison of Simulation Results for Valacyclovir Using Four Different Oligopeptide Distributions
Dose (mg) 100 250 500 750 1,000 Ave. R2
E-PepT1a F% (R2, RMSE) 53.8 50.5 46.7 43.8 41.7 0.93
(0.88, (0.93, (0.96, (0.93, (0.96,
0.096) 0.16) 0.19 0.36) 0.31)
M-PepT1b F% (R2, RMSE) 54.5 51.0 46.9 43.9 41.7 0.92
(0.84, (0.91, (0.95, (0.92, (0.96,
H-PepT1c F% (R2, RMSE)
0.12) 0.18) 0.23) 0.39) 0.31)
50.3 44.2 37.1 32.1 28.7 0.68
(0.69, (0.74, (0.67, (0.69, (0.60,
0.18) 0.32) 0.56) 0.62) 0.93)
H-HPT1c F% (R2, RMSE) 54.3 (0.86, 50.9 (0.92, 47.1 (0.95, 44.3 (0.92, 42.3 (0.96, 0.92
0.11) 0.17) 0.21) 0.38) 0.33)
a
From (23) From (25) c From (24) b
commonly found in substrates of P-gp (51). It has been suggested that molecules with moderate permeability have the greatest potential to be influenced by the efflux transporters (19). Molecules with higher permeability are able to diffuse rapidly across the cell membrane and avoid binding to the P-gp substrate binding site. Molecules with lower permeability tend to be too polar for partitioning into the membrane and achieving access to the P-gp binding site. Also, since talinolol is a substrate for the rat Oatp1a5 and most likely a substrate for the human influx transporter
OATP1A2, intracellular enterocyte concentrations of talinolol might be higher than if the only influx mechanism was passive, resulting in a greater influence of P-gp in vivo.
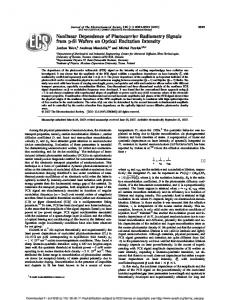
Fig. 1. Valacyclovir simulations using experimental distributions of PepT1. Oral doses of valacyclovir (100 to 1,000 mg) administered to volunteers at risk for developing Herpes simplex virus (HSV) (39). a Using the Englund distribution of PepT1 (23). b Using the Herrera– Ruiz distribution of Pept1
Fig. 2. Observed and simulated AUC for each dose. The observed AUC was calculated using trapezoidal integration of the observed Cp vs. time profiles. Simulated AUCs represent the area under the curve for the simulated lines. The line of identity (black line) would occur in the absence of nonlinear dose dependence
RESULTS Valacyclovir Valacyclovir is a polar ampholyte with high solubility and low passive permeability. Table VI shows the simulated values for percent absorbed (Fa%) and bioavailability (F%) across all five doses with and without influx transport due to oligopeptide transporters in the apical membrane of the small intestine. The Englund distribution of PepT1 was used to simulate these results. It is clear that the absorption is completely dependent on influx transport since the fraction absorbed in the absence of such transporters is