A simple and highly sensitive analytical isoelectric focusing (IEF) technique using immunofixation with anti-C2 serum followed by silver staining has been ...
Journal of Immunological Methods, 117 (1989) 9-15
9
Elsevier JIM 05045
Simultaneous detection of allotypes in native and activated human C2 by isoelectric focusing and silver staining Oscar G. Segurado and Antonio Arnaiz-Villena lnmunologia, Hospital Primero de Octubre, 28041 Madrid, Spain
(Received4 August 1988, accepted 14 September1988)
A simple and highly sensitive analytical isoelectric focusing (IEF) technique using immunofixation with anti-C2 serum followed by silver staining has been developed in order to study simultaneously the structural polymorphism of both native C2 and C2 activation fragments (C2a MW 74 000 and C2b MW 34000). Structural C2 polymorphism of C2*B and C 2 " C allotypes (but not of C2"A1) was found to be associated with the C2a fragment, whereas C2b appears to display no polymorphism. Commercially available IEF gels and C2 antisera gave reproducible allotyping data and make this technique of general use for densitometric analysis of native and activated C2. In vivo C2 activation was studied through C2a/native C2 area ratios obtained b y computerized densitometry. Significantly lower ratios were observed in healthy individuals than in patients with systemic lupus erythematosus (SLE), reflecting an abnormally high classical pathway activation of complement in SLE. This methodology may be of value for immunogenetic and functional studies of other complement components. Key words: C2 polymorphism; C2 activation; Isoelectricfocusing; Silver staining; Lupus erythematosus
Introduction
Genetic polymorphism of certain complement components is observed using functional tests or specific precipitation with antibodies after electrophoresis or analytical isoelectric focusing (IEF). Polymorphism of the second component of complement (C2) comprises four structural alleles (A1per, 1976) and a null allele (Meo et al., 1977) and
Correspondence to: O.G. Segurado, Inmunologia, Hospital Primero de Octubre, 28041 Madrid, Spain. Abbreviations: BF, factor B of the alternative complement pathway; C2, second component of complement; EACA, eaminocaproic acid; EDTA, ethylenediaminetetraaceticacid; HLA, human leukocyteantigen; MHC, major histoeompatibility complex; PBS, phosphate-buffered saline; SD, standard deviation; SLE, systemiclupus erythematosus.
is of considerable interest since the C2 gene is part of the major histocompatibility complex (MHC) and may be involved in susceptibility to some autoimmune diseases (Rittner and Bertrams, 1981). Also, C2 deficiency is the most common of the complement deficiencies (present in about 0.01% of the population) and has been associated with systemic lupus erythematosus (SLE) (Ueda et al., 1983). In vitro activated complement fragments may also disclose polymorphic differences found in native proteins (Alper, 1976). However, physiologically or pathologically (i.e., through immune complexes) activated complement split products circulate in quantities that are too small to be detected by conventional techniques. This is especially relevant for C2 and C2 split products (C2a and C2b) which have the lowest serum concentration (about 40 # g / m l total C2) amongst the classi-
0022-1759/89/$03.50 © 1989 ElsevierSciencePublishers B.V. (BiomedicalDivision)
10 cal pathway components. C2a quantitation is cumbersome (SfiSholm and Sturfelt, 1984) and no C2b studies have been published either in healthy or diseased individuals. In fact, quantitation of complement activation products in immune complex-mediated diseases m a y provide a more sensitive measure of disease activity than other tests (Sturfelt et al., 1983; Miller et al., 1986). We report here a simple analytical IEF technique using immunofixation and high sensitivity silver staining which allows simultaneous detection of C2 allotypes in both native protein and activated fragments. In addition, functional C2 activation studies may be performed by densitometric scanning of band patterns (activated/native C2 area ratios) as illustrated by a comparison of plasma samples from healthy individuals and SLE patients.
Materials and methods
Blood samples E D T A - p l a s m a plus e-aminocaproic acid (EACA) 5 m M was collected at 4 ° C , centrifuged within 1 h at 4 ° C (2500 x g, 5 min), aliquoted in small volumes, frozen in liquid nitrogen and stored at - 8 0 ° C until use. E D T A and low temperature were used to avoid complement activation and E A C A served to inhibit serum proteases. Samples from 79 healthy blood donors and laboratory staff and 18 SLE patients who fulfilled four or more of the 1982 Revised American Rheumatism Association Criteria (Tan et al., 1982) were studied. The common (C2"C), the basic (C2*B) and one of the acidic (C2*A1) allotypes were included. Segregation was assessed in ten families (29 sibs). A homozygous C2-deficient serum (kindly provided by Dr. Lopez-Trascasa, Madrid) was also tested. C2 controlled aging and activation Serum samples were aged under controlled conditions as described for BF (Segurado and Arnaiz-Villena, 1989). In vitro C2 activation with heat-aggregated I g G (human I g G from Miles Laboratories) was carried out as described by Sj~Sholm et al. (1986).
Isoelectric focusing and immunofixation Polyacrylamide gel plates ( P A G plates, LKB, Sweden) and an LKB 2117 Multiphor unit with an LKB 2197 power supply were used. After 30 min prefocusing (same electrical conditions as for focusing) 1 ~1 of undiluted sample (maintained at 4 ° C until loading), with about 0.03 /tg of C2 protein, was applied on a piece of paper, 43 m m ( p H range 4-6.5) or 68 m m (pH range 3.5-9.5) away from the cathode strip; the paper was removed after 50 min. Native C2 and C2a were studied at p H 4-6.5 after focussing for 140 min at 6 ° C , 24 W, 1600 V and 25 mA. Electrode strips were soaked with 0.1 M glutamic acid in 0.5 M H3PO 4 (anode) and 0.1 M fl-alanine (cathode). Native C2 and C2b were studied at p H 3.5-9.5 after focussing for 80 min at 6 o C, 30 W, 1400 V and 30 mA. Electrode strips were soaked with 1 M H3PO 4 (anode) and 1 M N a O H (cathode). Immediately after focussing, 0.5 ml of anti-C2 serum (Serotec, England) diluted 1 / 2 in PBS with 6% polyethylene glycol was spread over the gel surface and incubated for 1 h at room temperature in a humidity chamber. Gels were rinsed for 2 days in Tris buffer (0.04 M Tris-HC1, 0.14 M NaC1, p H 7.6) and then for 3 h in distilled water before silver staining. Some gels were stained with Coomassie Blue as previously described (Regueiro and Arnaiz-Villena, 1985). Band pI gradients were determined by interpolation in the linear gradient obtained through low and broad p I calibration kits (Pharmacia, Sweden). Silver staining The technique of Morrisey (1981) was optimized for use after I E F and immunofixation. The gels were soaked in 0.05% dithiothreitol for 20 min. The solution was poured out and gels were then treated for 20 min with 0.1% silver nitrate (400 ml/gel), and then rinsed rapidly with distilled water followed by a small amount of developer (see below). The gels were then soaked with developer (200 btl of 37% formaldehyde in 400 ml 3% sodium carbonate) until enough b a n d contrast (light yellow background) was obtained, which was usually after 5 min. The staining was stopped by adding a sufficient volume (about 5 ml) of 2.3 M citric acid to bring down the p H to about 7. The gels were then rinsed in distilled water for 30
11
Densitometry
min, placed in 10% glycerol for 1 h, left drying for about 4 h and covered with a plastic sheet. All steps were performed at room temperature under normal lighting and with continuous agitation.
Scanning of the immunofixed phenotypic patterns and computerized integration of the respective scan areas were performed with a CliniScan
!
>A
1
2
3
4
5
6
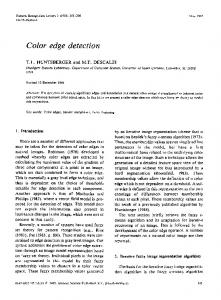
Fig. 1. C2a (A) and native C2 (N) patterns on silver stained IEF gels (pH range 4-6.5) after C2 immunofixation. Note faint C2b bands (arrow). Samples were collected under optimal conditions (lanes 1, 2 and 6), or were aged (lanes 4 and 5) or activated with heat-aggregated IgG (lane 3). C2 phenotypes: 1, BB; 2 and 3, BC (same sample); 4 and 5 (father and son), AIC; 6, CC.
]2
densitometer (Helena Laboratories, U.S.A.) employing a slit size of 0.5 m m and a 545 nm filter.
Results
Native and activated C2 allotyping The native C2 banding patterns which were observed in the range p I 5.4-5.6 included comm o n (C2"C), basic (C2*B) and one of the rare acidic (C2"A1) structural alleles (Figs. 1-3). All
three allotypes segregated in ten families (not shown). C2A1C samples of a father and son are shown in Fig. 1. Native C2C displayed two major bands, four faint anodic and three faint cathodic accessory bands. Native C2B and C2A1 showed additional major and accessory bands in a more cathodic (C2B) and an anodic (C2A1) position. When using I E F gels in the p H ranges 4-6.5 and 3.5-9.5 respectively faint anodic ( p I 4.6-4.8) and cathodic ( p I 5.9-7.5) bands were observed in E D T A - E A C A plasma samples collected under op-
D /
>B
I
N
1
2
3
4
5
6
7
Fig. 2. C2b (B) and native C2 (N) patterns from silver stained IEF gels (pH range 3.5-9.5) after C2 immunofixation. Note faint C2a bands (arrows). Samples were collected under optimal conditions (lanes 1-3) or activated with heat-aggregated IgG (lanes 4-7). C2 phenotypes: 1 and 4, CC; 2 and 5, BB; 3 and 6, BC; 7, A1C.
13
timal conditions. These faint bands where not observed when Coomassie Blue was used for staining. These faint bands were observed to be of increased intensity when using normal aged sera or plasma from SLE patients and the anodic and cathodic bands have previously been shown to correspond to C2a and C2b respectively (Nagasawa and Stroud, 1981). This was confirmed after C2 cleavage with heat-aggregated human IgG (Figs. 1 and 2). The C2a banding pattern showed a polymorphic variation corresponding to the native C2*B and C2"C allotypes, whilst no difference between C2" C and C2*A1 was observed (Fig. 1). The C2b banding pattern was found invariable for the C2"C, C2*B and C2*A1 allotypes (Fig. 2). No bands were detected in a homozygous C2-deficient individual (not shown), confirming that neither the native C2 protein nor traces of C2 cleavage products were present.
Densitometric scanning The intensities of the native C2 and C2a bands were evaluated by densitometry (Fig. 4) in order to determine C2 activation. Plasma samples (randomly selected and optimally collected) taken from 18 healthy individuals and 18 SLE patients were focussed in the same IEF gel (pH range 4-6.5)
®
m .--. IC2 i
i
native
Area Ratios:
0.29
~ L
C2a
o.62
_3
~
Nit
C2 native
J
Fig. 4. Densitometric scanning traces from a healthy individual (A) and a patient with SLE (B) showing clear differences in the C2a and native C2 regions (selected areas are marked by arrows). Area ratios were calculated as described (see materials and methods section).
and scanned. This experiment was performed in duplicate. C2a/native C2 ratios were calculated by dividing the integral of C2a band intensities by the integral of the native C2 band intensities. These estimates were expressed as a percentage of the total scanned areas. The coefficients of variation observed in duplicate samples ranged from 3.1 to 9.3%. The mean values of duplicates were statistically evaluated: healthy individuals had significantly lower ratios (mean + SD = 0.39 + 0.10; n = 18) than SLE patients (0.66 + 0.27; n ffi 18) ( P < 0.01; Mann-Whitney U test). Thus, if a value greater than 0.59 (mean + 2 SD) was considered abnormal, ten out of 18 SLE patients and none of the healthy individuals had an abnormally high level of C2 activation.
m
Discmsion
IC2a /
Ale
CC
Be
BB
®
Fig. 3. Schematic representation of native C2 (non-activated samples) and C2a (activated samples) IEF band patterns of different C2 phenotypes as obtained by the techniques described (see materials and methods section).
C2 allotyping In contrast to previously reported IEF detection methods for C2 allotyping (i.e., hemolytic overlay (Alper, 1976), Coomassie Blue staining after immunofixation (Regueiro and Arnaiz-Villena, 1985) and immunoblotting (Uring-Lambert et al., 1985)) the silver staining procedure has several advantages: (1) higher sensitivity with increased band sharpness and resolution of closely spaced bands; (2) the use of small sample volumes
14
permitting shorter focusing times and reduced band distortion (usually due to excessive salt a n d / o r protein content of the samples); (3) a significant reduction of the amounts of anti-C2 serum required and shorter washing times compared with Coomassie Blue staining; and (4) C2 allotyping of aged samples or samples with pathologically activated C2. Indeed, with this method faint bands corresponding to traces of acidic (C2a) and basic (C2b) C2 fragments (Nagasawa and Stroud, 1981) are detected (in addition to native C2 bands) in plasma samples from healthy and diseased individuals collected under optimal conditions. Thus, we were able to confirm a previous report (Uring-Lambert et al., 1985) showing that the C2 polymorphic site for C 2 " C and C2*B is located in the C2a fragment. These authors could not detect C2b fragments (probably due to its low concentration) and no C2*A allele was studied. However, we have clearly detected C2b (placed cathodically to the native C2) and found no polymorphism of C 2 " C and C2*B. We have also analyzed a C2*A1 allele included within a BF* F, HLA-A2, -B49 (B21) haplotype (unpublished data) which may correspond to the C2*Al-bearing haplotype (BF* F, HLA-A3 and -B21) reported by Raum et al. (1979). Surprisingly, our C2*A1 allotype was not different from the C 2 " C allotype when comparing C2a- and C2b-specific band patterns; this may be due to a loss of C2*A1 polymorphic site after C2 cleavage or to conformational changes. This technique was also useful for distinguishing excessive C2 activation (undetectable native C2, but presence of C2a and C2b bands) from C2 homozygous deficiencies (no C2 bands at all). This distinction is not possible with other allotyping methods. C2 activation studies
Densitometric analysis of immunofixed C2 on IEF gels has several advantages compared with other methods for studying C2 activation (i.e., combined functional and immunochemical assays (Sturfelt et al., 1983; Ueda et al., 1983; Greffard et al., 1987) or C2a quantitation by crossed immunoelectrophoresis (Sj~Sholm and Sturfelt, 1984)). Firstly, it is easier to perform (up to 39 samples may be simultaneously analyzed) and it needs less
sample amount; secondly, it is less time consuming, thus reducing artifactual C2 activation; and thirdly, combination of silver staining with commercially available IEF plates results in higher sensitivity and reproducibility. The C2a/native C2 ratio, derived from differential intensities of precipitation bands, probably parallels a true concentration ratio and is fully adequate for statistical analysis, as previously reported for C3d/native C3 ratios (Sun and Stagias, 1986). Our findings of significantly higher C2 ratios (i.e., C2 activation) in SLE patients than in healthy individuals suggests classical pathway activation in SLE, probably through circulating immune complexes. Further studies are in progress to evaluate the clinical relevance of C 2 a / n a tive C2 ratios in this and other immune complex mediated diseases.
Acknowledgements This work was supported in part by a grant from the Servicio de Formaci6n de Personal Investigador, Spain. We thank Dr. J.R. Regueiro for helpful discussions and P. Gutierrez and M.A. Valero for technical assistance.
References Alper, C.A. (1976) Inherited structural polymorphism in human C2: evidence for genetic linkage between C2 and BF. J. Exp. Med. 144, 1111. Greffard, A., Bougarit, J.J., Le Maho, S. and Lambre, C.R. (1987) Determination of the complement component C2 by ELISA in human serum and bronchoalveolar lavage fluids. Immunol. Lett. 15, 145. Mao, T., Atkinson, J.P., Bernoco, M., Bernoco, D. and Ceppeilini, R. (1977) Structural heterogeneity of C2 complement protein and its genetic variants in man: A new polymorphism of the HLA region. Proc. Natl. Acad. Sci. U.S.A. 74, 1672. Miller, III, J.J., Olds, L.C., Silverman, D., Milgrom, H. and Curd, J.G. (1986) Different patterns of C3 and C4 activation in the varied types of juvenile arthritis. Pediatr. Res. 20, 1332. Morrisey, J.H. (1981) Silver stain for proteins in polyacrylamide gels: A modified procedure with enhanced uniform sensitivity. Anal. Biochem. 117, 307. Nagasawa, S. and Stroud, R.M. (1977) Cleavage of C2 by Cls into the antigenically distinct fragments C2a and C2b:
15 Demonstration of binding of C2b to C4b. Proc. Natl. Acad. So. U.S.A. 74, 2998. Raum, D., Glass, D., Carpenter, C.B., Schur, P.H. and Alper, C.A. (1979) Mapping of the structural gene for the second component of complement with respect to the human major histocompatibility complex. Am. J. Hum. Genet. 31, 35. Regueiro, J.R. and Arnaiz-ViUena, A. (1985) Immunofixation for C2 typing: C2 allotypes in Spaniards in relation to HLA, BF and C4. Hum. Genet. 71, 58. Rittner, C. and Bertrams, J. (1981) On the significance of C2, C4, and factor B polymorphisms in disease. Hum. Genet. 56, 235. Scgurado, O.G. and Arnaiz-Villena, A. (1989) Two BF F subtypes, but no BF S, BF F1 or BF S07 subdivision, are found by isoelectric focusing. Vox Sang., in press. SjiSholm, A.G. and Sturfelt, G. (1984) Cleavage of C2 in pathological serum and plasma studied by crossed immunoelectrophoresis. Acta Pathol. Microbiol. Immunol. Scand. Sect. C 92, 265.
Sturfelt, G., Sj~holm, A.G. and Svensson, B. (1983) Complement components, C1 activation and disease activity in SLE. Int. Arch. Allergy Appl. Immunol. 70, 12. Sun, T. and Stagias, J. (1986) Detection of complement activation in immune complex diseases: Six methods compared. Clin. Chem. 32, 2170. Tan, E.M., Cohen, A.S., Fries, J.F., Masi, A.T., McShane, D.J., Rothfield, N.F., Scalier, J.G., Talal, N. and Winchester, R.J. (1982) The 1982 revised criteria for the classification of systemic lupus erythematosus. Arthritis Rheum. 25, 1271. Ueda, A., Kusaba, T. and Yanase, T. (1983) Determination of the second component of complement (C2) by electroimmunoassay in sera from patients with systemic lupus erythematosus. Clin. Exp. Immunol. 53, 217. Uring-Lambert, B., Gas, S., Goetz, J., Mauff, G., Goldmann, S.F., FrSssler, M., Bender, K. and Hauptmann, G. (1985) Detection of the genetic polymorphism of human C2 (native protein and C2a fragment) by immunoblotting after poliacrylamide gel isoelectric focusing. Complement 2, 185.