Electronic Supplementary Material (ESI) for Physical Chemistry Chemical Physics. This journal is © the Owner Societies 2015
Simultaneous Detection of Electronic Structure Changes from Two Elements of a Bifunctional Catalyst Using WavelengthDispersive X-ray Emission Spectroscopy and in situ Electrochemistry Sheraz Gula,f, Jia Wei Desmond Ngb, Roberto Alonso-Moric, Jan Kerna,c, Dimosthenis Sokarasc, Eitan Anzenbergd, Benedikt Lassalle-Kaisera,#, Yelena Gorlinb,%, Tsu-Chien Wengc, Petrus Zwarte, Jin Z. Zhangf, Uwe Bergmannc, Vittal K. Yachandraa, Thomas F. Jaramillob,d,* and Junko Yanoa,d,* aPhysical
Biosciences Division, Lawrence Berkeley National Laboratory, Berkeley, CA 94720, USA. of Chemical Engineering, Stanford University, Stanford, CA 94305, USA. cSLAC National Accelerator Laboratory, 2575 Sand Hill Rd., Menlo Park, CA 94025, USA. dJoint Center for Artificial Photosynthesis, Lawrence Berkeley National Laboratory, Berkeley, CA 94720, USA. eAdvanced Light Source, Lawrence Berkeley National Laboratory, Berkeley, CA 94720, USA fDepartment of Chemistry, University of California at Santa Cruz, Santa Cruz, CA 95060, USA. #Present address: Synchrotron SOLEIL, L’Orme des Merisiers, Saint-Aubin, 91191 Gif-sur-Yvette, France. %Present address: Technical University of Munich, Lichtenbergstrasse 4, 85748 Garching, Germany. *Corresponding authors:
[email protected],
[email protected] bDepartment
Fig. S1 (a) Mn K-edge spectrum of MnNiOx film poised at 0.7 V compared with Mn3O4, α-Mn2O3, γ-MnOOH, Mg2+-birnessite, Todorokite and β-MnO2. (b) MnNiOx sample held at 1.8 V overlaid with α-Mn2O3, Mg2+-birnessite, Todorokite, β-MnO2 and λ-MnO2.
Fig. S2 (a) EXAFS spectra of ORR phase overlaid with Mg2+-birnessite, Todorokite and MnOOH. The sample shows similarities with birnessite phase. (b) Comparison of the MnNiOx film poised at 1.8V with β-MnO2, λ-MnO2 and Todorokite.
Fig. S3 (a) Ni K-edge spectrum of MnNiOx sample poised at 0.7 V overlaid with those of Ni(OH)2, β-NiOOH, NaNiO2 and γ-NiOOH. (b) MnNiOx sample under OER conditions compared with β-NiOOH, NaNiO2, γ-NiOOH and NiPPI.
Fig. S4 (a) Fourier transformed EXAFS spectrum of MnNiOx sample poised at 0.7 V overlaid with Ni(OH)2, NaNiO2 and β-NiOOH. (b) Comparison of OER phase with βNiOOH, γ-NiOOH, and NiPPI.
(a)
(b)
(c)
Fig. S5 (a) EXAFS spectra of MnNiOx at Mn and Ni K-edge under ORR conditions along with the corresponding model compounds (b) XRD diffractograms of (i) blank Si3N4, (ii) Au-coated Si3N4, (iii) MnOx on Au-Si3N4, (iv) NiOx on Au-Si3N4, and (v) MnNiOx on Au-Si3N4. (c) Mn and Ni K-edge Fourier transformed EXAFS spectra of MnNiOx sample under OER conditions overlaid with λ-MnO2 and γ-NiOOH. XAS of MnOx The MnOx sample was prepared using a similar electrodeposition procedure as that of the MnNiOx sample except that Ni was absent from the deposition solution and only the Mn deposition potential (0.57 V vs. Ag/AgCl) was used, as described in the experimental section. In situ XAS measurements were performed on this MnOx sample. The XANES spectra for the dry MnOx sample is shown in Fig. S6a along with spectra measured in situ under ORR (0.7 V vs. RHE) and OER conditions (1.9 V vs. RHE), but at a higher potential as compared to MnNiOx (1.8 V vs. RHE) as no change was observed for the spectrum collected at 1.8 V (Fig. S6b). As the MnOx sample is catalytically active for the OER at 1.8 V with no observable changes in the spectrum compared to that at 0.7 V, this suggests that a birnessite-like phase is responsible for the OER just as it was for the ORR. Increasing the potential to 1.9 V, however, resulted in a shift of the MnOx spectrum to higher energy, indicating an increase in the oxidation state of Mn. This suggests that the presence of Ni in the MnNiOx sample had shifted the redox potential of Mn(III)/Mn(IV) to a lower value than for pure MnOx . Mn K-edge XANES spectrum of the dry MnNiOx is also shown for comparison and the edge appears at lower energies as compared to that of dry MnOx, in agreement with an overall higher oxidation state of Mn in the as prepared, dry MnOx sample.
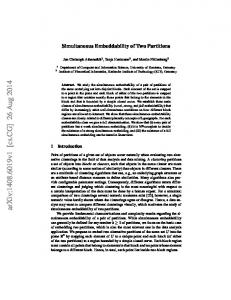
Fig. S6 (a) Mn K-edge XANES spectra of MnOx when dry, under ORR (0.7 V) and OER (1.9 V) conditions. Mn XANES spectrum of dry MnNiOx is also shown for comparison. (b) XANES spectrum of MnOx measured under ORR conditions (0.7 V) overlaid with the spectrum measured at 1.8 V. No significant change was observed when the potential was raised from 0.7 V to 1.8 V. The difference spectrum obtained by subtracting 1.8 V spectrum from that at 0.7 V is also shown to highlight the small change. (c) Spectrum of MnOx ORR phase compared with Mg2+-birnessite and Mn XAS spectrum of MnNiOx under ORR conditions. (d) Mn spectrum of MnOx under OER conditions (1.9 V) overlaid with spectrum of λ-MnO2 and MnNiOx under OER potential (1.8 V).
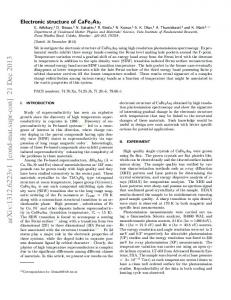
In Fig. S6c, the Mn K-edge spectrum of MnOx at 0.7 V (ORR conditions) is compared with that of MnNiOx at the same potential as well as that of the birnessite standard. Much like the case with MnNiOx, the MnOx catalyst at ORR potentials shows similarities with birnessite, suggesting an oxidation state of Mn close to +3.6. Fig. S6d compares the XANES spectrum of MnOx under OER conditions (1.9 V) with that of MnNiOx under similar OER conditions (1.8 V), in comparison with the λ-MnO2 standard. Again, the spectra resemble that of λ-MnO2, indicating a Mn oxidation state of +4. We note that the observed oxidation states exhibited by MnOx under either ORR or OER potentials can depend greatly on the synthesis route, as reflected by the slight differences reported here versus those from a previous MnOx study in which a different synthetic route involving a calcination step was employed.1 Our ongoing work aims to elucidate how and why these differences occur. The EXAFS spectra of MnOx under ORR and OER conditions along with those of dry MnOx and MnNiOx are shown in Fig. S7a. For MnOx the peaks have higher amplitudes as compared to those of dry MnNiOx, and reasonable amplitudes are observed for peaks between 4-6 Å that originate from the multiple scattering. This indicates a more long range order structure in MnOx as compared to the mixed oxide. This is expected as MnNiOx was deposited layer by layer, alternating between Mn and Ni, which is prone to have some degree of disorder. Whereas EXAFS traces derived from dry MnOx and under OER conditions have considerable amplitude between 5-6 apparent distance, the intensity is reduced under ORR conditions. This suggests that the ORR phase has a higher degree of structural disorder. However, the ORR phase of MnOx has a more ordered lattice than
the ORR phase in MnNiOx, as demonstrated by Fig. S7b where the EXAFS intensity for the former is higher. On the other hand, as revealed in Fig. S7c, the OER phase was found to be slightly more ordered in MnNiOx as compared to MnOx. Attempts were also made to study the pure NiOx phase, but XAS signal was dominated by metallic Ni and changes happening at the electrochemically active oxide surface were buried underneath. Long range order and presence of metallic Ni was also observed in XRD data (Fig. S5b).
Fig. S7 (a) Mn K-edge EXAFS spectra of MnOx under dry, ORR (0.7V) and OER (1.9 V) conditions. For comparison, EXAFS spectrum of dry MnNiOx is also shown. (b) EXAFS spectra of MnOx ORR phase overlaid with Mg2+-birnessite, ORR phase of MnNiOx. The sample shows similarities with birnessite phase. (c) Comparison of the MnOx electrocatalyst poised at 1.9 V with, λ-MnO2 and Mn EXAFS spectrum of MnNiOx collected at 1.8 V.
Table S1: Atomic distances obtained from EXAFS curvefitting . MnNiOx
Ni(OH)2
Ni-O
2.06 (0.01)
2.06 (0.01)
Mn-O
1.92 (0.01)
Ni-M
3.06 (0.01)
Mn-M
2.88 (0.01)
birnessite
-MnO2
1.90 (0.01)
1.90 (0.02)
2.88 (0.01)
2.86 (0.01)
birnessite
-MnO2
1.90 (0.01)
1.90 (0.02)
2.88 (0.01)
2.86 (0.01)
3.12 (0.01)
MnNiOx
-NiOOH
Ni-O
1.89 (0.01)
1.88 (0.01)
Mn-O
1.90 (0.01)
Ni-M
2.83 (0.01)
Mn-M
2.87 (0.01)
2.82 (0.01)
Fig. S8 Cyclic voltammogram also does not show any distinct oxidation peak in the case of MnOx, as such a feature would likely be hidden underneath the capacitive behavior. The small reduction peak around 1.1 V corresponds to gold reduction.
References 1.
Y. Gorlin, B. Lassalle-Kaiser, J. D. Benck, S. Gul, S. M. Webb, V. K. Yachandra, J. Yano and T. F. Jaramillo, Journal of the American Chemical Society, 2013, 135, 8525-8534.