ANALYTICAL SCIENCES NOVEMBER 2002, VOL. 18 2002 © The Japan Society for Analytical Chemistry
1241
Simultaneous Determination of Paracetamol and Caffeine by Flow Injection–Solid Phase Spectrometry Using C18 Silica Gel as a Sensing Support P. ORTEGA-BARRALES, R. PADILLA-WEIGAND, and A. MOLINA-DÍAZ† Department of Physical and Analytical Chemistry, Faculty of Experimental Sciences, University of Jaén, Paraje Las Lagunillas, E-23071 Jaén, Spain
A continuous and simple UV-photometric flow-through biparameter-sensing device has been developed for the simultaneous determination of paracetamol and caffeine at 275 nm. The sensor is based on temporary sequentiation in the arrival of the analytes to the sensing zone by on-line separation using C18 bonded phase beads (the same as that used in the sensing zone) placed into a minicolumn just before the flow cell. The sample containing these compounds is injected into the carrier solution; paracetamol is determined first because it passes through the minicolumn, while caffeine is strongly retained in it. Then, caffeine is conveniently eluted from the precolumn and develops its transitory signal. Using 200 µl of a sample and deionized water as a carrier, the analytical signal showed a very good linearity in the ranges of 10 – 160 µg ml–1 and 3.5 – 50 µg ml–1 with detection limits of 0.75 and 0.56 µg ml–1 for paracetamol and caffeine, respectively. If deionized water with the pH adjusted at 12 was used as a carrier solution, these parameters were 25 – 400 and 4 – 55 µg ml–1 with 2.0 and 0.50 µg ml–1 as the detection limits, respectively. The biparameter optosensor was satisfactorily applied to the simultaneous determination of these two analytes in pharmaceuticals. (Received April 23, 2002; Accepted August 28, 2002)
Introduction Paracetamol and caffeine appear to be associated in many commercial formulations because caffeine increases the analgesic character of paracetamol. Paracetamol (acetaminophen, N-acetyl-p-aminophenol, 4acetamidophenol) is used as analgesic and antipyretic agents. Its action is similar to aspirin, and is a suitable alternative for patients who are sensitive to aspirin.1 Numerous methods have been reported for the determination of paracetamol in pharmaceuticals based on different techniques: volumetry,2 spectrophotometry,3–5 spectrofluorometry,6 high-performance liquid chromatography (HPLC) with photometric7–9 and FTIR10 detection, thin-layer chromatography,11 Raman spectrometry,12 near infrared reflectance spectrometry,13 electroanalytical14,15 and FI-FTIR16 methods. Caffeine (7-methyltheophylline, 1,3,7-trimethylxantine), a xanthine alkaloid, is a powerful stimulant of the central nervous system. Several methods have been reported for its determination: spectrophotometry,17,18 HPLC19,20 and gas chromatography (GC).21 There are many methods for the simultaneous determination of paracetamol and caffeine, including spectrophotometric,22–25 electroanalytical,26,27 HPLC28–30 and GC techniques.31 HPLC and GC methods require expensive instrumentation and are relatively highly time-consuming. Although, spectrophotometric methods are simpler and faster, the † To whom correspondence should be addressed. E-mail:
[email protected]
simultaneous determination of both analytes is not possible by conventional direct UV absorption measurements, because of the spectral overlap. To resolve this problem, a derivative22,23 absorbance ratio technique25 and PLS calibration24 have been used. In this paper, we propose a simple, fast and inexpensive spectrophotometric continuous-flow sensor for the simultaneous determination of paracetamol and caffeine based on the use of C18 silica gel as an active solid phase. This biparameter sensor is based on the strong retention of caffeine in a column filled with C18 silica gel (placed on line just before the cell). The paracetamol passes through it while developing an analytical signal in the solid phase placed into the flow cell (also C18 silica gel). Then, caffeine is conveniently eluted from the column and also carried to the cell in the detector. In both cases, the intrinsic UV absorbance of the analyte is used as an analytical signal. Thus, the solid phase acts as a dual sensing zone that responds successively to the two analytes. Thus, a temporary discrimination in the detection is carried out to achieve a satisfactory resolution of the mixture with this simple UV spectrophotometric flow-through biparameter optosensor. It was successfully applied to the determination of these analytes in pharmaceuticals.
Experimental Reagents All solutions were prepared from analytical reagent-grade chemicals using deionized water. Paracetamol (Fluka) and caffeine (Merck) stock solutions
1242
ANALYTICAL SCIENCES NOVEMBER 2002, VOL. 18
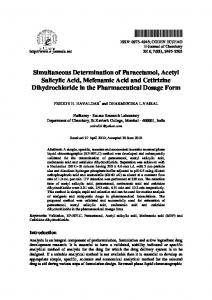
Fig. 1 Schematic diagram of the FIA system: C1 and C2, carriers; E, eluting; S, sample; PP, peristaltic pump; S, injection valve; SV1 and SV2, selection valves; P, precolumn; D, detector; FC, flow cell; W, waste; PC, computer.
(1000 mg l–1) were prepared by directly dissolving the drug in deionized water. Only freshly prepared solutions of paracetamol were used due to the low stability. The caffeine solution was stable for at least four weeks at 4 – 5˚C. Work solutions were prepared fresh daily by appropriate dilution with deionized water. The following carrier solutions used were: Carrier 1 (C1), deionized water; Carrier 2 (C2), deionized water adjusted at pH 12 with NaOH (Panreac). A 10% (v/v) aqueous methanol (Panreac) solution was used as an eluting medium. C18 bonded silica (Waters) with average particle sizes of 55 – 105 µm, packed both in a precolumn (1 mm i.d.) of 27 mm length and in a Hellma 138-QS flow-through cell, was used to measure the solid-phase UV light absorption in the sensing zone. Instrumentation A Varian Cary 50 Spectrophotometer, equipped with a Hellma 138-QS flow cell (1-mm optical path length and 50 µl inner volume), was used for absorbance measurements. It was controlled by a microprocessor fitted with the WIN UV software package. A four-channel Gilson Minipuls-3 peristaltic pump with a rate selector, teflon tubing of 0.8 mm i.d. and two Rheodyne Model 5041 injection valves were also used. One of them was the injection valve, and the other was connected as a selection valve. Procedure The continuous-flow diagram used is shown in Fig. 1. A sample solution (200 µl) containing both paracetamol (10 – 160 µg ml–1) and caffeine (3.5 – 50 µg ml–1) was injected into the carrier solution (C1) and pumped at a flow rate of 1.23 ml min–1. Caffeine was retained on a solid support (C18) placed in the precolumn, while paracetamol, which passed through it, was carried to the flow cell and retained within. The paracetamol retention signal was monitored at the working wavelength (275 nm). When paracetamol was totally eluted by the carrier, itself, by turning the selection valve, a 10% (v/v) aqueous methanol solution was used as an eluting solution for caffeine retained in the precolumn, carrying it, in turn, to the flow cell. Its transitory retention signal was also monitored at 275 nm. Then, by again turning the selection valve, the baseline was restored and it became possible to make another sample injection. The same procedure was carried out with carrier C2. In this case, the sample solution inserted into the carrier solution contained 25 – 400 µg ml–1 of paracetamol and 4 – 55 µg ml–1 of caffeine.
Fig. 2 Scans in homogeneous solution: 50 µg ml–1 of paracetamol (1), 20 µg ml–1 of caffeine (2) and mixture (3). They are made in stopped-flow with a 1-mm path length.
Results and Discussion Preliminary study The spectral features of both analytes in homogeneous solutions of paracetamol, caffeine and a mixture of both were previously established; they are shown in Fig. 2. These spectra were obtained using a cell of 1-mm optical path length. The maximum absorbance wavelengths were 245 nm for paracetamol and 275 nm for caffeine. Because the scans of the analytes overlapped, it was impossible to conduct a simultaneous determination by conventional spectrophotometric measurements without significant errors. Because caffeine is a minor constituent in pharmaceuticals (in a ratio from 0.3 to 0.02 times that of paracetamol), we chose 275 nm as the wavelength for a simultaneous determination of the analytes, the peak height being used as an analytical signal. Optimization of variables All of the variables were studied with deionized water (C1) as the carrier solution. In order to choose the most convenient solid support for both analytes, several anionic-exchange resins (Sephadex QAE A-25 and DAE A-25), resins without exchangeable groups and nopolar sorbents (C18 silica gel) were tested Caffeine was only retained in C18 because of the absence of functional ionic groups; its retention was found to be very strong. Paracetamol was also retained in C18 silica gel, but not very strongly; however, it was not retained on Sephadex QAE A-25 because at the carrier pH value it was not ionized.7 C18 gel was selected as a solid support. Although the changes in the positions of the absorption maxima were observed for both analytes when the species were retained on the sorbent, the analytical signals were about 36 and 43-times higher than that obtained in solution for paracetamol and caffeine, respectively. Level of the packing in the flow cell and amount of resin in the packed precolumn The level of support in the flow cell is a very important variable. This level was just the necessary one to fill it up to a sufficient height (15 mm), permitting a light beam to pass completely through the solid layer. With only C18 silica gel in the flow cell, it is impossible to
ANALYTICAL SCIENCES NOVEMBER 2002, VOL. 18
Fig. 3 FIAgram corresponding to the influence of the precolumn length on the separation. (1) Without precolumn, (2) – (5): 5, 20, 23 and 27 mm of precolumn length, respectively.
Fig. 4 Influence of the carrier pH: (1) 100 µg ml–1 of paracetamol; (2) 10 µg ml–1 of caffeine.
simultaneously determine a mixture of both analytes for the same reasons as mentioned above (in a preliminary study). We tried to separate them on-line before they reached the detection zone by means of a different retention-elution process of the analytes in C18. We therefore used a precolumn filled with the same solid support as that used in the flow cell (C18) just before the cell in order to retain caffeine in it, while paracetamol was carried to the flow cell. The precolumn length (and consequently, the amount of silica gel) was studied from 0.5 to 35 mm, using an i.d. of 1 mm. Separation of the analytes was completed for 27 mm (Fig. 3). We chose a precolumn length of 27 mm because it gave a satisfactory and complete separation in the minimum possible time. Influence of the carrier pH, eluent nature and sample pH The effect of the pH on the retention of both analytes in the solid support was studied a) in the carrier and b) in the sample by injecting each one of them alone. The single monochannel manifold in Fig. 1 was used, but without a precolumn. Deionized water with an appropriate concentration of HCl or NaOH (pH ranging from 2 to 12) was used as carrier. The obtained results are shown in Fig. 4. It can be seen that the retention of caffeine was found to be independent of the pH from 2 to 12, whereas the signal of paracetamol decreased drastically at pH values above 10 due to dissociation of the phenolic group (pKa = 9.5). In this way, analytical signals were similar for both analytes at pH = 12. This is a very interesting result: because of the usually higher concentration values of paracetamol with respect to caffeine in pharmaceuticals (from 3
1243
Fig. 5 Effect of the flow rate on the elution time. Inset, absorbance signal vs. flow rate: (1) paracetamol, (2) caffeine.
to 44), the simultaneous determination of both analytes in FIA systems is usually not possible due to the great difference between both signals. Thus, two different aliquots would have to be injected in order to obtain concentrations appropriate for the respective calibration line. In the sensor developed here, a simultaneous determination can be achieved just by choosing the appropriate carrier pH value, according to the paracetamol/caffeine ratio found in the pharmaceuticals. Therefore, in order to analyze mixtures of both analytes in different proportions, deionized water (C1) and aqueous NaOH (pH 12) (C2) were selected as carrier solutions. Although paracetamol was easily eluted by the two carrier solutions, the elution of caffeine from the solid support could not be performed by any of them because of its strong retention on it. Therefore, a study of the effect of different solvents as eluting agents for caffeine had to be performed. Two hydroalcoholic solvent mixtures ranging between 5 and 25% (v/v) from methanol and ethanol were tested. For this study, the single monochannel manifold shown in Fig. 1 was used. Both mixtures could elute caffeine when the alcoholic concentration increased; both the elution time and the analytical signal decreased. As for the nature of the eluting solution, for the same concentration, the use of ethanol produced a decrease in the analytical signal of 30% compared to the use of methanol, whereas the decrease in the elution time was lower (only 10%); 10% aqueous methanol (v/v) was selected as the eluting solution. The absorbance value for caffeine was not influenced by the sample pH in the tested range (2 – 12). The signal from paracetamol decreased at sample pH values above 10, as was also observed in a study of the influence of the carrier pH. Hence, it was necessary to adjust the sample pH value to that of the carrier solution only when the value of the carrier solution pH was 12. Optimization of FIA variables A study of the influence of the flow system variable (flow rate and sample volume) was performed. The effect of varying the flow rate from 0.7 to 1.66 ml min–1 is shown in Fig. 5. An increase in the flow rate did not significantly influence the analytical signals for both analytes (100 and 10 µg ml–1 of paracetamol and caffeine, respectively); however, it did produce a more significant decrease in the elution time from 0.7 to 1.23 ml min–1. A flow-rate value of 1.23 ml min–1 was chosen; a flow rate value beyond this could cause excessive pressure in the system.
1244
ANALYTICAL SCIENCES NOVEMBER 2002, VOL. 18 Table 2
Interference study for caffeine and paracetamol Tolerance level (µg ml–1 interfering species/µg ml–1 analyte) Paracetamol
Caffeine Foreign species
Fig. 6 Influence of the sample volume: (1) 25 µg ml paracetamol, (2) 5 µg ml–1 of caffeine.
–1
Table 1
of
Analytical parameters
Parameter
Caffeine
Paracetamol C1
C2
C1
C2
Sample volume (200 µl) Calibration line – 0.003 – 0.005 0.002 Intercept (absorbance) 0.014 5.5 × 10⁻³ 2.1 × 10⁻³ 1.72 × 10⁻² 1.70 × 10⁻² Slope (ml µg–1) 4 – 55 Linear dynamic range 10 – 160 25 – 400 3.5 – 50 (µg ml–1) 0.9998 0.9999 0.9992 Correlation coefficient 0.9997 Detection limit 0.75 2.0 0.56 0.50 (µg ml–1) 2.5 6.7 1.9 1.7 Quantification limit (µg ml–1) 0.5 2.1 3.1 1.8 RSD, % (n = 10)
By injecting in the flow system different volumes of a solution containing both analytes, paracetamol (25 µg ml–1) and caffeine (5 µg ml–1), the effect of this variable on the analytical signal could be assessed (Fig. 6). The absorbance signal increased linearly for paracetamol up to 1500 µl (A = 0.13 + 3.3 × 10⁻⁴v) with increasing injection volume (v, µl). Beyond this volume, the signal increase was very low. This increase was linear (A = 0.03 + 3.1 × 10⁻⁴v) for caffeine in all ranges tested (from 40 to 2300 µl) due to the strong retention of caffeine on the sensing zone. One of the main advantages of the sensor is the potential increase in the sensitivity as the sample volume taken for analysis is increased. This makes it possible to select the most appropriate volume of sample taking while considering the concentrations of samples that are going to be analyzed. Analytical features of the proposed method Calibration graphs were obtained simultaneously for both analytes by following the proposed method for both carrier solutions. The analytical figures of merit for 200 µl sample volume are given in Table 1. Very good linearity was found in the concentration ranges a) 10 – 160 and 3.5 – 50 µg ml–1 for paracetamol and caffeine, respectively, using C1 as the carrier solution, and b) 25 – 400 and 4 – 55 µg ml–1 for carrier C2, respectively. The detection and quantification limits were estimated as the concentration of the analyte that produced an analytical signal equal to three32 and ten33-times the standard deviation of the background absorbance, respectively. The reproducibility was established for ten analyses of solutions containing 50/5 µg ml–1 of paracetamol/caffeine with C1 and 250/8 µg ml–1 with C2. The sampling frequency for the
Solid Solid Solid Solid Homo Homo phase phase phase phase geneous geneous carrier carrier carrier carrier solution solution C2 C1 C1 C2
Saccharose 3.5 Lactose > 50a Saccharin > 4a Salicylamide 2 Brompheniramine maleate 0.5 Codeine 0.1 Dimenhydrinate 0.025
4 30 3 2
1 2.5 0.8 0.4
0.8 > 10a > 1a 0.4
1 6 0.3 1.6
0.2 1 0.1 0.06
1 0.1 0.4
0.05 0.02 < 0.01
2 0.02 0.005
0.5 0.08 0.04
0.03 < 0.01 < 0.001
a. Maximum ratio tested.
simultaneous determination of both analytes was 15 and 20 h–1 with C1 and C2, respectively. Effect of foreign species In order to determine the effect of foreign species, a tolerance study was performed with those compounds that are usually found along with paracetamol and caffeine in pharmaceuticals. The study was carried out with 100 and 20 µg ml–1 of paracetamol and caffeine, respectively, for both carriers. Foreign species were added to the samples at concentrations higher than those usually found in pharmaceutical preparations. Also, an interference study in a conventional homogeneous solution (without solid phase) was performed with carrier C1 and by using 500 and 50 µg ml–1 of paracetamol and caffeine, respectively. The tolerance limit was established as the maximum concentration of foreign species that caused a relative error of ±3% in the analytical signal. As can be seen, the tolerance to the presence of foreign species (Table 2) is, in general, very much higher than the amount in which these compounds are usually found together with the analytes in pharmaceuticals. In addition, the tolerance limits are very much higher than those corresponding to the determination of the analytes by direct UV measurements in the solution method (i.e. up to 40-times higher for dimenhydrinate than in solution without a solid support). This is due to the selectivity conditions stated concerning the active solid support, which excludes from it and, consequently, from the detection zone, all those species that can not be retained on it in the working conditions. It should be emphasized that the dimenhydrinate tolerance drastically increases when using carrier C2. This makes possible the determination of paracetamol and caffeine in commercial preparation “Saldeva forte”, where the ratios dimenhydrinate/paracetamol (15:500) and dimenhydrinate/ caffeine (15:50) are higher than the tolerance level when using carrier C1 (and, in turn, 40-times higher than the tolerance level of the same method in solution without a solid support). Application of the method The proposed sensor was applied to the determination of paracetamol and caffeine in pharmaceuticals using the standard calibration graph method for an injection volume of 200 µl. The results for this method (Table 3) are in a very good concordance with the theoretical contents of both analytes given
ANALYTICAL SCIENCES NOVEMBER 2002, VOL. 18 Table 3
1245
Determination of paracetamol and caffeine in pharmaceutical preparations Labeled (mg/unit)
Pharmaceutical
a
Melabón * Ilvicob* Saldeva fortec* Saridond** Hemicraneale** Apiretalf** Duorolg** Termalginh** Gelocatili** Durvitanj**
Recovery mean ± SD (%)
Ratio
Paracetamol
Caffeine
Paracetamol/caffeine
Paracetamol
Caffeine
350 500 500 250 300 100 500 500 650 —
8 30 50 50 100 — — — — 300
44 17 10 5 3 — — — — —
99.9 ± 1 99.6 ± 0.6 101.2 ± 0.7 99 ± 1 100 ± 1 100 ± 0.3 100.5 ± 0.8 99.8 ± 0.5 100.2 ± 0.7 —
99.2 ± 0.3 99.2 ± 0.2 99.8 ± 0.5 100.7 ± 0.1 102.1 ± 0.2 — — — — 98.9 ± 0.4
a. Melabón: paracetamol 350 mg, caffeine 8 mg, propifenazone 200 mg. b. Ilvico: paracetamol 500 mg, caffeine 30 mg, brompheniramine maleate 3 mg, saccharose 4.85 mg, sodium cyclamate 35 mg, sodium saccharin 7.5 mg. c. Saldeva forte: paracetamol 500 mg, anhydrous caffeine 50 mg, dimenhydrinate 15 mg. d. Saridon: paracetamol 250 mg, caffeine 50 mg, propifenazone 150 mg. e. Hemicraneal: paracetamol 300 mg, caffeine 100 mg, ergotamine tartrate 1 mg, excipients with lactose c.s. f. Apiretal (1 ml): paracetamol 100 mg, saccharin 5 mg, other excipients: glycerine, polyethylenglycol 600, acid benzoic, essence of raspberry and water. g. Duorol: paracetamol 500 mg, excipients: sodium saccharin 20 mg, others, c.s. h. Termalgin: paracetamol 500 mg. i. Gelocatil: paracetamol 650 mg, excipients: dioxide of silice, cellulose powdered, estearate magnesium, starch of maize, c.s. j. Durvitan: caffeine 300 mg. *Determination by using carrier C2. **Determination by using carrier C1.
by the manufacturers. It should be noted that the simultaneous determination of the analytes in “Melabón” and “Ilvico” (as well as in “Saldeva forte”, too) could be possible by using carrier C2 due to the high ratios of paracetamol/caffeine in these commercial preparations. In order to check the accuracy of the proposed procedure, a recovery study was also performed by adding different known amounts of the analytes to four pharmaceuticals: two of them with carrier C1 and other two with carrier C2. The percentage of recovery is given in Table 4.
Table 4 Recovery study of paracetamol and caffeine in pharmaceuticals
Pharmaceutical
Hemicraneala
Saridona
Conclusions Melabónb
The developed flow-injection solid-phase UV spectrophotometric system is very simple. The C18 bonded phase silica gel beads packed in the cell respond alternately to the analytes. Their arrival to the sensing solid support is time discriminated: a precolumn strongly retains on-line one of them (caffeine), whereas the other one reaches the sensing microzone. The second analyte also develops a transitory signal after being eluted from the precolumn. Therefore, the used solid support (C18 silica gel) performs three functions: a) A transitory retention and preconcentration of the analytes in the detection zone, itself; b) An on-line separation of the analytes in the precolumn; c) To drastically increase the selectivity (increase factors for tolerance levels of 10, 20, and even 40 are achieved). Finally, just by selecting the carrier solution C2 (pH = 12) the simultaneous determination (one only injection) of paracetamol and caffeine at paracetamol/caffeine (w/w) ratios as high as 100 can easily be performed.
Acknowledgements The authors are grateful to the Dirección General de Enseñanza Superior (DGES) of the Ministerio de Educación y Cultura (project No. PB98-0301) for financial support.
Caffeine
Paracetamol
Ilvicob
Added Recovery ± SD, Added Recovery ± SD, (mg/unit) (mg/unit) % % 25 50 100 25 50 100 50 100 200 25 50 200
100.5 ± 0.6 100.2 ± 0.1 100.0 ± 0.2 99.3 ± 0.3 99.5 ± 0.1 99.7 ± 0.2 98.3 ± 0.5 101.2 ± 0.1 100.3± 0.1 99.5 ± 0.5 100 ± 1 99.3 ± 0.2
5 10 20 5 10 20 5 10 20 5 10 20
99.3 ± 0.6 100.2 ± 0.2 99.9 ± 0.4 100.6 ± 0.3 100 ± 1 101.5 ± 0.2 98.0 ± 0.4 99.6 ± 0.5 100.1± 0.2 98.7 ± 0.6 99.0 ± 0.3 99.9 ± 0.4
a. Carrier C1. b. Carrier C2.
References 1. A. Wade (ed.), “Martindale, The Extra Pharmacopeia”, 27th ed., 1979, The Pharmaceutical Press, London. 2. M. K. Srivastava, S. Ahmed, D. Singh, and I. C. Shukla, Analyst, 1985, 110, 735. 3. K. K. Verma, A. K. Gulati, S. Plod, and P. Tyagi, Analyst, 1984, 109, 735. 4. A. S. Issa, H. A. Beltagy, M. Gabr Kacem, and H. G. Daabees, Talanta, 1985, 32, 209. 5. M. J. Ayora Cañada, M. I. Pascual Reguera, A. Ruiz Medina, M. L. Fernández de Córdova, and A. Molina Díaz, J. Pharm. Biomed. Anal., 2000, 22, 59. 6. J. L. Vilchez, R. Blanc, R. Avidad, and A. Navalón, J. Pharm. Biomed. Anal., 1995, 13, 1119. 7. A. G. Goicoechea, M. J. L. De Alda, and J. L. Vila-Jato, J.
1246
ANALYTICAL SCIENCES NOVEMBER 2002, VOL. 18
Liq. Chromatogr., 1995, 18, 325. 8. G. Indrayanto, A. Sunarto, and Y. Adriani, J. Pharm. Biomed. Anal., 1995, 13, 1555. 9. S. Ravisankar, M. Vasudevan, M. Gandhimathi, and B. Suresh, Talanta, 1998, 46, 1577. 10. J. J. Gagel and K. Biemann, Mikrochim. Acta, 1988, 57, 1819. 11. R. L. White, Anal. Chem., 1985, 57, 1819. 12. T. H. King, C. K. Mann, and T. Vickers, J. Pharm. Sci., 1985, 74, 443. 13. K. Molt and M. Egelkraut, Git Fachz. Lab., 1988, 32, 1311. 14. D. J. Miner, J. R. Rice, R. M. Riggin, and P. T. Kissinger, Anal. Chem., 1981, 53, 2258. 15. A. Falkowski and R. Wei, Anal. Lett., 1981, 14, 1003. 16. Z. Bouhsain, S. Garrigues, and M. de la Guardia, Analyst, 1996, 121, 635. 17. E. M. Abdel-Moety and Z. Lebensm-Unters, Forsch, 1988, 186, 412; Anal. Abstr., 1998, 50, 8F51. 18. L. Oi-Wah, L. Shiu-Fai, C. Oi-Ming, and T. P. Y. Chiu, Analyst, 1992, 117, 777. 19. A. Martelli and F. B. Elliardo, Riv. Soc. Sci. Aliment., 1987, 16, 121. 20. M. Veerabhadrarao, M. Narayan, M. S. Kapur, and C. S. Sastry, J. Assoc. Off. Anal. Chem., 1987, 70, 578.
21. S. Fujiwara and S. Honda, Anal. Chem., 1987, 59, 2773. 22. G. Yurdakul, L. Ersoy, and S. Sungur, Pharmazie, 1991, 46, 885. 23. A. Cruz, M. Lopez-Rivadulla, P. Fernandez, and A. M. Bermejo, J. Anal. Toxicol., 1992, 16, 240. 24. A. Bozdogan, A. M. Acar, and G. K. Kunt, Talanta, 1992, 39, 977. 25. H. N. Dogan, Il Parmaco, 1996, 51(2), 145. 26. O.-W. Lau, S.-F. Luk, and Y.-M. Cheung, Analyst, 1989, 114, 1047. 27. J.-M. Zen and Y.-S. Ting, Anal. Chim. Acta, 1997, 343, 175. 28. H. Y. Mohammed and F. F. Cantwell, Anal. Chem., 1978, 50, 491. 29. A. El Shanawany, M. El Sadex, A. A. Khier, and G. Rucker, Indian J. Pharm. Sci., 1991, 53, 209. 30. N. Ramos-Martos, F. Aguirre-Gómez, A. Molina Díaz, and L. F. Capitan-Vallvey, J. AOAC Intern., 2001, 84, 676. 31. S. Markovic and Z. Kusec, Pharmazie, 1990, 45, 935. 32. Analytical Chemistry Division, Spectrochim. Acta, Part B, 1978, 242. 33. ACS Committee on Environmental Improvement, Anal. Chem., 1980, 52, 2242.