Nov 28, 2014 - 961343; Amman 11196, AmmanâJordan, Email: Submitted: 05 .... An API Mass spectrometer was used which was composed of degasser ...
JSM Clinical Pharmaceutics
Central Research Article
Simultaneous Determination of Sildenafil and Glimepiride in Rat Plasma by Using Lc-Ms Method and their Applications in Pharmacokinetic Interactions Eyad Mallah1*, Nibras Al Ani1, Wael Abu Dayyih1, Nidal Qinna2, Riad Awad1, Kamal Sweidan3 and Tawfiq Arafat1 Department of Pharmaceutical Medicinal Chemistry and Pharmacognosy, University of Petra, Jordan 2 Department Pharmacology and Biomedical Science, University of Petra, Jordan 3 Department of chemistry, The University of Jordan, Jordan 1
*Corresponding author Eyad Mallah, Department of Pharmaceutical Medicinal Chemistry and Pharmacognosy, Faculty of Pharmacy and Medical Sciences, University of Petra, P.O. Box: 961343; Amman 11196, Amman–Jordan, Email: Submitted: 05 November 2014 Accepted: 27 November 2014 Published: 28 November 2014 Copyright © 2014 Mallah et al. OPEN ACCESS
Keywords • Glimepiride • LC-MS • Pharmacokinetics • Rat plasma • Sildenafil • Validation
Abstract Glimepiride and sildenafil citrate are metabolized in liver by cytochrome p450, and there is a possibility of drug interactions if they are taken together. Therefore, a simple and sensitive method for simultaneous determination and validation of sildenafil with glimepiride in rat plasma has been developed by using high performance liquid chromatography–mass spectrometry (HPLC-MS). A mixture of 70% methanol, 30% of 0.1% formic acid in water was used as a mobile phase, ACE 5 C18 column, the flow rate of 0.5 mL/min was used, the autosampler injection volume was 5 μL, and clarithromycin was used as an internal standard. The accuracy for glimepiride and sildenafil in all the three days of validation and all the four tested target concentration was 99.7% and 98.9% respectively. The standard curves for both drugs matched the requirements, linear relation (R2) ranged between; (0.994 to 1). The serum level of both drugs was lowered when combined together, in comparison Serum sildenafil level was affected by the combination to a greater extent than glimepiride. Sildenafil was found to decrease significantly when it is used in a combination (34.5 ng/mL) compared to solitary drug use (57.8 ng/mL).
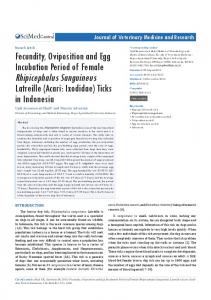
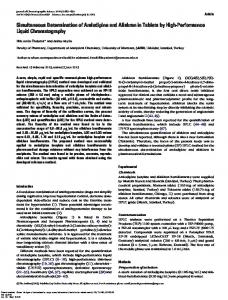
INTRODUCTION Glimepiride and Sildenafil are drugs used frequently by male patients, Glimepiride is a drug used for the treatment of diabetes in human, and it is used chronically for maintaining glucose level within normal range and used for the management of type 2 diabetes mellitus [1-4]. Moreover, diabetes patients suffer from erectile dysfunction so they use sildenafil citrate (Figure1) for treatment of this dysfunction [5,6], since both of these drugs are metabolized in liver they are eliminated via hepatic metabolism, mainly by the cytochrome P450 3A4 isoenzyme [7,8]. After oral administration, Glimepiride (Figure 2) is completely (100%) absorbed from the human gastrointestinal tract (GI tract) [9,10] and is extensively metabolized by hepatic cytochrome enzymes. Cytochrome P450 2C9 isoenzyme is involved in the biotransformation of glimepiride [11]. The benefits of pre-clinical studies are to provide a clinical
principle regarding mechanism of action and efficacy, guide schedule and dose escalation schemes, provide information for selection of test species, aid in start dose selection, selection of investigations biomarkers, justify pharmaceutical combinations, understand pharmacodynamic properties [12]. Validation of an analytical method is conducted to assure that the performance characteristics of the method meet the requirements for the intended analytical application and is capable of giving reproducible and reliable result [13-18]. As per literature there are several methods available for describing the validation of Sildenafil or Glimepiride in drug formulation or in plasma and only one published procedure for simultaneous determination of both actives in human plasma using HPLC-UV method [19]. These methods indicated that HPLC was a reliable way for the determination of Sildenafil in various samples, such as pharmaceutical preparations, soft drinks, serum and other biological fluids, and to determine its pharmacokinetics parameters [20-23]. On the other hand, there are many methods
Cite this article: Mallah E, Al Ani N, Dayyih WA, Qinna N, Awad R, et al. (2014) Simultaneous Determination of Sildenafil and Glimepiride in Rat Plasma by Using Lc-Ms Method and their Applications in Pharmacokinetic Interactions. J Clin Pharm 1(2): 1007.
Mallah et al. (2014) Email:
Central
O O
H3C
O
N
O S
CH3
O
N H
N H
N H
H3C
Figure 1 Sildenafil chemical structure.
O
O
O
CH3 N
HN
N
S N
N
N H3C Figure 2 Glimepiride chemical structure.
which have described the validation of Glimepiride in drug formulation and plasma. The HPLC was widely used method for the determination of Glimepiride and related compounds in pharmaceutical preparations and plasma. These developed assay methods were successfully applied to a pharmacokinetic study in human, animal and bulk formulation [24-28]. As observed in previous studies there are no specific methods for the determination of Sildenafil and Glimepiride simultaneously in the animal plasma using LC-MS method. Therefore, the main objective of this study is to determine a specific phosphodiestrase type (5) inhibitor (Sildenafil) with a sulfonylurea anti-diabetic (Glimepiride) in animal plasma by one simultaneous method using a validated HPLC-MS method and to determine the possible pharmacokinetic interactions between Sildenafil citrate and Glimepiride when they are prescribed together.
EXPERIMENTAL
Reagents and drugs Nanopure deionized water, methanol, sodium hydroxide, formic acid and acetonitrile advanced gradient grade (Fisher scientific). Rats Plasma (harvested from Animals) and Sildenafil, Glimepiride and Clarithromycin raw materials were kindly obtained from Jordan Pharmaceuticals Manufacturing (JPM) Co., Amman-Jordan.
Instrumentation
An API Mass spectrometer was used which was composed of degasser (Agilent 1260), solvent delivery systems pump (Agilent 1200), auto-sampler (Agilent 1200), thermostat column J Clin Pharm 1(2): 1007 (2014)
O
CH3
CH3
compartment (Agilent 1200), API 3200 mass spectrometer, chromatographic column ACE 5, C18 (50 x 2.1 mm), 5µm, bath sonicator Crest model-175T (Ultra Sonics CORP.), Sartorius balance BP 2215, Sartorius PH meter (Professional meter PP25), centrifuge (eppendorf 5417C), centrifuge (Hettich EBA 20) Tuttlingen.
In vivo study protocol
Adult male Sprague Dawley rats (200±20g) were purchased from Yarmouk University (Irbid, Jordan) and accommodated for 10 days prior experimentation in the Animal House at University of Petra (Amman, Jordan) under standard temperature (22±2ºC), relative humidity (50-60%) and constant 12 hr dark-light cycle. All rats were offered standard pellet chaw and tap water ad libitum. The rats were divided into three groups (n=7 rats/ group): the first group received Glimepiride only (0.75mg/kg); the second group received Sildenafil citrate only (1.75 mg/kg), while the third group received both drugs simultaneously at the same doses of single administration. All animals fasted for 18 hr before being tested (water ad libitum) and drug solutions were administered orally using a stainless steel oral gavage needle (Harvardapparatus, UK). At specific time intervals namely, 0, 0.5, 1, 2, 3, 4 and 6 hr, blood samples were pooled from each rat tail vein. Collected blood samples were allowed to clot for 10 min then centrifuged at 5000 rpm (2404 x g) using a Hettich EBA 20 centrifuge, serum samples were collected and placed in labelled eppendorf tubes and stored at -20ºC until requested for analysis. The study was approved by the ethical committee of graduate studies at faculty of pharmacy and medical sciences of University of Petra (March, 2013).
2/13
Mallah et al. (2014) Email:
Central
Preparation of solutions
Validation method
A known quantity of Glimepiride raw material (0.015 g) was dissolved in 1.0 L of sodium hydroxide solution (0.10 M) and 0.035 g of Sildenafil raw material was dissolved in 100.0 mL of sodium hydroxide solution (0.10 M).
The validation method was carried out according to the ICH guidelines in validation parameters and chromatographic conditions are given in Table 1.
Then 10.0 mg of Glimepiride working standard was dissolved in 0.5 mL of dimethylsulfoxide, then the volume was completed to 10.0 mL by water to get concentration 1.0 mg/mL stock solution for animals, and 10 mg of Sildenafil working standard was dissolved in 10.0 mL of water to obtain concentration of 1.0 mg/mL stock solution, then 200.0 µL from stock solution (from each of Glimepiride & Sildenafil) was added to 10.0 mL of 50% methanol in volumetric flask to obtain 20.0 µg/ mL working solution.
Preparation of internal standard solution
Equivalent to 10.0 mg of Clarithromycin working standard was dissolved in 10.0 mL methanol to get concentration of 1.0 mg/mL stock solution. A 25.0 µl from Clarithromycin stock solution was added to 250.0 mL of acetonitrile in dispenser bottle to obtain 100.0 ng/mL clarithromycin as a working solution.
Preparation of glimepiride and sildenafil standard serial dilution and spiked plasma
Samples of standard curve in plasma were prepared from working solution in serial dilutions into 10.0 mL of plasma, using seven concentrations, not including zero to obtain standard concentrations of 5.0, 10.0, 25.0, 50.0, 100.0, 150.0 and 200.0 ng /mL for each of Glimepiride and Sildenafil in plasma.
Preparation of glimepiride and sildenafil qc serial dilution and spiked plasma
Samples of QC in plasma were prepared from working solution in serial dilutions into 10.0 mL of plasma to obtain QC concentrations of 15.0, 100.0 and 160.0 ng /mL for each of Glimepiride and Sildenafil in plasma.
Method of extraction
To 0.05 mL of plasma sample, 100 μl of internal standard (10 ng/mL Clarithromycin in acetonitrile) was added in a 1.50 mL eppendorf tube, it was vortex-mixed for 1.0 min, then it was centrifuged for 15 min at 1200 rpm, and the supernatant was transferred into auto-sampler vials.
Table 1: Chromatographic Conditions and Mass Spectrometric Conditions. HPLC Conditions
Pump Flow Rate
0.5 mL/ min
Within-batch accuracy and precision evaluations were determined by analysis of 6 replicates quality control samples from each level. The quality control samples were randomized daily, processed and analyzed in position either.
Specificity and sensitivity
The specificity of the method was evaluated by screening six different lots of blank plasma. These lots were analyzed as blank and zero samples then compared with LLOQ to confirm lack of endogenous peaks.
Linearity
Each calibration curve was completed by plotting the ratio versus nominal concentration values.
Statistical analysis (Pharmacokinetic)
Data were translated into a computerized database structure. The database was examined for errors using range and logical data cleaning methods, and inconsistencies were remedied. An expert statistical advice was sought for. Statistical analyses were done using SPSS version 20 computer software (Statistical Package for Social Sciences). The 95% prediction interval in a linear regression model is a statistical procedure to anticipate or predict the expected range of possible correct values of the mean predicted concentration with 95% confidence.
The statistical significance of difference in mean of a normally distributed variable, like drug concentration between 2 groups was assessed using the independent samples Student’s t-test. The statistical significance of mean calculated errors between predicted and target concentration was assessed by paired t-test. Difference between 2 means is a measure of effect size presented in its original units of measurements. It equals the mean of a quantitative outcome variable in a test group minus that of a comparison group. Its usefulness is limited for comparison with other contexts of similar units of measurements and magnitude
Autosampler Injection Volume 5 mL
Mobile phase: Column type:
Chromatography
Analytes
MRM Detection Conditions Glimepiride& Sildenafil Clarithromy-cin (IS)
J Clin Pharm 1(2): 1007 (2014)
Accuracy and precision
Expected Retention times (minutes): Q1 Mass
Q3 Mass
247.979
130.1
427.821
125.1
Autosampler Temp.
Column Oven Temp.
4˚C
45˚C
mixture of (70 % Methanol, 30 % of 0.1% FA in Water) ACE 5 C18 Column (50 X 2.1 mm), 5µ
Glimepiride & Sildenafil (1-2) Clarithromycin(IS) (0.5-1.5) DP 51
75
EP
CEP
CE
CXP
11
30
33
4
11.5
16
33
4
3/13
Mallah et al. (2014) Email:
Central of mean. The difference between 2 means as a measure of effect is affected by the units of measurement for the variable and the amount of variability (SD). Therefore such a measure is not useful to compare the effect size across different type of variables or different studies.
A multiple linear regression model was used to study the net and independent effect of a set of explanatory variables, like “Day of validation”, “Type of drug assessed: sildenafil drug compared to glimepiride” and “Target (standard) concentration” on a quantitative outcome (dependent) variable like measurement error.
RESULTS AND DISCUSSION Validation Precision for glimepiride: On the first day of validation, the variability of errors (precision) in predicted concentration ranged between as low as 2.2% to a maximum Coefficient of Variation of (CV%) of 8.8% at the high target concentration. on the second day of validation, the variability of errors (precision) in predicted concentration ranged between as low as 2.6% observed with the High concentration of target of 160 ng/mL to a maximum Coefficient of Variation of (CV%) of 5.1% at the Mid target concentration of 100 ng/mL. on the third day of validation,
Table 2: The Mean Measurement Error and Accuracy for Glimepiride Validation Experiment on 4 Selected Targ Concentrations. Drug validated is Glimepiride
Target (standard) conc (ng/mL) (n=6)
Calculated (predicted) conc (ng/mL) (n=6)
Measurement error (ng/ mL)
Accuracy
(5 to 5)
(4.62 to 5.23)
(-0.38 to 0.23)
(92.4 to 105)
P (paired t-test)
%
Third day of validation LLOQ
Range Mean SD
0.9[NS] 5
SE
Range Mean SD
5.10% (15 to 15) 15
SE
Range Mean SD
(100 to 100) 100
SE
High
Mean SD SE
CV%
Overall day-3
14.88 1.02
6.80%
CV% Range
(13.4 to 16) 0.416
CV% Mid
0.26
0.105
CV% Low
5.01
160
0.26
0.105
100.3 5.15
2.101 0.79[NS]
(-1.6 to 1) -0.12 1.02
0.416
(89.2 to 107) 99.2 6.78
2.767 0.92[NS]
(94.2 to 104)
(-5.8 to 4)
(94.2 to 104)
3.83
3.83
3.83
99.83
-0.17
99.8
1.563
1.563
1.563
(147 to 168)
(-13 to 8)
(91.8 to 105)
8.64
8.64
5.48
3.80% (160 to 160)
0.01
156.33 3.528
5.40%
0.35[NS] -3.67
3.528
97.8
2.237 0.32[NS]
Mean
-0.98
99.3
SE
0.961
1.049
Mean
-0.31
99.7
SE
0.673
0.622
SD
Overall for Glimepiride (all 3 days of validation) SD
J Clin Pharm 1(2): 1007 (2014)
4.71
5.71
5.14
0.64[NS]
5.28
4/13
Mallah et al. (2014) Email:
Central the precision of predicted concentration ranged between as low as 3.8% observed with the Mid concentration of target of 100 ng/ mL to a maximum coefficient of variation of (CV %) 6.8% at the Low target concentration of 15 ng/mL .
Precision for sildenafil: On the first day of validation, the precision of predicted concentration ranged between 4.1% observed with the low concentration of target of 5 ng/mL to a maximum Coefficient of Variation of (CV %) of 5.9% at the high target concentration of 160 ng/mL. on the second day of validation, the precision of predicted concentration ranged between 3.9% observed with the high concentration of target
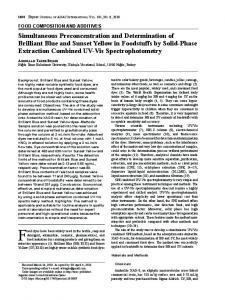
of 160 ng/mL to a maximum Coefficient of Variation of (CV %) 6.8% at the LLOQ target concentration of 5 ng/mL. on the third day of validation, the precision of predicted concentration ranged between as low as 4.3% observed with the low concentration of target of 5 ng/mL to a maximum Coefficient of Variation of (CV %) 6.7% at the high target concentration of 160 ng/mL as shown in Table 3. The Sildenafil blank chromatogram is shown in Figure 3.
Accuracy and measurement error
Glimepiride: The mean measurement error on the first day
Table 3: The Mean Measurement Error and Accuracy for Sildenafil Validation Experiment on 4 Selected Target Concentrations. Drug validated is Sildenafil
Target (standard) conc (ng/mL) (n=6)
Calculated (predicted) conc (ng/mL) (n=6)
Measurement error (ng/ mL)
Accuracy %
P (paired t-test)
Third day of validation LLOQ
Range Mean SD
0.14[NS] (5 to 5) 5
SE
CV% Low
Range Mean SD
(15 to 15) 15
SE
Mid
Mean SD
(100 to 100) 100
SE
Range Mean SD SE
CV%
Overall day-3
0.29
0.29
(90.5 to 105) 95.8
5.60
2.288
(14 to 15.7)
(-1 to 0.7)
(93 to 105)
0.65
0.65
4.45
14.65
0.24[NS] -0.35
97.7
0.264
0.264
1.819
(91.2 to 108)
(-8.8 to 8)
(91.2 to 108)
5.70
5.70
5.70
100.88 5.7%
160
-0.21
0.118
2.328 (160 to 160)
(-0.48 to 0.27)
0.118
4.3%
CV% High
4.80
5.8%
CV% Range
(4.52 to 5.27)
0.72[NS] 0.88
2.328 (-11 to 21)
10.65
10.65
4.349 6.7%
2.328 0.61[NS]
(149 to 181) 162.33
100.9
2.33
4.349
(92.9 to 113) 101.3 6.67
2.722 0.58[NS]
Mean
0.67
98.9
SE
1.173
1.177
SD
Overall for Sildenafil (all 3 days of validation)
5.75
5.77
0.85[NS]
Mean
-0.12
98.9
SE
0.59
0.63
SD
J Clin Pharm 1(2): 1007 (2014)
5.03
5.31
5/13
Mallah et al. (2014) Email:
Central
Figure 3 Sildenafil Blank chromatogram (0.0 hr).
of assessment ranged between a minimum of lower than 0.1 ng/ mL (lower than the target concentration) at the LLOQ to higher than 3.0 ng/mL (greater than the target concentration) at the high target concentration of 160 ng/mL (Figure 4). The accuracy of mean predicted value compared to target concentration ranged between a minimum of 98% at the LLOQ to a maximum accuracy of 99.5% at the mid concentration for target. The overall mean measurement error on the first day was an overestimate of 0.56 ng/mL with an average accuracy of 99.7% (Table 2). The mean measurement error on the second day of assessment ranged between a minimum of lower than 0.05 ng/mL (lower than the target concentration) at the LLOQ to as high as 4.83 ng/ mL (underestimate compared to target concentration) at the High target concentration of 160 ng/mL. The accuracy of mean predicted value compared to target concentration ranged between a minimum of 97.8% at the high target concentration J Clin Pharm 1(2): 1007 (2014)
of 160 ng/mL to a maximum accuracy of 99.1% at the LLOQ concentration for target (5 ng/mL). overall all mean measurement error on the second day was an underestimate of 0.52 ng/mL with an average accuracy of 100.2%. The mean measurement error on the third day of assessment ranged between a minimum of 0.01 ng/mL (higher than the target concentration) at the LLOQ to as high as 3.67 ng/mL (underestimate compared to target concentration) at the high target concentration of 160 ng/ mL. The accuracy of mean predicted value compared to target concentration ranged between a minimum of 97.8% at the High target concentration of 160 ng/mL to a maximum accuracy of 99.8% at the Low concentration for target. The overall mean measurement error on the third day was an underestimate of 0.98 ng/mL with an average accuracy of 99.3%. Looking at all the 3 days of validation, the overall mean measurement error of low concentration is 0.31 ng/mL (underestimate on average) for
6/13
Mallah et al. (2014) Email:
Central
Figure 4 Glimepiride LLOQ and Clarithromycin (IS) chromatograms.
the validation experiments of Glimepiride. There was statistically no significant mean difference in between target and predicted drug concentrations on all the 3 days and all the 4 levels of target concentration. The summary accuracy of Glimepiride validation over 3 days is 99.7%.
Sildenafil: The mean measurement error on the first day of assessment ranged between a minimum of 0.00 ng/mL (not different from the target concentration) at the LLOQ to as high as -2.78 ng/mL (lower than the target concentration) at the mid target concentration of 100 ng/mL (Figure 5). The accuracy of mean predicted value compared to target concentration ranged between a minimum of 97.2% at the mid target concentration of 100 ng/mL to a maximum accuracy of 100% at the LLOQ. The overall mean measurement error on the first day was an underestimate of 0.71 ng/mL with an average accuracy of 99.5%.
The mean measurement error on the second day of assessment ranged between a minimum of lower concentration 0.02 ng/mL (lower than the target concentration) at the LLOQ to as high as 2.5 ng/mL (underestimate compared to target concentration) at the High target concentration of 160 ng/ mL. The accuracy of mean predicted value compared to target concentration ranged between a minimum of 96% at LLOQ target concentration of 5 ng/mL to a maximum accuracy of 98.6% at the high concentration for target (160 ng/mL). The overall mean measurement error on the second day was an underestimate of 0.30 ng/mL with an average accuracy of 98.2%. J Clin Pharm 1(2): 1007 (2014)
The mean measurement error on the third day of assessment ranged between a minimum of low concentration 0.21 ng/mL (lower than the target concentration) at the LLOQ to as high as 2.33 ng/mL (overestimate compared to target concentration) at the High target concentration of 160 ng/mL. The accuracy of mean predicted value compared to target concentration ranged between a minimum of 95.8% at the LLOQ target concentration of 5 ng/mL to a maximum accuracy of 100.9% at the Mid concentration for target. The overall mean measurement error on the third day was an overestimate of 0.67 ng/mL with an average accuracy of 98.9%. Looking at all the 3 days of validation the overall mean measurement error of lower concentration 0.12 ng/mL (underestimate on average) for the validation experiments of Sildenafil. There was statistically no significant mean difference in between target and predicted drug concentrations on all the 3 days and all the 4 levels of target concentration. The summary accuracy of sildenafil validation over 3 days is 98.9% (Table 3).
5.2.3. Linearity: Perfect dose-response relationship for Glimepiride at 3rd day and Sildenafil at 1st and 2nd day of validation. The remaining 1st and 2nd day for Glimepiride validation showed an almost perfect linear relation with an R2 of 0.999. The lowest value of R2 (though still an almost perfect one) was observed in the 3rd day of Sildenafil experiment (R2=0.994). All the linear regression models were statistically significant. It is worth mentioning herein that the lower limit of
7/13
Mallah et al. (2014) Email:
Central
Figure 5 Sildenafil LLOQ and Clarithromycin (IS) chromatograms.
quantitation in the present work is 50 ng/mL which is lower than the corresponding one that mentioned in the previous work [19].
5.2.4. Ruggedness: As shown in Table 5, the day of validation (coded as 1 to 3) had no statistically significant association (or effect) with the magnitude of measurement errors. In addition the type of drug assessed and the magnitude of target drug concentration tested (ranging between 5, 15, 100 and 160 ng/mL) had no statistically significant effect on the mean measurement error. The model relating the day of validation, drug assessed and target concentration was statistically not significant.
The direction of error, whether underestimate or overestimate was disregarded by using the absolute value of measurement error and then used as the dependent (outcome) variable in a linear regression model in Table 6. The day of validation and the type of drug validated (whether Glimepiride or Sildenafil) still lacks any statistically significant association (or effect) on the magnitude of absolute measurement errors. The target concentration tested was shown to have a statistically significant positive association with the absolute measurement J Clin Pharm 1(2): 1007 (2014)
error. For each 1 ng/mL increase in target concentration tested the absolute value of error is expected to increase by 0.047 ng/ mL. i.e. the absolute magnitude of error is expected to be higher at the high target concentration of 160 ng/mL, but this would not affect the overall accuracy since the higher error when divided by the higher target concentration the percent error would be reduced to match that observed at the low target concentration. The regression model was statistically significant and able to predict 49.5% of variation in the response variable (absolute measurement error).
Specificity and sensitivity
The protein direct precipitation procedure was specified and sensitive for each of Glimepiride and Sildenafil, where both blank and zero samples examined from six deferent lots of plasma were attained. The clean chromatogram is required for the specific method as shown in Figures (3-5).
Pharmacokinetics: The serum concentration of each of the two evaluated drugs, namely Sildenafil and Glimepiride was evaluated on rats on a sample size of 7 for single drug use
8/13
Mallah et al. (2014) Email:
Central
Figure 6 Scatter diagram with fitted regression and 95% confidence intervals for predicted values for standard (target) concentrations as the independent variable when plotted against the ‘Drug area / IS ratio’-Day one for Glimepiride.
140.0
Drug plasma concentration (ng/ml)
120.0 average combination
100.0
average separate
80.0 60.0 40.0 20.0 0.0 0.00
0.50
1.00
1.50
2.00
2.50
3.00
3.50
4.00
4.50
Time after administration (hour)
5.00
5.50
6.00
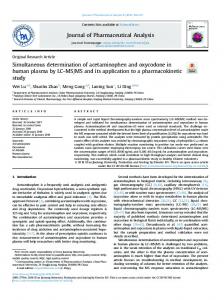
Figure 7 Rat plasma profile showing the changes in mean serum Glimepiride concentration with time after drug administration comparing combined and solitary drug use.
and another sample size of 6 when combined together. The measurements were repeated at 6 time intervals following drug administration to a maximum of 6 hours.
Effect of combination on glimepiride
When Glimepiride drug was administered alone its serum J Clin Pharm 1(2): 1007 (2014)
level reached its maximum (105.8 ng/mL) after half an hour and then gradually declined to reach a minimum concentration of 31.4 ng/mL at the end of follow up period (6 hours). The same drug when administered combined with Sildenafil showed a steep decrease in serum concentration during the first half an hour of administration (76.4 ng/mL) and reached its maximum
9/13
Mallah et al. (2014) Email:
Central Table 4: Glimepiride Day 1 Validation Data predicted values for standard (target) concentrations as the independent variable when plotted against the ‘Drug area / IS ratio’-Day three for Glimepiride. Drug Internal standard Area Accuracy Sample name Calculated conc. area Area Ratio % STD1 STD2
297
107128
0.00
1372
105125
0.01
565
STD3 STD4
2888
STD5
5091
STD6
8090
STD7
10825
104130
4.75
0.01
107517
10.10
104005
0.05
101.00
53.00
106.00
149.00
99.10
97.30
0.07
107572
101.00
25.40
0.03
108449
95.00
0.01
201.00
97.30
Day – 1 Glimepiride, Predicted (calculated conc) = (-0.0005608 + ‘Drug area / IS ratio’) / 0.000497 .R2=0.999, P (Model) < 0.001
100.00
Table 5: Multiple Linear Regression Models with Measurement Error as the Dependent Variable and Day of Validation, Type of Drug Evaluated and Target Concentration Tested as the Explanatory (independent) variables. (Constant)
Partial Regression Coefficient
P
.054
0.97[NS]
Day of validation
-.042
Target (standard) conc. (ng/mL)
-.004
Sildenafil drug compared to Glimepiride
0.94[NS]
.197
P (Model) = 0.94[NS], R2=0.003
0.83[NS]
0.57[NS]
Table 6: Multiple Linear Regression Models with Absolute Value of Measurement Error as the Dependent Variable and Day of validation, Type of Drug Evaluated and Target Concentration Tested as the Explanatory (Independent) Variables. Partial Regression Coefficient
P
(Constant)
1.117
0.16[NS]
Sildenafil drug compared to Glimepiride
-.727
Day of validation
Target (standard) conc (ng/mL)
-.427
0.18[NS]
.047
0.05 (Insignificant). The difference between Cmax and AUC is insignificant.
Cmax (ng/mL)
Tmax (hr)
105.80±18.35
0.5 hour
81.30±12.12 *
serum concentration (81.3 ng/mL) after one hour (Figure 7). At both time intervals (half an hour and one hour) the mean serum concentration of Glimepiride when administered in combination was obviously lower than that of solitary drug use. During the remaining 5 hours the gap (difference in mean serum drug concentration) between combined and single drug use was very narrow and disappeared at the end of follow up period of 6 hours. The data for Glimepiride in experiment are shown in Table 7.
Table 8 explains the mean serum drug concentration after half an hour when used in combination with Sildenafil which was lowered by 29.4 ng/mL compared to its isolated administration. The effect of drug combination on lowering serum Glimepiride level compared to its single drug use was evaluated as a moderately strong effect (Cohen’s d=0.71). This 27.8% reduction in serum Glimepiride concentration when used in combination compared to its solitary use, however failed to reach the level of J Clin Pharm 1(2): 1007 (2014)
1 hour
0.16[NS]
T1/2 (hr) 3.14
3.28
AUC (ng/mL*hr) 343.73±78.17
316.54±34.77 #
statistical significance (possibly because of very small sample size).
Effect of combination on sildenafil
Figure 8 and Table 9 show that when Sildenafil drug was administered alone its serum level reached its maximum (57.8 ng/mL) after half an hour and then gradually declined to reach a minimum concentration of 6.9 ng/mL at the end of follow up period (6 hours). The same drug when administered combined with Glimepiride showed a steep increase in serum concentration during the first half an hour of administration (34.4 ng/mL) and plateaus for the next half an hour (maximum serum concentration of 34.5 ng/mL after one hour). At both time intervals (half an hour and one hour) the mean serum concentration of Sildenafil when administered in combination was obviously lower than that of solitary drug use. During the remaining 5 hours the
10/13
Mallah et al. (2014) Email:
Central Table 8: Comparing the Mean Serum Glimepiride Drug Concentration at Selected time Intervals after Administration between Single and Combined Drug use. Plasma concentration (ng/mL)
Drug assessed Glimepiride Single
Range Mean SD SE
30 min
1 hour
2 hours
3 hours
4 hours
6 hours
(44.7 - 195)
(45.1 - 181)
(35.9 - 128)
(24.3 - 122)
(17.9 - 118)
(14.5 - 61.6)
36.3
18.9
7
6
105.8 49
96.1
48.2
75.3
37.1
60.3
37.9
46.3
31.4
18.53
18.22
14.02
14.32
13.71
Range
(33.9 - 131)
(30.8 - 115)
(23.6 - 117)
(30 - 68.1)
(26.6 - 59.1)
(23.3 - 41.7)
SD
32.6
29.7
31.3
14.8
13.8
7.1
N
6
6
6
6
N
Combined Mean SE
Effect of combination compared to solitary drug effect
Difference between 2 means Cohen's d
Percent change compared to solitary P (t-test)
7
76.4
7
81.3
7
72.1
13.3
12.12
12.77
-29.4
-14.8
-3.2
-27.8
-15.4
6
-0.71
0.24[NS]
7
54.1
6.04
-6.2
7.7
40.3
30.8
5.65
2.89
-6.0
-0.6
6
-0.37
-0.09
-0.22
-0.22
-0.04
0.53[NS]
0.87[NS]
0.72[NS]
0.71[NS]
0.94[NS]
-4.2
-10.3
-13
-1.9
Figure 8 Line graph showing the changes in mean serum Sildenafil concentration with time after drug administration comparing combined and solitary drug use.
Table 9: Pharmacokinetics data of Sildenafil. Drug
Sildenafil
Sildenafil in combination
Cmax (ng/mL)
Tmax (hr)
T1/2 (hr)
AUC (ng/mL*hr)
57.8±9.30
0.5 hour
1.71
150.75±28.79
34.5±3.97*
1 hour
*P0.05 (insignificant) The difference between Cmax is significant, while the difference between AUC is insignificant. J Clin Pharm 1(2): 1007 (2014)
1.41
99.12±13.16 #
11/13
Mallah et al. (2014) Email:
Central Table 10: Comparing the Mean Serum Sildenafil Drug Concentration at Selected Time Intervals after Administration Between Single and Combined Drug Use. Plasma concentration (ng/mL)
Drug assessed Sildenafil
30 min
1 hour
2 hours
3 hours
4 hours
6 hours
Range
(18.3 - 99)
(29.5 - 123)
(14.9 - 77.2)
(10.1 - 43.3)
(3.6 - 24.7)
(3 - 11.9)
SD
24.6
31.4
20.9
11.5
7.3
3.4
Single Mean SE N
Combined Range Mean SD SE N
57.8
53.6
9.30
11.86
(21.8 - 46.2)
(23.3 - 46.4)
7
34.3
7
34.5
9.1
9.7
3.73 6
Difference between 2 means Cohen's d
Percent change compared to solitary P (t-test)
-23.4
-1.26
-40.6
0.048[S]
As seen in Table 10, the mean serum Sildenafil concentration after half an hour when used in combination with Glimepiride was lowered by 23.4 ng/mL compared to its isolated administration. The effect of drug combination on lowering serum sildenafil level compared to its single drug use was evaluated as a strong effect (Cohen’s d=1.26). This 40% reduction in serum drug concentration was statistically significant.
CONCLUSION
A simple, sensitive and accurate simultaneous method for glimepiride and Sildenafil in rat plasma had been validated by using HPLC-MS. Plasma Sildenafil level was affected by the combination to a greater extent than Glimepiride, in addition the lowering in serum concentration of glimepiride (when it is combined with sildenafil) was limited to the first hour after administration, while the Sildenafil serum concentration (when it is combined with glimepiride) remained significantly lower when compared to single drug administration even after six hours. Both Sildenafil and Slimepiride when used as single drug therapy reach maximum serum level within half an hour (57.8 and 105.8) ng/mL, while combined use of drugs delays the maximum serum concentration for both drugs to one hour (34.5 and 81.3) ng/mL. This study can lead to many possible future studies like studying the effect of this combination on the metabolism of these drugs by CYP 450 (both drugs metabolized in liver by CYP 450 but with different sub types), also this study can be done on human plasma. J Clin Pharm 1(2): 1007 (2014)
24.1
-10.0
-35.7
1.39
(6.7 - 25)
(5.6 - 14.1)
(0.7 - 7.6)
15.2 6.4
2.60
6
6
-6.9
-0.61
-29.3
0.31[NS]
6.9
2.75
7
9.8
-19.1
0.18[NS]
gap (difference in mean serum drug concentration) between combined and single drug gets narrower, but is not cancelled even at the end of follow up period of 6 hours.
(11.7 - 37.9)
12.4
4.35
7
4.02
-0.82
22.1
7.88
3.97 6
Effect of combination compared to solitary drug effect
34.1
7
8.9 3.6
1.46 6
-3.5
6
3.4
2.5
1.02 6
-3.5
-0.74
-0.60
-1.16
0.22[NS]
0.31[NS]
0.07[NS]
ACKNOWLEDGMENT
-31.3
-28
-50.5
The authors gratefully acknowledge the University of Petra (UOP) and Jordan Center for Pharmaceutical Research (JCPR) for providing necessary facilities for carrying out this study.
REFERENCES
1. Brunetti L, Kalabalik J. Management of type-2 diabetes mellitus in adults: focus on individualizing non-insulin therapies. P T. 2012; 37: 687-696. 2. Badian M, Korn A, Lehr KH, Malerczyk V, Waldhäusl W. Absolute bioavailability of glimepiride (Amaryl) after oral administration. Drug Metabol Drug Interact. 1994; 11: 331-339.
3. Krenzelok EP. Sildenafil: clinical toxicology profile. J Toxicol Clin Toxicol. 2000; 38: 645-651.
4. Nissen SE, Nicholls SJ, Wolski K, Nesto R, Kupfer S, Perez A, et al. Comparison of Pioglitazone vs Glimepiride on Progression of Coronary Atherosclerosis in Patients with Type 2 Diabetes: the Periscope Randomized Controlled Trial. J. Amer. Med. Assoc. 2008; 299: 1561-1573. 5. Berzas JJ, Rodriguez J, Castañeda G, Villaseñor MJ. Voltammetric Behavior of Sildena?l Citrate (Viagra) Using Square Wave and Adsorptive Stripping Square Wave Techniques Determination in Pharmaceutical Products. Anal. Chim. Acta. 2000; 417: 143–148. 6. Corona G, Mannucci E, Petrone L, Ricca V, Balercia G, Mansani R, et al. Association of hypogonadism and type II diabetes in men attending an outpatient erectile dysfunction clinic. Int J Impot Res. 2006; 18: 190197.
7. Walsky RL, Astuccio AV, Obach RS. Evaluation of 227 drugs for in vitro inhibition of cytochrome P450 2B6. J Clin Pharmacol. 2006; 46: 14261438. 8. Gupta M, Kovar A, Meibohm B. The clinical pharmacokinetics of
12/13
Mallah et al. (2014) Email:
Central phosphodiesterase-5 inhibitors for erectile dysfunction. J Clin Pharmacol. 2005; 45: 987-1003.
9. Yüzüak N, Özden T, Eren S, Özilhan S. Determination of Glimepiride in Human Plasma by LC–MS–MS. Chromatographia. 2007; 66: S165-168.
10. McCall AL. Clinical review of glimepiride. Expert Opin Pharmacother. 2001; 2: 699-713. 11. Jovanović D, Stojsić D, Zlatković M, Jović-Stosić J, Jovanović M. Bioequivalence assessment of the two brands of glimepiride tablets. Vojnosanit Pregl. 2006; 63: 1015-1020. 12. Steinmetz KL, Spack EG. The basics of preclinical drug development for neurodegenerative disease indications. BMC Neurol. 2009; 9 Suppl 1: S2.
13. Abu Dayyih W, Al saadi N, Hamad M, Mallah E, Matalka K, Arafat T. Development and Validation of HPLC for Some Azoles in Pharmaceutical Preparation. Int. J. Pharm. Sci. Res. 2012; 3: 36863692. 14. Abu Dayyih W, Alsaid S, Hamad M, Al Akayleh F, Mallah E. Development and Validation of a Reverse Phase HPLC Method for Simultaneous Estimation of Some Prills in Drug Forms. Int J Pharm Pharm Sci. 2013; 5 : 203-213. 15. Taverniers I, Loose M, Bockstaele VE. Trends in Quality in the Analytical Laboratory. II., Analytical Method Validation and Quality Assurance. Trac-Trend Ana.l Chem. 2004; 23: 535-552.
16. The United States pharmacopeia (USP) and the National Formulary (NF). The Official Compendia of Standards. 2006; 29: 1225.
17. Rafferty JL, Sun L, Siepmann JI, Schure MR. Investigation of the Driving Forces for Retention in Reversed-Phase Liquid Chromatography: Monte Carlo Simulations of Solute Partitioning Between n-Hexadecane and Various Aqueous–Organic Mixtures. Fluid Phase Equilib. 2010; 290: 25-35. 18. Snyder LR, Kirkland JJ, Dolan JW. Introduction to modern liquid chromatography; John Wiley & Sons, Inc. 2010; 912. 19. Tripathi AS, Dewani AP, Shelke PG, Bakal RL, Chandewar AV,
Mazumder PM. Development and validation of RP-HPLC method for simultaneous estimation of glimepiride and sildenafil citrate in rat plasma-application to pharmacokinetic studies. Drug Res (Stuttg). 2013; 63: 510-514.
20. Mahmoudian M. Sildenafil Determination in Various Matrices. Iran. j. Pharmacol. Ther. 2005; 4: 72-75.
21. Aboul-Enein HY, Hefnawy MM. Rapid Determination of Sildenafil Citrate in Pharmaceutical Preparations Using Monolithic Silica HPLC Column. J. Liq. Chrom. Related Technol. 2003; 26: 2897-2908. 22. Reddy BPK, Reddy YR. Validation and Stability Indicating RP-HPLC Method for the Determination of Sildenafil Citrate in Pharmaceutical Formulations and Human Plasma. Eur. J. Chem. 2008; 5: 1117-1122.
23. Mahmood KT, Khan B. A Validated HPLC Method for the Measurement of Sildenafil Citrate in Different Formulations. Pak. J. Sci. 2010; 62: 192-197.
24. Hotha KK, Yarramu NR, Kandibedala T, Dasari VB, Vobalaboina V. Simultaneous Determination of Atorvastatin, and Glimepiride in Human Plasma by LC–MS/MS and its Application to a Human Pharmacokinetic Study. Am. J. Anal. Chem. 2012; 3: 559-569. 25. Sakuntala MSV, Prasad SVUM, Sri Devi S, Kishore Yadav Y, Srinivas Reddy K. A RP- HPLC Method Development and Validation for the Simultaneous Estimation of Glimepiride and Pioglitazone HCl in Tablet Dosage Forms. J. Chem. Pharm. Res. 2012; 4: 154-159.
26. Kim H, Chang KY, Lee HJ, Han SB. Determination of Glimepiride in Human Plasma by Liquid Chromatography-Electrospray Ionization Tandem Mass Spectrometry. Bull. Korean chem. Soc. 2004; 25: 109114. 27. A K, G S, C MR, Bhat K, A R, P M, et al. Simultaneous determination of pioglitazone and glimepiride in bulk drug and pharmaceutical dosage form by RP-HPLC method. Pak J Pharm Sci. 2008; 21: 421-425.
28. Araujo P. Key aspects of analytical method validation and linearity evaluation. J Chromatogr B Analyt Technol Biomed Life Sci. 2009; 877: 2224-2234.
Cite this article Mallah E, Al Ani N, Dayyih WA, Qinna N, Awad R, et al. (2014) Simultaneous Determination of Sildenafil and Glimepiride in Rat Plasma by Using Lc-Ms Method and their Applications in Pharmacokinetic Interactions. J Clin Pharm 1(2): 1007.
J Clin Pharm 1(2): 1007 (2014)
13/13