Journal of Chromatography A, 1423 (2015) 9–18
Contents lists available at ScienceDirect
Journal of Chromatography A journal homepage: www.elsevier.com/locate/chroma
Simultaneous extraction and determination of four different groups of pharmaceuticals in compost using optimized ultrasonic extraction and ultrahigh pressure liquid chromatography–mass spectrometry Miguel Ángel López Zavala a,∗ , Liliana Reynoso-Cuevas b a Water Center for Latin America and the Caribbean, Tecnológico de Monterrey, Av. Eugenio Garza Sada Sur No. 2501, Col. Tecnológico, Monterrey, N. L. C.P. 64849, Mexico b CIMAV-Durango Victoria 147 Norte, Col. Centro, Durango, Dgo. C.P. 34000, Mexico
a r t i c l e
i n f o
Article history: Received 5 August 2015 Received in revised form 5 October 2015 Accepted 15 October 2015 Available online 19 October 2015 Keywords: Compost Pharmaceuticals Ultrasonic extraction (USE) UHPLC–MS/MS
a b s t r a c t An analytical method for the simultaneous extraction and determination of four different groups of pharmaceuticals in compost from the biodegradation of biological infectious hazardous wastes (BIHW) was developed and successfully validated. Compost samples were spiked with known concentrations of the pharmaceuticals of interest. Ultrasonic extraction with an ethyl acetate and methanol solution (1:1) resulted to be effective for the extraction of eight target compounds. All the compounds were separated in a single gradient run by UHPLC using a Zorbax SB C18 Agilent (2.1 × 50 mm, 1.8 m) column. Analytes were detected and quantified via multiple reaction monitoring (MRM) using an AB SCIEX API5000TM triple quadrupole with electrospray ionization (ESI) in positive mode. The optimum mobile phase consisted of ammonium formate (2 mM, pH 3): MeOH (50:50). Recovery values of the ultrasonic extraction for all compounds were on the order of 87% to 113% with absolute deviations lower than 11%. The limits of detection and quantification for the eight pharmaceuticals were on the order of 0.66 ng g−1 and 2 ng g−1 respectively for all the pharmaceuticals analyzed. These values are lower than those values reported in the literature. Suitable level of linearity, acceptable limits of detection and quantification, good repeatability and inter-day precision, non-ion interference, and low matrix effect resulted from the validation of the analytical method. Implementation of the analytical procedure proposed in this research will contribute in having shorter analysis time and lower costs when working with complex matrices such as compost. © 2015 The Authors. Published by Elsevier B.V. This is an open access article under the CC BY-NC-ND license (http://creativecommons.org/licenses/by-nc-nd/4.0/).
1. Introduction Hospitals are commonly intensive consumers of water and generators of biological infectious hazardous wastes (BIHW); moreover, hospital biological wastes (water and solids) constitute a very complex matrix, loaded with microorganisms, heavy metals, pharmaceutical products, toxic chemicals, hormonal and radioactive elements [1]. Placenta is considered one of the most frequent BIHW from hospitals and is mainly constituted of biodegradable organic matter. Thermophilic Aerobic Treatment has been used to degrade placentas as an economic and sustainable alternative, not only to transform biodegradable waste into nutrient-rich compost
∗ Corresponding author. E-mail addresses:
[email protected] (M.Á. López Zavala),
[email protected] (L. Reynoso-Cuevas).
that can be used as a fertilizer or soil conditioner, but also to eliminate, without risk, some organic chemicals such as emerging pollutants [2,3]. Emerging contaminants are defined as chemicals whose presence in the environment has recently been detected, and their ecological and health effects are causing growing concern. They include pharmaceuticals, personal care products, pesticides and disinfectants, among others [4]. Contamination by these compounds is still a largely unregulated area, and there is ongoing debate within the scientific community regarding which pharmaceuticals are included among the priority substances [5]. Pharmaceutically active compounds are of emerging concern because of their intrinsic biological activity, which may cause adverse effects, particularly at chronic exposure [6]. Currently, the main interest of various research groups is the development of precise and sensitive analytical methods that allow the quantification of pharmaceuticals and their metabolic and degradation products
http://dx.doi.org/10.1016/j.chroma.2015.10.051 0021-9673/© 2015 The Authors. Published by Elsevier B.V. This is an open access article under the CC BY-NC-ND license (http://creativecommons.org/licenses/by-nc-nd/4. 0/).
10
M.Á. López Zavala, L. Reynoso-Cuevas / J. Chromatogr. A 1423 (2015) 9–18
in different environments at low detection levels. Most of these methodologies are based on high-performance liquid chromatography (HPLC) and, recently, on tandem mass spectrometry (MS/MS) due to its high sensitivity and selectivity [6–10,18]. However, the simultaneous extraction and determination of different groups of pharmaceuticals in complex environmental matrices such as compost is particularly challenging because of the low detection limits required, the complex nature of the samples, the different chemical characteristics of the pharmaceuticals, and the difficulty in extracting and separating these compounds from interference. Recently, efforts have being conducted to develop methods for the determination of pharmaceutical compounds in sewage sludge, compost and river sediments. Methods reported are based on the ultrasonic-assisted extraction and clean-up by SPE [6]; pressurized liquid extraction (PLE) [21–25], ultrasonic solvent extraction (USE) [25–29] and microwave-assisted extraction (MAE) [30]. However, most of them have just been developed and validated for a specific sample matrix. Martín et al. [6] reported that extraction by USE is preferred because of its lower cost with respect to the other techniques reported for the extraction of pharmaceuticals from solid environmental samples, PLE and MAE. Moreover, lower degradation processes occur in USE than in PLE as extraction is carried out at room temperature instead of at high temperatures of around 100 ◦ C reported in PLE methods and, usually, precisions higher than in MAE are achieved. Thus, the aim of this study was to develop and validate a reliable and affordable analytical method for the simultaneous extraction and determination of four different groups of pharmaceuticals in compost obtained from the thermophilic aerobic treatment. The pharmaceuticals were two non-steroidal anti-inflammatory drugs, ketorolac and naproxen, usually administered to humans; two fluoroquinolones, ofloxacin and ciprofloxacin (which are among the most commonly prescribed class of antibiotics in Mexico); two anti-cancer (antineoplastic or cytotoxic) chemotherapy drugs, ifosfamide and cyclophosphamide; and two -blockers, atenolol and propranolol, also called -adrenergic blocking agents, which treat a variety of conditions, such as high blood pressure, glaucoma and migraines. The pharmaceuticals of each group were selected because they are commonly used in Mexico and environmental and health impacts has been reported. The clustering was based on the use of the drug and not on the similarity of the structure. Table 1 summarizes the characteristics of each pharmaceutical.
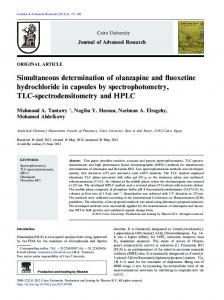
Fig. 1. Pilot thermophilic aerobic treatment system installed at the San José Hospital. Monterrey, Mexico.
2.2. Sampling of compost Thermophilic aerobic treatment was applied in this study to transform biological infectious hazardous wastes into nutrient-rich compost that can be used as a fertilizer or soil conditioner (Fig. 1). A pilot system was installed and operated at the San José Hospital in Monterrey, Mexico. Placentas were minced with a food grinder and incorporated into the reactor of the system that uses sawdust as a matrix. The degradation process was conducted under the following conditions: matrix moisture content, 50–60%; mixing frequency, 6 times per day; and temperature, 50–60 ◦ C. Compost samples were collected from the biological reactor and spiked with pharmaceuticals as described below. 2.3. Analytical methods 2.3.1. Samples preparation Compost samples were transferred into centrifuge tubes and spiked with known concentrations of each pharmaceutical standard solution using micropipettes. Then, high speed vortex (1 min) was applied to homogenize the distribution and sorption of the pharmaceuticals into the compost matrix. The spiked samples were preserved at room temperature for 12 h to ensure pharmaceuticals sorption.
2. Experimental methods 2.1. Chemicals Naproxen (NPX) sodium standard (98–100% purity), ketorolac (KET) tris salt standard (≥99% purity), Propranolol (PRO) hydrochloride (>98% purity), Atenolol (ATE) (>% purity), Ifosfamide (IFO), Ofloxacin (OFL) and cyclophosphamide (CFO) monohydrate were bought from Sigma–Aldrich (Toluca, Mexico) and ciprofloxacin (CFL) (>98% purity) was purchased from Fluka Analytical (Steinheim, Germany). Methanol was acquired from J.T. Baker (Center Valley, PA, USA). Analytical grade ethyl acetate and ammonium formate were provided by Fisher Scientific (Monterrey, Mexico). Formic acid (98–100%) was from Merck (Naucalpan, Mexico). Ultrapure water was prepared with a Milli-Q water purification system (Bedford, MA, USA). A solution with methanol and ultrapure water (1:1) was prepared and labeled as Solution “A”. Then, 10 mg mL−1 stock solutions for each pharmaceutical were prepared using the Solution “A” and stored at 4 ◦ C. Standard solutions at different concentrations were daily prepared by using the stock solutions and the Solution “A”.
2.3.2. Extraction method Volumes of 4 mL of ethyl acetate and methanol solution (1:1) were added to the compost samples (50 mg each) spiked with the eight target pharmaceuticals; next, the mixtures were vortex for 3 min and then placed into an ultrasonic bath for 5 min. Centrifugation at 3500 rpm and 4 ◦ C, and ultra-freeze at −70 ◦ C were conducted for 5 and 10 min, respectively. The supernatants were then decanted and evaporated with a gentle stream of nitrogen until dryness at 45 ◦ C, and dissolved again with 500 L of ammonium formate (2 mM, pH 3) and methanol solution (1:1). High speed vortex for 20 s, centrifugation at 13,500 rpm and 4 ◦ C for 5 min were applied. Then, the supernatants were filtrated through 0.2 m PTFE Whatman filters and the extracts were transferred to 1 mL vials for UHPLC–MS/MS analysis. The extraction efficiency, reported as the mean recovery, was determined based on the analysis of extracts of five replicates of compost samples spiked with known concentrations of pharmaceuticals, low (6.0 ng g−1 ), middle (80.0 ng g−1 ) and high (180 ng g−1 ). The coefficient of variation of the mean recovery must be lower than 15%.
M.Á. López Zavala, L. Reynoso-Cuevas / J. Chromatogr. A 1423 (2015) 9–18
11
Table 1 Characteristics of the pharmaceuticals used in this study. Pharmaceutical
Systematic name
Structure
Polarity (Log P)
Molecular mass (Da)
Anti-inflammatory
Ketorolac
5-benzoyl-2,3-dihydro 1H-pyrrolizine-1-carboxylic acid
2.1
255.09
Naproxen
2-(6-methoxynaphthalen-2-yl) propanoic acid
2.8
230.09
Ofloxacin
9-Fluoro-2,3-dihydro-3-methyl-10-(4-methyl-lpiperazinyl)-7-oxo-7H-pyrido[1,2,3-de]-1,4benzoxazine-6-carboxylic acid
2.1
361.14
Ciprofloxacin
1-cyclopropyl-6-fluoro-4-oxo-7-(piperazin-1-yl)quinoline-3-carboxylic acid
2.3
331.13
Ifosfamide
N-3-bis(2-chloroethyl)-1,3,2-oxazaphosphinan-2amine-2-oxide
0.8
260.02
Cyclophosphamide
N,N-bis(2-chloroethyl)-1,3,2-oxazaphosphinan-2amine 2-oxide
0.8
260.02
Atenolol
4-(2-hydroxy-3-isopropylaminopropoxy)phenylacetic acid
0.5
267.15
Propranolol
1-(1-methylethylamino)-3-(1-naphthyloxy)propan-2ol
3.0
259.16
Antibiotics
Anticancer
ˇ-Blockers
2.3.3. Ultrahigh pressure liquid chromatography and mass spectrometry method Detection and quantification of the eight target pharmaceuticals in compost extracts were conducted by UHPLC–MS/MS analysis. The Acquity Ultra High Pressure LC-system (Waters) consisting of a degasser, binary gradient pump, auto-sampler (5 ◦ C) and a column oven (40 ◦ C) was used for separations. All the target compounds were separated in a single gradient run by using a Zorbax SB C18 Agilent (2.1 × 50 mm, 1.8 m) column. The chromatographic conditions were flow rate of 250 L min−1 and injection volume of 5 L. Analytes were detected via multiple reaction monitoring (MRM) using an AB SCIEX API-5000TM triple quadrupole (Applied Biosystems/MDS SCIEX) with electrospray ionization (ESI) in positive mode. The mobile phase consisted of ammonium formate
(2 mM, pH 3) and methanol (50:50). The MS parameters were cad gas and curtain gas pressures 8 psig and 10 psig, respectively; the GS1/nebulizer and GS2/turbo GAS flow rates were 45 L min−1 and 30 L min−1 , respectively. Ion spray voltage (IS) and source temperature were fixed as 5500 V and 500 ◦ C, respectively. 2.3.4. Method validation Validation was done based on the guidelines of the International Conference on Harmonization for Validation of Analytical Procedures [15]. In this study, validation of the method was conducted attending the following criteria: linearity, limits of detection (LOD) and quantification (LOQ), and precision as repeatability (intraday precision) and inter-day precision. Furthermore, carryover, matrix effects and ion suppression were also evaluated.
12
M.Á. López Zavala, L. Reynoso-Cuevas / J. Chromatogr. A 1423 (2015) 9–18
Table 2 Recovered concentrations (RC) and mean recoveries (MR) obtained with the ultrasonic extraction method. Spiked conc. (ng g−1 )
KET RC (ng g−1 )a
NPX RC (ng g−1 )a
OFL RC (ng g−1 )a
CFL RC (ng g−1 )a
IFO RC (ng g−1 )a
CFO RC (ng g−1 )a
ATE RC (ng g−1 )a
PRO RC (ng g−1 )a
6 Std Dev CV (%) MRa (%) 80 Std Dev CV (%) MRa (%) 180 Std Dev CV (%) MRa (%)
6.10 0.40 6.52 101.7 86.10 3.41 3.96 107.6 193.34 4.09 2.12 107.4
6.14 0.60 9.70 102.3 86.24 3.88 4.50 107.8 201.94 4.05 2.01 112.2
6.00 0.42 6.94 100.0 84.34 5.09 6.03 105.4 198.32 2.30 1.16 110.2
6.04 0.49 8.14 100.7 81.18 6.08 7.49 101.5 195.20 6.96 3.57 108.4
5.24 0.23 4.48 87.3 77.80 2.21 2.84 97.3 172.22 4.20 2.44 95.7
5.70 0.26 4.59 95.0 79.24 2.10 2.64 99.1 177.50 4.09 2.30 98.6
6.22 0.52 8.29 103.7 82.68 8.01 9.69 103.4 203.44 2.32 1.14 113.0
5.66 0.47 8.25 94.3 82.86 3.83 4.63 103.6 190.08 2.14 1.13 105.6
a
Mean of five replications.
2.3.4.1. Linearity. Linearity of the calibration curves for each analyte was verified by the coefficient of determination (R2 > 0.98) and the coefficient of variation between response factors (CV < 15%). To generate the calibration curves, stock solutions of each pharmaceutical were prepared with Solution “A” to yield samples of five different concentrations (1 ng mL−1 , 10 ng mL−1 , 25 ng ml−1 , 50 ng ml−1 and 100 ng mL−1 ). 50.0 mg (dry based) compost samples were spiked with 100 L of those solutions yielding concentrations of 2.0 ng g−1 , 20.0 ng g−1 , 50.0 ng g−1 , 100.0 ng g−1 and 200.0 ng g−1 ; then, the pharmaceuticals were extracted as described in the Section 2.3.2. The extracts were analyzed by UHPLC–MS/MS as described in the Section 2.3.3. Calibration curves for the eight pharmaceuticals were prepared plotting the analytical signal (peak area) versus nominal (known) concentration. 2.3.4.2. Limits of detection (LOD) and quantification (LOQ). The limits of detection and quantification were determined by analyzing extracts (by quintuplicate) of compost samples spiked with known concentration of pharmaceuticals. The LOD was established as the minimum concentration that provides a signal to noise ratio greater than three for the eight pharmaceuticals. The LOQ was set as the minimum quantifiable concentration whose average value is not deviated beyond ± 20% (CV < 20%) of the nominal (known) concentration for the eight compounds. 2.3.4.3. Precision. Precision was considered at two levels, repeatability and inter-day precision. The repeatability was obtained by quantifying the concentration of control samples at three different concentration levels, namely low 6.0 ng g−1 , middle 80.0 ng g−1 and high 180.0 ng g−1 in five replicates of the spiked compost extracts during the same day. The inter-day precision was determined by measuring on two different days, with a daily-prepared standard curve, the concentration of the control samples at three different concentration levels, namely low 6.0 ng g−1 , middle 80.0 ng g−1 and high 180.0 ng g−1 in four replicates of the spiked compost extracts. The intraday and inter-day precisions were evaluated in terms of the coefficient of variation that must be lower than 15%. 2.3.4.4. Carryover. The carryover was estimated by injecting a blank sample extract (from non-spiked compost) after injecting a spiked compost extract with a pharmaceutical concentration of 200 ng g−1 . The acceptance criterion was either the absence of any signal or a signal not greater than 10% of noise. 2.3.4.5. Matrix effect. The matrix effect was estimated as follows. Three extracts of non-spiked compost were obtained and then each extract was spiked by triplicate with a known concentration of each pharmaceutical at three different concentration levels, namely low (50 ng g−1 ), middle (100 ng g−1 ) and high (200 ng g−1 ). Additionally,
solutions with the same three concentration levels were also prepared for each pharmaceutical. Concentrations of spiked extracts and solutions were quantified and compared. The percentage difference between corresponding determinations was calculated. There is signal enhancement if the percentage is positive and signal suppression if the percentage is negative. A value near to zero means low matrix effect. 2.3.4.6. Ion interference. The ion interference is useful to detect if one of the target compounds had some effect (ionization increase or reduction) over the others. The ion interference was determined by quantifying a pharmaceutical (by triplicate) in the presence of others. Three different concentration levels were used among the target pharmaceuticals, namely low (50 ng g−1 ), middle (100 ng g−1 ) and high (200 ng g−1 ). The CV of recovered concentrations should be lower than 15%.
3. Results and discussion 3.1. Optimization of the extraction method Nine different extraction procedures were evaluated for the eight pharmaceuticals. First, four extraction protocols developed for conventional HPLC-techniques, including solid phase extraction (SPE) and ultrasonic-assisted, and described by Martins et al. [11], Zhai and Zou [12], Christodoulou et al. [13], and Marachiello et al. [14]. When the HPLC technique was used, the Martins et al. protocol [11] was effective for the extraction of the eight pharmaceuticals; the Christodoulou et al. method [13] for the ciprofloxacin, ketorolac, naproxen and propranolol; the Maraschiello et al. procedure [14] for ofloxacin and ciprofloxacin; and the Zhai and Zou protocol [12] resulted not satisfactory for all the target compounds (results not shown in this paper). When those extraction protocols were tested with UHPLC–MS/MS, the results were not satisfactory for all the target pharmaceuticals, even for the Martins et al. method [11]. This was reasonable because such extraction methods were developed for conventional HPLC-techniques and when changing from HPLC to UHPLC analysis, MS parameters such as flow rates, ion spray voltage, source temperature, retention time and dwell times need to be altered to obtain the highest MS signals possible [16]. Due to those protocols resulted not satisfactory for all the target compounds; an exhausted work running great number of tests with different amounts of samples, extraction solvents, extraction times, extraction steps and even the use of SPE were evaluated in order to develop an optimum extraction procedure. The ultrasonic extraction method described in Section 2.3.3 resulted to be the optimum procedure for the simultaneous extraction of the eight pharmaceuticals. Table 2 presents the recovered concentrations,
M.Á. López Zavala, L. Reynoso-Cuevas / J. Chromatogr. A 1423 (2015) 9–18
13
Table 3 Mobile phase configurations evaluated, ions/transitions selected, and multiple reaction monitoring (MRM) conditions for the analytes detection. 1 2 3 4
Mobile phase
0.1% ammonium acetate + 0.1% acetic acid:ACN:MeOH (50:25:25) Water + 0.1% formic acid:ACN (50:50) MeOH + 0.1% formic acid:ACN (50:50) 2mM ammonium formate (pH 3):MeOH (50:50)
Target compound
RTa (min)
Precursor ion (m/z)
Productb ion (m/z)
Molecular formulac
DTd (ms)
DPe (V)
EPf (V)
CCg (V)
CCEPh (V)
Ketorolac (KET) Naproxen (NPX) Ofloxacin (OFL)
2.83 4.97 0.51
255.09 230.09 361.14
C7 H5 O+ C13 H13 O+ C14 H14 FN2 O2 +
300 300 300
100 115 142
11 10 10
30 30 50
10 10 10
Ciprofloxacin (CFL)
0.55
331.13
C12 H8 FN2 O2 +
300
150
14
50
10
Ifosfamide (IFO) Cyclophosphamide (CPO) Atenolol (ATE) Propranolol (PRO)
1.02 1.18 0.43 1.11
260.02 260.02 267.15 259.16
105.2, 77.0, 95.1 185.3, 170.1 261.4, 179.1, 219.3, 221.1, 301.2, 344.2 231.2, 189.2, 203.3, 314.4 182.1, 233.3 140.0, 233.3 145.2, 133.1, 190.0 155.2, 115.9, 128.8, 165.2, 182.9
C5 H10 ClNO2 P+ C4 H8 Cl2 N+ C10 H9 O+ C12 H11 +
300 300 300 300
90 90 140 130
6.5 6.5 9 10
30 30 40 40
10 10 10 10
a b c d e f g h
RT: Retention time. Underlined value: ion transition selected for quantification purposes. Molecular formula of selected ion. DT: dwell time. DP: declustering potential. EP: entrance potential. CC: collision cell. CCEP: collision cell exit potential.
mean recoveries and the coefficient of variation of the eight pharmaceuticals obtained with the ultrasonic extraction method. Mean recoveries were calculated as the percentage of the extracted pharmaceutical compared to the spiked level. As observed, the protocol exhibited a low variability response, with the CV ranging between 1.13% for propranolol at 180 ng g−1 to 9.70% for naproxen at 6 ng g−1 . The recoveries were in the range of 87% and 113% for all pharmaceuticals. These recoveries are much greater than those reported by the literature for less complex matrices. Martín et al. [6] obtained recoveries of 53% for naproxen and of 16–80% for other pharmaceuticals in sediment samples. Chen et al. [17] reported poor absolute recoveries (20.7–75.4%) for 30 commonly consumed pharmaceuticals in China from samples of dewatered sewage sludge; they found that these results could be due to high matrix effects during the analytical procedure. Marsoni et al. [8] reported low recovery for ofloxacin (37%) that could be attributed to the high sensitivity of this compound to the evaporation step during their extraction method; in the ultrasonic method proposed in this study, the recovery of ofloxacin was much greater (100–110%). Shafrir and Avisar [18] obtained recoveries of 11– 31% for sulfonamides and tetracyclines in treated wastewater sludge and composted biosolids using tandem-solid-phase extraction cleanup and HPLC–MS/MS with an electrospray ionization. Based on those results, it is clear that the ultrasonic extraction procedure proposed in this study is an effective and reliable method to extract pharmaceuticals in complex matrices such as compost. Simplicity of the ultrasonic method developed in this study implies necessarily low cost of extraction. This is in accordance with those remarks stated by Martín et al. [6] in the sense that USE is preferred because of its lower cost with respect to the other techniques reported for the extraction of pharmaceuticals from solid environmental samples. 3.2. Optimization of the ultrahigh pressure liquid chromatography and mass spectrometry method Four mobile phase configurations, MRM conditions and pharmaceuticals’ molecules fragmentation were evaluated for the finest performance of the method. At least two ions/transitions were selected for each target analyte. But, for quantification purposes,
the most probable ion product (greater area) was selected as the quantification ion/transition and the other ions/transitions served as qualifier ions to confirm the detection of the suspected compound. Table 3 shows the mobile phase configurations evaluated and the ions/transitions selected for each compound. From several experiments conducted with compost extracts, the optimum mobile phase resulted to be the solution consisting of ammonium formate (2 mM, pH 3) and MeOH (50:50). The optimized ESI and MS/MS parameters, including precursor ions, product ions, collision energy, among others, are all summarized in Table 3. Fig. 2 shows the final retention times obtained for each pharmaceutical and for the MRM conditions shown in Table 3. As seen, the total analysis time is much shorter than conventional HPLC techniques. The retention factor