R esearch A rticle For reprint orders, please contact
[email protected]
Simultaneous LC–MS/MS quantitation of acetaminophen and its glucuronide and sulfate metabolites in human dried blood spot samples collected by subjects in a pilot clinical study Background: In support of a pilot clinical trial using acetaminophen as the model compound to assess dried blood spot (DBS) sampling as the method for clinical pharmacokinetic sample collection, a novel sensitive LC–MS/MS method was developed and validated for the simultaneous determination of acetaminophen and its major metabolites, acetaminophen glucuronide and sulfate, in human DBS samples collected by subjects via fingerprick. Results: The validated assay dynamic range was from 50.0 to 5000 ng/ml for each compound using a 1/8´´ (3‑mm) disc punched from a DBS sample. Baseline separation of the three analytes was achieved to eliminate the possible impact of insource fragmentation of the conjugated metabolites on the analysis of the parent. The overall extraction efficiency was from 61.3 to 78.8% for the three analytes by direct extraction using methanol. Conclusion: The validated method was successfully implemented in the pilot clinical study with the obtained pharmacokinetic parameters in agreement with the values reported in literature. Dried blood spot (DBS) sampling is receiving
increasing interest in drug discovery and development and therapeutic drug monitoring due to its inherent advantages over the conventional blood and plasma or serum collection methods [1] . One major advantage is that DBS samples can be collected directly by patients themselves or their guardians with minimal training. This opens up the possibility of collecting clinical pharmacokinetic and/or biomarker samples from various in-patient and out-patient settings, especially from patients living in remote areas [1] . DBS samples can be easily taken when needed and, after air-drying for at least 2 h, sent to laboratories for analysis. In fact, many diagnostic assays employ DBS sample collection to monitor the status of some infectious diseases, for example, HIV, HBV and HCV, for the patients living in remote regions with resource-limited settings [2–3] . Various DBS LC–MS/MS assays have been implemented for quantitative analysis of investigational molecules and/or their metabolites ranging from in-clinic to various out-patient settings [4–8] . Acetaminophen (APAP) is a major ingredient in numerous cold and flu remedies, serving as an analgesic (relief from headaches) and an antipyretic (fever reducer). For immediate release formulations, APAP is absorbed quickly 10.4155/BIO.12.119 © 2012 Future Science Ltd
after oral administration with peak concentrations generally occurring at approximately 1 h postdose with a short elimination half-life of around 2–3 h. Metabolism is primarily by the liver involving three major pathways: oxidation by cytochrome P450, and glucuronide and sulfate conjugation. The two major metabolites of APAP are acetaminophen glucuronide (APAP– gluc) and acetaminophen sulfate (APAP– sulf). The recommended APAP dose is 500 to 1000 mg as a single dose with maximum dose of up to 3000 mg per day for adults [101] . At these dose levels, APAP is considered well tolerated, generally with only minor side effects observed [9–11] . Recently, APAP has been tested as a model compound in human and animal studies for evaluating DBS as a sampling technique [12–14] . Quantitative LC–MS/MS analysis of the collected DBS samples has been focused on APAP without including its two major metabolites (i.e., APAP–gluc and APAP–sulf). These two metabolites are reported, respectively, to account for 40 to 67% and 20 to 40% of human metabolism of APAP [15] . From a LC–MS/MS bioanalysis point of view, the presence of these highly abundant phase II metabolites in study samples can be a concern for the accuracy of APAP measurement. Any chromatographic coelution of these phase II metabolites with the Bioanalysis (2012) 4(12), 1429–1443
Wenkui Li*, John P Doherty, Kenneth Kulmatycki, Harold T Smith & Francis LS Tse Department of Drug Metabolism & Pharmacokinetics, Novartis Institutes for Biomedical Research, One Health Plaza, East Hanover, NJ 07936, USA *Author for correspondence: Tel.: +1 862 778 4255 Fax: +1 973 781 7579 E-mail:
[email protected]
ISSN 1757-6180
1429
R esearch A rticle | Key Terms Dried blood spot sampling: A technique in
which blood is spotted on cellulose or polymer-based paper and dried.
Therapeutic drug monitoring: A branch of
clinical chemistry and clinical pharmacology that specializes in the measurement of blood concentrations of drugs, especially those with a narrow therapeutic window, for improving patient care via dose adjustment of the drugs.
Pharmacokinetics: Study of the movement of drugs in the body, including the processes of absorption, distribution and excretion. Remote pharmacokinetic sample collection: Collection of pharmacokinetic samples, typically dried blood spots, conventionally carried out by patients themselves or their guardians after minimal training.
Dried blood spot card:
Cellulose or polymer-based material of known characteristics, used for the collection, shipping and storage of dried blood spot samples.
Li, Doherty, Kulmatycki, Smith & Tse
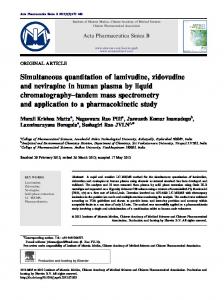
parent would lead to overestimation of the parent as a result of in-source fragmentation of the conjugates in the heated gas phase of the mass spectrometer [16] . The purpose of the current study was to develop and validate an LC–MS/MS method for the simultaneous determination of APAP and its two major metabolites, APAP–gluc and APAP–sulf, in human DBS samples. In particular, matrix effect and extraction recovery were evaluated for the analysis of all three analytes in human DBS samples prepared using untreated Ahlstrom® 226 card, chemically treated FTA® DMPK A, FTA DMPK B and FTA Elute micro cards, and polymer-based Agilent Bond Elut cards. The validated assay method using Ahlstrom 226 card was implemented in support of a pilot clinical study for remote APAP p harmacokinetic (PK) and biomarker (proteins, enzymes and others) sample collection. The methodology and associated analytical results for the biomarkers are not included herein. Experimental reagents & materials Reference compound of APAP was obtained from MP Biomedicals, LLC (OH, USA). APAP–gluc and APAP–sulf were purchased from SigmaAldrich (MO, USA) (Figure 1) . IS 13C2 –15NAPAP, 3H 2 -APAP–gluc and 3H 2 -APAP–sulf were, respectively, purchased from Cambridge Isotope Laboratories, Inc. (MA, USA), Gentest (MA, USA) and Medical Isotopes, Inc. (NH, USA). HPLC grade methanol and acetonitrile and certified ammonium hydroxide (~29%, v/v) and formic acid (~87%, v/v) were obtained from Fisher Scientific (NJ, USA). Certified ammonium formate (~99%) was obtained from Acros
Chemicals,
A
Chromatographic
conditions The HPLC system includes a Shimadzu CBM‑20 system controller, two Shimadzu LC-20AD XR pumps, a Shimadzu CTO-20AC column heater and a Shimadzu SIL-20ACHT autosampler with a rack changer from Shimadzu (MD, USA). Reversed-phase chromatography of APAP, APAP–gluc and APAP–sulf and corresponding IS was carried out using a Waters Atlantis T3 (50 × 2.1 mm, 3.0 µm particle size) held at ~35°C at a flow rate of 0.300 ml/min. Mobile phase A was 10 mM ammonium formate in water with 0.01% ammonium hydroxide, while mobile Phase B was methanol. The sample injection volume was 10 µl. The analysis cycle time between two consecutive injections was approximately 8 min. An optimal chromatographic separation of the analytes and IS was achieved by running 2% B from 0 to 0.5 min, 2 to 30% B from 0.5 to 2.5 min, 30 to 95% B from 2.50 to 2.60 min, held at 95% B for 0.5 min and then to 2% B at 3.11 min followed by a 4.7 min of column H N
B
H N
C H N
O
O HO
HO
(NJ, USA). Water was purified via an ELGA ultrapure water system (ELGA, Oxford, UK). Human plasma and fresh blood with hematocrit of ~50% and K 2EDTA as the anticoagulant was obtained from Bioreclamation (NY, USA). A TomTec Quadra 96 mode 320 system (Hamden, CT, USA) was used for transferring samples during sample preparation. Untreated Ahlstrom 226 cards were obtained from ID Biological systems (currently part of Perkin Elmer, SC, USA). Chemically treated FTA Elute micro cards, FTA DMPK A and FTA DMPK B cards were purchased from GE Healthcare Bio-sciences (NJ, USA). Agilent Bond Elut matrix spotting cards were obtained from Agilent Technologies, Inc. (CA, USA).
O
O
O
HO
O O
OH
O
O S
OH
OH
Figure 1. Chemical structures of (A) acetaminophen (APAP), (B) acetaminophen– glucuronide (APAP–gluc) and (C) acetaminophen–sulfate (APAP–sulf).
1430
Bioanalysis (2012) 4(12)
future science group
Quantitation of acetaminophen & its glucuronide & sulfate metabolites equilibration using 2% B. The retention times of APAP, APAP–gluc and APAP–sulf were at 3.2, 1.5 and 2.7 min, respectively. MS
conditions A Sciex API5000 triple-quadrupole mass spectrometer (AB Sciex, Concord, Canada) with turboionspray (TIS) interface operated in negative ionization mode was employed for the multiple reaction monitoring (MRM) detection of the LC–MS/MS analyses. The precursor-toproduct ion transitions used for the MRM of APAP, APAP–gluc and APAP–sulf are, respectively, m/z 150.0→107.0, m/z 326.0→150.0 and m/z 230.0→150.0, with a dwell time of 100 msec for each mass transition. The mass spectrometric parameters optimized were as follows: TIS temperature, 500°C; TIS voltage, -5.0 kV; curtain gas (CUR), 25 units; nebulizing gas (GS1) 90 units; TIS gas (GS2), 80 units; collision gas, 10 units; declustering potential (DP), -58 V; entrance potential (EP), -10 V; collision energy (CE) and collision cell exit potential (CXP) are, respectively, -22 eV and -5 V for APAP, -30 eV and -15 V for APAP–gluc, and -50 eV and -5 V for APAP–sulf. The mass spectrometer was operated at unit mass resolution for both Q1 and Q3 quadrupoles. Preparation
of standard solutions and/or intermediates Stock solutions of APAP, APAP–gluc and APAP–sulf, each at concentration of 5.00 mg/ml, were prepared in aqueous methanol (50%, v/v). The stock solutions were stored in glass vials at