TPP1 was found to behave differently from the other six ... For MPS II, IIIB, IVA, VI, and VII: confirmed low activity ... N-acetylgalactosamine 6-sulfatase (GALNS).
Simultaneous measurement of lysosomal enzyme activities associated with MPS II, MPS IIIB, MPS IVA, MPS IVB, MPS VI, MPS VII, and CLN 2 disorders from a dried blood spot via LC-MS/MS
Sara E. Smith*, Jim DiPerna, Alyssa Vranish: PerkinElmer Genetics, Pittsburgh, PA 15275 Anna Potier, Joe Trometer, Tsun Au Yeung: PerkinElmer, Waltham, MA 02451 Yang Liu, Fan Yi, Naveen Kumar Chennamaneni, Zdenk Spacil, Arun Babu Kumar, Joyce Liao, Michael H. Gelb, C. Ronald Scott, Frantisek Turecek: University of Washington, Seattle, WA 98195
1
3
Introduction
• Lysosomal storage disorders (LSD) are a class of diseases initiated by inherited gene mutations that result in a disruption of lysosomal function. These mutations often cause a deficiency in activity of a particular lysosomal enzyme. • The lack of activity results in the accumulation of cellular components, leading to clinical manifestation and disease progression. • Currently, FDA approved treatments are available for many LSDs including MPS II, MPS IVA, MPS VI, MPS VII, and CLN2. In addition, discovery research and clinical trials are on going for other disorders. • The development of newborn screening (NBS) assays for LSDs provide the ability to identify pre-symptomatic individuals, allowing for more effective therapeutic interventions. • Assay multiplexing allows for higher sample throughput and reduced cost, both of which are highly desired in NBS. • The goal of this study was to determine if a seven-plex enzyme activity assay could be developed for two types of LSDs: mucopolysaccharidoses (MPS) and neuronal ceroid lipofuscinoses.
2
5
Assay Procedure
6
Results
Enzymatic reactions were carried out by incubating dried blood spots (DBS) within a cocktail containing enzyme specific substrates and internal standards .
•
Table 1. Concentrations of enzyme specific substrates and internal standards included in assay cocktail and buffer composition.
•
Substrate
Concentration (µM)
Internal Standard
Concentration (µM)
ID2S
500
ID2S
5
NAGLU
500
NAGLU
5
GALNS
1000
GALNS
5
bGAL
500
bGAL
5
ARSB
1000
ARSB
5
GUSB
500
GUSB
10
TPP1
200
TPP1
15
•
Figure 2. Sample chromatogram of a high activity quality control sample. Black traces represent the product formed by each enzyme. Red traces represent internal standards.
Buffer Composition Reagent
Concentration (mM)
Ammonium Acetate (pH 5)
60
Cerium Acetate
7
NAG-thiazoline
0.1
•
A single 3.2 mm punch was collected from each DBS sample.
• • •
Assay Background
More than 500 apparently normal newborn samples were analyzed. For MPS II, IIIB, IVA, VI, and VII: confirmed low activity patient samples were randomly distributed among the presumed healthy samples. For MPS IVB, no patient samples were obtained at the time of this study, therefore low activity contrived samples were manufactured.
• The assay centers around the ability of each enzyme to convert a substrate to a product. Normal ID2S Function:
ID2S Deficient: (A)
(B)
(C)
(D)
(E)
(F)
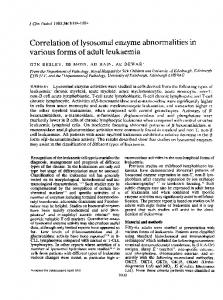
Figure 1. Overview of sample preparation for seven-plex lysosomal enzyme activity assay.
4 •
• The activity of the following enzymes will be measured directly by (MS/MS): • Iduronate 2-sulfatase (ID2S) • α-N-acetylglucosaminidase (NAGLU) • N-acetylgalactosamine 6-sulfatase (GALNS) • β-galactosidase (bGAL) • Arylsulfatase B (ARSB) • β-glucuronidase (GUSB) • Tripeptidyl peptidase 1 (TPP1)
•
Analysis Method
Analysis was performed using a Shimadzu® Nexera® X2 UPLC system coupled with a Sciex® 5500 QTRAP™ MS/MS. The mass spectrometer was operated in MRM mode with positive polarity.
Table 2. UPLC parameters.
Table 3. Gradient conditions.
Parameter
Time (min)
%A
%B
Column
Waters® X-select™ CSH C18 column (50 x 2.1 mm; 3.5 µm)
0.01
70
30
Guard column
Waters® Vanguard™ CSH pre-column (10 x 2.1 mm; 3.5 µm)
0.50
70
30
Column Temperature (° C)
35
1.00
60
40
Flow Rate (0.5 mL/min)
0.5
2.00
60
40
Injection Volume (µL)
1.0
2.50
15
85
Mobile Phase A
0.1% formic acid
3.00
15
Mobile Phase B
0.1% formic acid in acetonitrile
3.01 3.50
TPP1 was found to behave differently from the other six enzymes. When analyzing a linear series containing 30 different activity levels, a non-linear response was observed (Figure 4A). As the normal TPP1 activity was found to lie within the saturated region of the curve, the use of equation 1 will not allow for an accurate determination of the average normal enzyme activity. Figure 4B displays that the methodology does allow for a differentiation between manufactured positive controls and presumed normal newborns. However, a different approach must be established for determining an appropriate cut-off.
As seen in figure 2, the response of each product and internal standard was monitored via tandem mass spectrometry. Enzyme activities were then calculated using equation 1. 𝑃𝑠 𝑃𝑏 − 𝐶𝐼𝑆 × 𝑉𝐼𝑆 𝐼𝑆𝑠 𝐼𝑆𝑏 𝐸𝑛𝑧𝑦𝑚𝑒 𝑎𝑐𝑡𝑖𝑣𝑖𝑡𝑦 (µ𝑀/ℎ) = 𝑉𝑏 × 𝑡
Equation 1. Calculation of enzyme activity. Where, (Ps/ISs) represents the area ratio in a sample; (Pb/ISb) represents the area ratio in a blank; CIS represents the IS concentration in units of μM; VIS represents volume of IS solution in units of μL; Vb represents the volume of blood in units of μL; and t represents the incubation time in units of h. A blood volume of 3.1 μL was assigned to a 1/8 inch DBS punch.
Figure 3. Dot plots comparing calculated enzyme activities of (A) ID2S, (B) NAGLU, (C) GALNS, (D) ARSB, (E) GUSB, and (F) bGAL. Table 4. Enzyme activities measured from presumed normal and confirmed low activity samples. Proposed cutoffs were calculated as 10-20% of the average mean activity. Enzyme Activity (µM/h) ID2S
NAGLU
GALNS
bGAL*
ARSB GUSB
Average “normal”
18.47
3.74
2.63
19.61
11.73
24.73
85
Lowest “normal”
9.50
1.28
0.44
3.58
2.32
8.27
70
30
Highest confirmed low
0.63
0.03
0.08
1.21
0.24
0.10
70
30
Proposed Cutoff
3.69
0.75
0.39
2.94
1.76
4.95
*bGAL cutoff is putative as a positive patient sample was not obtained at the time of the study.
Challenges
(A)
(B)
Figure 4. (A) Comparison of TPP1 calculated and theoretical enzyme activities from a linear series of 30 levels; (B) Dot plot comparing calculated TPP1 enzyme activities.
7
Summary
• An assay has been successfully developed that allows for the direct measurement of ID2S, NAGLU, GALNS, bGAL, ARSB, GUSB, and TPP1 activity from DBS. • The method was able to clearly differentiate between presumed normal newborns and confirmed low enzyme activity positive samples, or in some cases, manufactured low activity controls. • TPP1 was found to display a non-linear behavior when a series of enzyme activity controls were analyzed. The analysis still differentiates presumed normal from low activity, however the cut-off must be determined in a different manner. This is still under investigation. • This assay is used as a primary screening tool. For identified positives, sequencing is performed for confirmation.
• The authors would like to thank Greenwood Genetics, the Mayo Clinic, and Serv. Genet. Med. HCPS for providing confirmed low activity DBS samples. • All DBS samples were collected following IRB approved protocols.
PerkinElmer Genetics, 250 Industry Drive, Pittsburgh, PA USA (412) 220-2300 www.perkinelmer.com/genetics PerkinElmer, Inc., 940PerkinElmer Winter Street, Waltham, MA USAand (800) 762-4000 or (+1)and 203precision 925-4602 Pursuant to applicable federal and/or state laboratory requirements, Genetics establishes verifies the accuracy of www.perkinelmer.com their testing services.