Simultaneous Switching Noise Suppression for High Speed Systems Using Embedded Decoupling Joseph M. Hobbs*, Hitesh Windlass, Venky Sundaram, Sungjun Chun, George E. White, Madhavan Swaminathan, Rao R. Tummala Packaging Research Center Georgia Institute of Technology 813 Ferst Drive NW, Atlanta, GA 30332-0560 *Delphi Automotive Systems Fellow Delphi Packard Electric Systems 4551 Research Parkway Warren, Ohio 44483 Tel: 404-385-0730 Fax: 404-894-3842 Email:
[email protected] Abstract High performance computing systems are driving towards higher clock speeds, more switching circuits, and lower operating voltages. Simultaneous switching noise (SSN) will greatly affect signal integrity in such complex future mixed signal systems. It has been reported that in addition to inductance effects, power plane bounce also becomes a critical factor for packages containing many power and ground vias in parallel. Discrete surface mount capacitors are currently being used by designers to suppress noise. As part of the System on a Package (SOP) concept being developed at the Packaging Research Center (PRC), Georgia Tech, a test vehicle to demonstrate the suppression of SSN using embedded decoupling capacitors is being implemented. This test vehicle uses thin film sequential buildup technology on a low-cost organic platform incorporating polymer–ceramic nanocomposite dielectrics. The design rules for the test vehicle were developed using SOP substrate materials and processes; furthermore, Ansoft along with Matlab were used to model the microstrip transmission lines. The layout was done using Cadence Advanced Package Designer (APD) and output into Gerber format for fabrication. The current test vehicle uses a 300 mm x 300 mm high Tg FR-5 base substrate with four metal layers on each side. Photoimageable epoxy dry films of 25 µm and 75 µm thickness were used as the low k (3.4 - 3.9) sequential build-up dielectric. A novel photoimageable polymer ceramic nanocomposite material developed at the PRC was used for the high k (25 - 50) thin films. Low cost materials and large area processes were used for the substrate fabrication including dry film printed wiring board (PWB) photoresists, vacuum lamination and spin/meniscus coating for dielectric deposition, full-field UV lithography, and electroless and electrolytic copper metallization. Simulations confirm that the SSN will be suppressed by a factor of ten when using the high k material as the capacitor dielectric. This paper presents the design, fabrication and validation of embedded decoupling for SOP technology. Need for Simultaneous Switching Noise (SSN) Suppression Today’s microprocessors and application specific integrated circuits (ASICs) have hundreds of IOs that switch within one cycle time. The problem occurs when the noise produced by all of these simultaneously switching circuits approaches the noise tolerance of a static CMOS circuit,
0-7803-7038-4/01/$10.00 (C)2001 IEEE
causing degradation in the signal integrity [1]. From the NTRS roadmap in Table 1, it can be seen that by 2006, the minimum logic will be 1.2 volts with I/O frequencies at 2075 MHz. These two factors illustrate how critical it has become to understand and minimize SSN. Furthermore, the SSN issue has shifted from an inductance problem to a power bounce problem because electronic packaging has progressed from traditional lead frame packages to packages that have power and ground planes [2]. A collaborative study by Sun Microsystems and Georgia Table 1: 1999 NTRS IC Roadmap Yr. Of Firs t Product Shipm e nt
2001
2003
2006
2009
Feature size(nm)
150
130
100
70
50
Pow er dissipation (w atts) (High-perf .)
108
129
160
170
174 109
(cost-perf .) Minimum logic V dd (volts) Chip current (amperes)
(High -perf .) (a) (Cost -perf) (a)
I/O Frequency
(High perf .) (MHz)
2012
61
75
96
104
1.5
1.5
1.2
0.9
0.6
72
86
133
189
290
40.7
50
80
116
182
1570
1770
2075
2570
3080
(Cost perf .) (MHz)
730
930
1100
1470
1830
dI/dt (ampheres/ns)
(High-perf ) (b)
452
609
1104
1943
3573
(Cost perf.) (b)
119
186
352
682
1332
L(equivalent)(pH)
(High-perf.) (c)
0.33
0.25
0.11
0.046
0.017
(Cost-perf.) (c)
1.3
0.81
0.34
0.13
0.045
CDE COUP LING (nF)
(High-perf.) (d)
275
292
482
735
1412
(Cost-perf.) (d)
334
323
545
786
1489
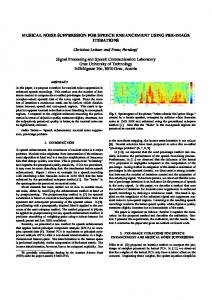
Tech Packaging Research Center (PRC) explored the fundamental understanding of factors influencing SSN [3]. Figure 1 is an illustration of the test vehicle that was designed 300 mils
30 mils
4 mils 34 mils 4 mils 20 inches
Figure 1: Schematic of the Sun SSN Test Vehicle
2001 Electronic Components and Technology Conference
as part of this investigation. Extensive modeling was done in order to better predict the noise generated on the power planes. Such modeling has enabled the formulation and modeling of proposed solutions for SSN suppression. New Approaches to SSN Reduction The System-on-a-Package (SOP) vision proposed by the Packaging Research Center (PRC) is a highly integrated systems packaging solution, and this paradigm empowers future electronics packaging technologies, their design environments, and system integrators. SOP technology development at the PRC is based on low-cost, thin film sequential build up substrates containing fine lines and spaces and microvias. Unique attributes of this technology include the ability to integrate thin and thick film passive components into the substrate, thus enabling very efficient decoupling, filtering, and termination. The test vehicle in Figure 1 has been redesigned for SOP technology implementation and a cross-section is shown in Figure 2. The test vehicle in Figure 1 and most other conventional approaches have typically utilize surface mount decoupling capacitors to supress SSN. However, the SOP test vehicle was designed using embedded decoupling in the substrate to allow for improved performance over standard PWB technology. The enhancement in decoupling is due to
lamination of dry film dielectrics [4]. The immediate impact of this process on the substrate thickness is easily seen by comparing Figure 1 and Figure 2. Layers as thin as 10 µm can be obtained with this process, as compared to 100 µm innerlayers in conventional PWBs. High dielectric constant nanocomposite materials have been developed at the PRC by blending low k polymers with high k ceramic fillers [5]. A dielectric constant in the range of 30 – 45 can be achieved for a layer thickness of between 10 – 15 microns. Simulation has confirmed that the SSN can be expected to be up to 10 times less than that measured and simulated in standard PWB. Simulation Results The thin film SOP structures were simulated using an equivalent circuit model [3] that is based on waveguide theory for the planes where the circuit characteristics in the vicinity of a resonant frequency can be expressed in terms of C, L and G parameters. Since the planes act as cavity resonators, the capacitor ‘C’ is used for storage of electric energy and the inductor ‘L’ for storage of magnetic energy, whereby at the resonant frequency, there is an exchange of energy between the two elements. The conductance ‘G’ is used to account for the losses in the circuit. Thus the equivalent circuit can model the plane-pair as a waveguide coupled to the various natural modes of the resonator through transformers. The equivalent
22 Ω transmission lines
10-15 µ GND
VDD
Ηigh εr = 30-45 (PMNPT +epoxy)
50 Ω transmission lines
Low εr= 3.9
Core GND
Low εr= 3.9 Ηigh εr = 45 (PMNPT +epoxy)
Low εr = 3.9
Standard PWB
10 µ
VDD
First Layer Noise (V)
Low εr = 3.9
Low k SOP
High k SOP
22 Ω transmission lines
Figure 2: Cross-section of the SOP SSN Test Vehicle the location of the capacitors extermely close to the chip-topackage interconnects compared to SMT components. For a buried parallel plate capacitor structure, capacitance can be defined by the following equation:
C =
εA d
Time (s)
Figure 3: Equivalent Circuit Simulation of Standard PWB, Low k SOP, and High k SOP Structures. circuits were constructed for three structures, i.e. the structure with standard PWB technology, the SOP structure with low k Table 2: Peak-to-Peak Noise Comparison.
where ε is the dielectric constant of the material, A is the effective surface area of the capacitor, and d is the thickness of the dielectric layer. Higher dielectric constant and thinner dielectric layers will help to increase the overall capacitance. These two factors were the main objectives of the test vehicle design. The sequential build-up process used in SOP and other high density substrates incorporates thin dielectric layers through spin/meniscus coating of liquid polymers, or vacuum
0-7803-7038-4/01/$10.00 (C)2001 IEEE
S u bstra te S tandard P W B Low k S O P High k S O P
P e a k-to -P e a k Noise (V olts) 1.84 0.26 0.08
Re du ction 1X 7X 23X
2001 Electronic Components and Technology Conference
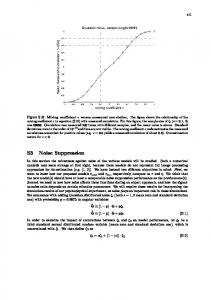
Test Vehicle Design The test vehicle was designed based on the printed circuit board test vehicle discussed earlier and shown in Figure 1 [3]. The design process began with the simulation of microstrip lines in Ansoft. This was done to determine the line widths and dielectric thicknesses necessary to achieve the desired 22 Ω and 50 Ω characteristic impedances for the transmission lines. The values were then verified using a MATLAB simulation. Figure 4 is a plot of the characteristic impedance vs. the dielectric thickness for the 50 Ω lines. For this simulation, the line width was limited by the process and the impedance was 70
Cha ra cte ristic Im pe da nce (Ohm s)
60
Characteristic Impedance (ohms)
dielectric, and the SOP structure with a combination of high and low k dielectric materials. Figure 3 is the SPICE result of the equivalent circuit simulation for the three structures. As shown in Figure 3, the switching noise has reduced significantly for the SOP structures compared to the structure with standard PWB technology. Table 2 summarizes the differences in the peaak-to-peak noise for each substrate.
45 40 35 30 25 20 15 10 3
4
5
6
7
8
9
10
11
Line width (mils)
Figure 5: MATLAB Simulation of a 22Ω Ω Transmission Line. view of the test vehicle. The parallel plate decoupling capacitor was formed by using the VDD and ground planes with a dielectric layer sandwiched between them. Once the cross-section and the design rules were finalized, Cadence Advanced Package Designer (APD) was used to do the circuit layout. A top view of the final design is illustrated in Figure 6. The design was converted to Gerber R274X format and artwork was plotted on Mylar films for substrate fabrication.
50
40
30
20
10
0 0
0.5
1
1.5
2
2.5
3
3.5
Die le ctric T h ickn e ss (m ils)
Figure 4: MATLAB Simulation of a 50Ω Ω Transmission Line fixed; therefore, the simulation was done to find the required dielectric thickness. The result was a dielectric thickness of about 2.5 mils (62.5 µm). Figure 5 is a result of the simulation that was done for the 22 Ω transmission lines. In this case, 22 Ω was required to maximize the current through the transmission lines for amplifying the power supply noise. Also, the minimum available dry film thickness was 1 mil (25 µm). From the simulation the resulting line width was found to be 8 mils (200 µm). The next step in the design process was to determine the design rules and the cross-section for the metal layer build-up. The board was designed to be double sided with four metal layers on each side of the FR-4 substrate. A minimum of four metal layers was needed to duplicate the PWB design, but eight were used to minimize warpage and other effects from a single sided process. Figure 2 illustrates a cross sectional 0-7803-7038-4/01/$10.00 (C)2001 IEEE
Figure 6: Top View of the Completed SOP SSN Test Vehicle Design in Cadence APD Test Vehicle Fabrication The SOP SSN test vehicle uses a rigid 300mm x 300mm FR-5 laminate substrate with double sided 9µm thick copper as the core. This material has a dielectric constant of 3.7 and loss tangent (Df) of 0.010 at 1 GHz. A sequential build-up process was used to add three more wiring layers with microvia interconnects. A photoimageable epoxy dry film was used as the build-up dielectric and this material has a k of 3.19 and Df of 0.026 at 1 GHz. The thickness of the interlayer dielectric is between 75µm and the copper metal thickness is nominally 8-10µm. Thin film capacitors (10-20 µm thickness) in a parallel plate format were fabricated using a liquid
2001 Electronic Components and Technology Conference
photoimageable epoxy dielectric with a k of 3.5 and Df of 0.020 at 1GHz. The thickness of the capacitor layer was between 10 and 20µm. The process sequence consisted of subtractive etch process for defining the first layer circuit traces. This was followed by lamination of the dry film epoxy dielectric. This process resulted in excellent planarization over the underlying circuitry. Microvias were created using UV contact lithography to form the layer to layer interconnects. The polymer was cured using a combination of UV and thermal treatments. The metallization process started with a standard permanganate based roughening process followed by seed electroless copper plating. The copper traces were built-up through a dry film photoresist using electrolytic pattern plating using an acid copper chemistry. Finally, the photoresist was stripped and the seed copper layer etched back using a mild microetch chemistry to complete the metallization. The next dielectric layer was then added and the process repeated to form a multilayer stack-up. High Dielectric Constant Nanocomposites for Decoupling Polymer-ceramic nanocomposite technology is a highly favorable low-cost option for embedded capacitors in organic laminates because of low processing temperatures (< 220°C) and elimination of expensive processing steps such as CVD, and sputter deposition. Nanocomposite dielectrics are dispersions of nano-sized particles (< 200 nm) in a polymeric phase. The cornerstone of this technology is the potential for defect free thin films (