Woldehiwet Z, Aitken ID: 1993, Coxiellosis (Q fever). In: Rick- ettsial and chlamydial diseases ..... Maria Sklodowska-Curie Fund. Sources and manufacturers a.
Brief communications
mans.8 The clinical significance of C. burnetii infection in seals is unclear; this harbor seal was euthanized because of protozoal encephalitis, unrelated to the placental infection. The potential for C. burnetii infection to cause abortion in seals, as it does in sheep and goats,1 is also uncertain. In this animal, the placental infection was not associated with perceptible fetal lesions, and the full-term fetus was still viable at the time of the dam’s death. The most significant aspect of this infection may be the potential for zoonosis for zoo or rehabilitation center workers that may be exposed to placental tissues or newborn seal pups.
Sources and manufacturers a. b. c. d.
Zymed Laboratories, South San Francisco, CA. Integrated Diagnostics, Baltimore, MD. ADI Diagnostics, Rexdale, ON., Canada. Antoinette Marsh, University of California, Davis, CA.
3.
4.
5.
6.
7. 8.
References
9.
1. Babudieri B: 1959, Q fever: a zoonosis. Adv Vet Sci Comp Med 5:81–181. 2. Enright JB, Franti CE, Longhurst WM, et al.: 1971, Coxiella
543
burnetii in a wildlife–livestock environment. Antibody response of ewes and lambs in an endemic Q fever area. Am J Epidemiol 94:62–71. Haines DM, Chelack BJ: 1991, Technical considerations for developing enzyme immunohistochemical staining procedures on formalin-fixed paraffin-embedded tissues for diagnostic pathology. J Vet Diagn Invest 3:101–112. Lang GH: 1990, Coxiellosis (Q fever) in animals. In: Q fever, ed. Marrie TJ, vol. 1. The disease, pp. 23–48. CRC Press, Boca Raton, FL. Lapointe JM, Duignan PJ, Marsh AE, et al.: 1998, Meningoencephalitis due to a Sarcocystis neurona-like protozoan in Pacific harbor seals (Phoca vitulina richardsi). J Parasitol 84:1184– 1189. McCaul TF, Williams JC: 1981, Developmental cycle of Coxiella burnetii: structure and morphogenesis of vegetative and sporogenic differences. J Bacteriol 147:1063–1076. Riedman M: 1990, The pinnipeds: seals, sea lions and walruses, p. 439. University of California Press, Berkeley, CA. Sawyer LA, Fishbein DB, McDade JE: 1987, Q fever: current concepts. Rev Infect Dis 9:935–946. Woldehiwet Z, Aitken ID: 1993, Coxiellosis (Q fever). In: Rickettsial and chlamydial diseases of domestic animals, ed. Woldehiwet Z, Ristic M, pp. 131–151. Pergamon Press, Oxford, England.
J Vet Diagn Invest 11:543–547 (1999)
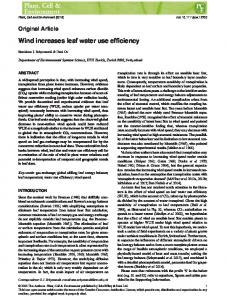
Simultaneous use of two primer pairs increases the efficiency of polymerase chain reaction assay in the diagnosis of bovine leukemia virus infection Michal Reichert, Jan Stec Enzootic bovine leukemia is a neoplastic disease caused by bovine leukemia virus (BLV), a member of the Retroviridae family. Under natural conditions, the disease occurs only in cattle, but sheep, goats, piglets, rabbits, and chickens can be infected experimentally.2 At present, BLV infection is pandemic. The virus replicates in the lymphoid system and causes polyclonal lymphocytosis in 30% of infected animals.6 Tumor-like neoplastic alterations accompanied by clinical signs develop slowly and manifest in about 5–10% of infected cattle.2 BLV infections cause economic losses resulting in a drop in milk production, diminished resistance to other diseases, restricted export of animals, and the destruction of valuable breeding animals.13 At present, serologic methods such as the agar gel immunodiffusion test and the enzyme-linked immunosorbent assay (ELISA) are standards in the diagnosis of bovine leukemia.5 Recently, virus detection has reached a molecular level, with the use of molecular probes and the polymerase chain reaction (PCR).4,11,15 The sensitivity of PCR permits detection of bovine leukemia provirus in 6.8% of serologFrom the Department of Biochemistry, National Veterinary Research Institute, Al. Partyzantow, 57, 24-100, Pulawy, Poland. Received for publication September 9, 1999.
Table 1.
Oligonucleotide primers used for PCR for BLV.
Primer
Sequence
Location*
OL-1 OL-2 OL-3 OL-4
59-CCCACAAGGGCGGCGCCGGTTT-39† 59-GCGAGGCCGCGTCCAGAGCTGG-39† 59-GCTGACAACCTTCCCGACGG-39 59-GACAGTCTCGTTTCCAATGG-39
5099–5120 5521–5542 1420–1440 1764–1783
Fragment length (bp)
444 364
* Nucleotide numbers from a previous study.16 † The sequence of primers was similar to that previously published.1
ically negative BLV-exposed cattle.8 However, the sensitivity of BLV PCR is not 100%. The PCR assay performed with serologically positive animals fails in about 1.4–9.6% of cases.4,8 Recent investigations suggest that the negative results obtained by PCR may be attributable to extremely low amounts of provirus genetic material in the lymphocytes of infected animals. Several authors have reported the existence of so-called defective proviruses, whose genomes comprise large deletions, in the tissues of infected animals.12 Consequently, the diagnosis in such cases may be
544
Brief communications
Table 2. Results of the use of 2 primer pairs to amplify provirus DNA from leucocytes of BLV-infected, ELISA-positive cattle. Cow no.
1 2 3 4 5 6 7 8 9 10 11 12 13 14 15 16 17 18 19 20 21 22 23 24 25 26 27 28 29 30 31 32 33 34 35 36 37 38 39 40 41 42 43 44 45 46 47 48 49 50 51 52 53 54 55 56 57 58 59 60
OL-1/2
OL-3/4
1 1 1 1 1 1 1 1 1 1 1 1 1 1 2 1 2 1 1 1 1 1 1 1 1 1 1 1 1 1 2 1 1 1 1 2 1 2 1 2 1 1 1 1 1 1 1 1 1 1 1 1 2 1 1 1 1 1 1 1
1 1 1 1 1 1 1 1 1 2 1 1 1 1 2 1 1 1 1 1 1 1 1 1 1 1 1 1 1 1 1 1 1 1 1 2 1 1 1 1 1 1 1 1 1 1 1 1 1 1 1 1 2 1 1 1 1 1 1 1
Table 2.
Continued.
Cow no.
OL-1/2
OL-3/4
61 62 63 64 65 66 67 68 69 70 71 72 73 74 75 76 77 78 79 80 81 82 83 84 85 86 87 88 89 90 91 92 93 94 95 96 97 98 99 100 101 102 103 104 105 106 107 108 109 110 111 112 113 114
1 1 1 2 2 1 1 1 2 1 1 1 1 1 1 1 2 1 2 1 1 1 1 1 1 1 2 1 1 1 1 1 1 1 1 1 1 1 1 1 1 2 2 1 1 1 1 1 2 1 1 1 1 1
1 1 1 2 2 1 1 1 2 1 1 1 1 1 1 1 1 1 2 1 1 2 1 1 1 1 1 1 1 1 1 1 1 2 1 1 1 1 1 1 1 1 2 1 1 1 1 1 2 1 1 1 1 1
difficult. Another explanation for negative results of PCR assays in ELISA-positive animals may be the genetic variability of the virus. The lack of complementarity between the 39 end of primer and a target template produces negative results because PCR amplification does not occur.13 Re-
Brief communications
545
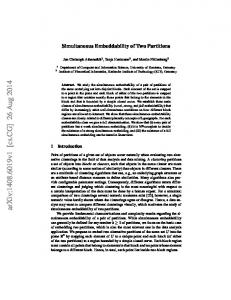
Figure 1. Agarose gel electrophoresis of 15-ml amplification products of bovine leucocyte DNA with 2 primer sets (OL-1/OL-2 and OL-3/OL-4). Most lanes show both amplification products (444 and 364 bp). In lanes 2, 5, 12, and 16, only the 444-bp product is visible and in lane 14, only the 364-bp product is visible. In lane 9, there is no amplification, Lane 1 5 DNA standard (l EcoRI and HindIII digest); lane 17 5 DNA standard (100-bp ladder).
cent studies have shown that the use of PCR with 2 primer sets to detect BLV in bovine blood samples from distant geographic regions produced different results.9 The proportion of PCR-positive results varied from 50% to 90%, depending on the primer set from the vicinity of the BLV gag gene.9 Considering the law level of plasticity in BLV,18 genetic variation may be responsible for only part of such large divergences is sensitivity. The method of primer selection is also important. The purpose of this study was to compare the efficiency of the PCR assay using primers selected from regions of the BLV genome other than gag. The PCR reaction was performed in a single tube reaction with 2 sets of primers simultaneously. The study involved 114 cows from 3 farms. The 20-mer and 22-mer oligonucleotides from the env and gag region of the BLV genome were used as primers (Table 1). Lymphocyte DNA used in PCR was purified according to the standard lysis protocol.17 The composition of PCR mixture (50 ml) was 103 polymerase buffer,a 1.5 mM MgCl2, 0.5 mM of each primer, 1 mM dNTP, and 2 units of polymerase.a About 0.5 mg of DNA and 2 drops of mineral oil were added to the reaction mixture. Amplification was performed in a programmed thermal cyclerb and started with denaturation at 94 C for 3 minutes followed by 30 cycles of denaturation at 94 C for 1 minute, primer annealing at 65 C, and elongation at 72 C for 90 seconds. Amplification was terminated with a 7-minute elongation. The oligonucleotides used in PCRs were synthesized using an automatic apparatus.c Specificity of PCR assay was confirmed using the following cells and cell lines as a source of template DNA: lymphocytes of cows from a BLV-free herd (negative by ELISA)d and an FLK cell line infected persistently with BLVe were applied as negative
and positive controls, respectively. A primary culture of the kidney cells of cows infected with the bovine parainfluenza3 virus (PI-3) and Madin Darby bovine kidney cell lines infected with a bovine herpervirus (BHV-1, strain IPV 468)f and with bovine acquired immunodeficiency virus (BIV, strain R29)e were also used. Specificity of PCR assay was also confirmed by Southern blot hybridization of amplified DNA using a previously constructed molecular probe15 followed by autoradiography. The results are summarized in Table 2 and in Fig. 1. A total of 114 DNA samples from cows positive by ELISA were examined using 2 pairs of primers simultaneously. The yield of amplification of PCR products was similar in most cases for both primer pairs, but differences occasionally were observed (Fig. 1). In a few cases, only 1 amplification product was evident (Fig. 1, Table 2). Eight samples (7%) revealed negative results by the 2 primer pairs. PCRs with the OL-1/OL-2 pair produced 86.8% positive results (99 animals), whereas PCRs with the OL-3/OL-4 pair produced 90.4% positive results (Table 2). Lack of amplification observed in 7 samples using the OL-1/OL-2 pair did not affect the positive results obtained with the OL-3/OL-4 pair. Moreover, 3 samples considered negative with OL-3/OL-4 were positive with OL-1/OL-2 (Table 2). The 2 primer pairs used together produced a higher percentage of positive results than did either pair used separately. Simultaneous amplification with 2 primer pairs was used to increase the sensitivity of the PCR assay for detection of BLV infection. In only 1 other report, describing an investigation of DNA samples from BLV-infected cattle originating from various geographic regions, did the authors find markedly different results in relation to the primer pairs
546
Brief communications
used.9 The cows were examined 3 times using a different primer pair from the gag region of the BLV genome each time. The extent of divergent results obtained, is surprising in the context of the accepted low variability of the BLV genome.18 These findings indicate that genetic variability may be significant for diagnosis using this method. However, the possible influence of the components of the amplification reaction itself on the final result was not considered. Proper selection of primers for use in the PCR is critical for objective diagnosis, and even if a particular gene is considered to be a highly conserved9 the existence of small internal regions susceptible to mutations cannot be ignored. Simultaneous amplification in 1 tube with 2 primer pairs originating from different BLV genes minimizes the possible influence of mutations on the results of the PCR assay. The probability of simultaneous occurrence of mutations in the virus genome in 2 different regions binding the primers is much lower than that in only 1 region. An additional advantage of this modification is the aspect of an internal control, where 1 primer pair act as the control for the other. Lack of 1 band and the simultaneous occurrence of the other is not regarded as a negative result but indicates the presence of a mutation in examined DNA. In conventional PCR with 1 primer pair, presence of mutation in the target sequence can be responsible for the negative result. The theoretical influence of primer selection on the PCR results was supported by the results of this study. The percentage of PCR-positive cows in the 2-primer-pair assay was 93%, a percentage higher than that produced by each primer pair alone, i.e., 86.9% for OL-1/OL-2 and 90.4% for OL-3/ OL-4. The sequence of the env gene is highly conserved.14 In the present experiment the OL-3 and OL-4 primers originating from the gag gene region were more sensitive. The results indicate that the criteria commonly used to select these primers, such as high conservatism of the sequence and the lack of complementarity between sense and antisense primers at the 39 end, do not eliminate false-negative results in PCR caused by the target template mutations. Comparison of molecular clones of BLV from different parts of the world confirms the existence of considerable sequence variation between different isolates.3,16 In addition to the genetic variability, the discrepancies of the PCR results obtained using different primer pairs can be attributed to the secondary structure of template DNA, formation of stable hairpin-loop structures, the presence of compressed regions, or a high content of C and G nucleotides in the fragments amplified.7,10 The results obtained by the simultaneous use of 2 primer pairs from different regions of BLV genome stresses the significance of genetic variability in the diagnosis of enzootic leukemia in cattle. The modified PCR gives better diagnostic results than the conventional single-pair amplification. Occurrence of a relatively high percentage (up to 6.8%) of serologically negative and PCR-positive animals emphasizes the diagnostic importance of PCR.4,8 The PCR assay will certainly not replace the serologic tests, which are less expensive and more convenient for large-scale screening, but PCR can be used as a supplementary diagnostic method for examination of highly valuable animals, e.g., breeding animals, that may be suspected as BLV carriers.
Acknowledgements. We thank Dr. M. J. Van der Maaten, National Animal Disease Center, USDA, Ames, IA, for supplying the MDBK/BIV and FLK/BLV cell lines. This study was supported in part by grant MR/USDA-97-294 from the Maria Sklodowska-Curie Fund.
Sources and manufacturers a. b. c. d. e. f.
PrimeZyme, Biometra, Go¨ttingen, Germany. Perkin-Elmer Corp., Norwalk, CT. Gene-Assembler-plus, Pharmacia Biotech, Uppsala, Sweden. IDEXX Laboratories. National Animal Disease Center, USDA, Ames, IA. National Veterinary Research Institute, Pulawy, Poland.
References 1. Brandon R, Naif H, Daniel R, Lavin M: 1991, Early detection of bovine leukosis virus DNA in infected sheep using the polymerase chain reaction. Res Vet Sci 50:89–94. 2. Burny A, Cleuter Y, Kettmann R, et al.: 1990, Bovine leukemia: facts and hypotheses derived from the study of an infectious cancer. In: Retrovirus biology and human disease, ed. Gallo R, Wong S, pp. 9–25. Marcel Dekker, New York, NY. 3. Coulson J, Naif H, Brandon R, et al.: 1990, Molecular cloning and sequencing of an Australian isolate of proviral bovine leukaemia virus DNA: comparison with other isolates. J Gen Virol 71:1737–1746. 4. Eaves F, Molloy J, Dimmock C, Eaves L: 1994, A field evaluation of the polymerase chain reaction procedure for the detection of bovine leukaemia virus proviral DNA in cattle. Vet Microbiol 3:313–321. 5. Eloit M, Kuzmak J, Dheiller J, et al.: 1990: Comparison of performances of four ELISA kits in the detection of BLV antibodies in bulk tank milk or concentrated lactoserum from herds with low prevalence of infection. Biologicals 18:55–59. 6. Ferrer JF, Marshak R, Abt A, Kenyon S: 1979, Relationship between lymphosarcoma and persistent lymphocytosis in cattle: a review. J Am Vet Med Assoc 175:705–708. 7. Innis M, Myambo K, Gelfand D, et al.: 1988, DNA sequencing with Thermus aquaticus DNA polymerase and direct sequencing of polymerase chain reaction-amplified DNA. Proc Natl Acad Sci USA 85:9436–9440. 8. Jacobs R, Song Z, Poon H, et al.: 1992, Proviral detection and serology in bovine leukemia virus-exposed normal cattle and cattle with lymphoma. Can J Vet Res 56:339–348. 9. Marsolais G, Dubuc R, Bergeron J, et al.: 1994, Importance of primer selection in the application of PCR technology to the diagnosis of bovine leukemia virus. J Vet Diagn Invest 6:297– 301. 10. McConlogue L, Brow M, Innis M: 1988, Structure-independent DNA amplification by PCR using 7-deaza-29-deoxyguanozine. Nucleic Acids Res 16:9869. 11. Naif H, Brandon R, Daniel R, Lavin M: 1990, Bovine leukaemia proviral DNA detection in cattle using the polymerase chain reaction. Vet Microbiol 25:117–129. 12. Ogawa Y, Sagata N, Tsuzuko-Kawamura J, et al.: 1987, Structure of a defective provirus of bovine leukemia virus. Microbiol Immunol 31:1009–1015. 13. Petruska J, Goodman M, Boosalis M, et al.: 1988, Comparison between DNA melting thermodynamics and DNA polymerase fidelity. Proc Natl Acad Sci USA 85:6252–6256. 14. Portetelle D, Couez D, Bruck C, et al.: 1989, Antigenic variants of bovine leukemia virus (BLV) are defined by amino acid substitutions in the NH2 part of the envelope glycoprotein gp51. Virology 169:27–33.
Brief communications
15. Reichert M, Grundboeck-Jusko J: 1991, Molecular cloning of provirus DNA from bovine leukaemia lymphocytes and its application as a probe for diagnostic purpose. Acta Biochim Pol 38:1. 16. Sagata N, Yasunaga T, Tsuzuku-Kawamura J, et al.: 1985, Complete nucleotide sequence of the genome of bovine leukemia virus: its evolutionary relationship to other retroviruses. Proc Natl Acad Sci USA 82:677–681. 17. Sambrook J, Fritch EF, Maniatis T: 1989, Molecular cloning, a
547
laboratory manual, 2nd ed., pp. 9.31–9.56. Cold Spring Harbor Laboratory Press, Cold Spring Harbor Laboratory Press, Cold Spring Harbor, NY. 18. Willems L, Thienpont E, Kerkhofs P, et al.: 1993, Bovine leukemia virus, an animal model for the study of intrastrain variability. J Virol 67:1086–1089. 19. Wu M, Shanks R, Levin A: 1989, Milk and fat production in dairy cattle influenced by advanced subclinical bovine leukemia virus infection. Proc Natl Acad Sci USA 86:993–996.
J Vet Diagn Invest 11:547–549 (1999)
Comparison of two commercial enzyme-linked immunosorbent assays for the detection of antibodies against Mycoplasma hyopneumoniae and correlation with herd status K. Levonen, E. Sihvo, P. Veijalainen Mycoplasma hyopneumoniae infection, swine enzootic pneumonia, causes considerable losses to the pig farming industry as a result of growth retardation and a prolonged fattening period. The infection often exists subclinically in breeding herds, from which the infectious agent spreads to the finishing units. The main problem in the control of enzootic pneumonia has been the lack of accurate laboratory tests. Isolation of the agent is difficult because M. hyopneumoniae multiplies poorly in artificial media, and detection often fails due to the treatment of sick animals with antibiotics. Diagnosis is usually based mainly on clinical signs and pathologic findings. Serologic enzyme-linked immunosorbent assays (ELISAs) have recently been evaluated and are sensitive and specific in detecting subclinical enzootic pneumonia.1,3,9 Two commercial ELISAs for the detection of M. hyopneumoniae antibodies from serum and from sow colostrum have been introduced, a direct ELISA (d-ELISAa) with a Tween-20-solubilized crude antigen2,8 and a competitive or blocking type ELISA (c-ELISAb) with monoclonal antibody reagents.4 The d-ELISA, which was the first test to become commercially available, has been used for determining the disease status in Finnish elite breeding herds. However, this ELISA, although sensitive and specific, occasionally gives false-positive reactions. A positive finding leads to the quarantine of the pig farm until the disease situation has been defined, which usually requires successive sampling of the herd. The transport and sale of swine and piglets is prohibited during the investigation, causing financial losses to the owner. After the introduction of the c-ELISA, which has a reaction principle different from that of the d-ELISA, it seemed possible, using these 2 different tests, to divide the samples into categories of true positives and false posFrom the National Veterinary and Food Research Institute, Virology Unit, PO Box 368, FIN-00231 Helsinki, Finland. Received for publication July 23, 1997.
itives. In this study, the 2 ELISAs were evaluated with respect to their ability to complement each other. The sensitivity and specificity of the 2 ELISAs were compared, and the effect of repeated freezing and thawing of samples on the test results was determined using the d-ELISA. The samples for the study were selected from colostrum samples taken from the elite breeding herds (n 5 185) participating in the Finnish Pig Health Scheme. The herds are annually surveyed for clinical signs and pathologic changes caused by mycoplasma pneumonia, Actinobacillus pleuropneumoniae pneumonia, atrophic rhinitis, swine dysentery, and Clostridium perfringens type C enteritis. Furthermore, colostrum samples (n 5 6,256) were collected and assayed for M. hyopneumoniae antibodies using d-ELISA. During the surveillance, doubtful or positive serologic reactions to M. hyopneumoniae were detected on 23 farms. The samples for the present study were obtained from 3 farms where pigs had symptoms typical of enzootic pneumonia and from 4 farms where animals were without symptoms and usually only a single pig was consistently positive in successive serologic tests. A total of 153 colostrum samples from the 7 farms were assayed during the study. The reproducibility of d-ELISA results was determined using 60 colostrum samples and 20 serum samples, which were assayed twice. Between the assays, the samples were frozen and thawed to determine whether these processes have any effect on the outcome of the d-ELISA. Colostrum samples were collected on the farms within 2 hours after farrowing and were sent frozen to the laboratory. Before assaying, the samples were thawed and centrifuged for 6 minutes at 10,000 3 g, and the cream was discarded.c The basic principles on which the d-ELISA and c-ELISA are based are different. The d-ELISA is a so-called sandwich immunoassay. Diluted porcine sera or colostrum samples (1: 100) were added to the microtiter wells coated with M. hyopneumoniae antigen. After incubation, the plate was washed