Stephen G. Brickley, Stuart G. Cull-Candy, and Mark Farrant .... Council. We thank Stephen Traynelis, David Colquhoun, and Ioana Vais for ...... globus pallidus.
The Journal of Neuroscience, April 15, 1999, 19(8):2960–2973
Single-Channel Properties of Synaptic and Extrasynaptic GABAA Receptors Suggest Differential Targeting of Receptor Subtypes Stephen G. Brickley, Stuart G. Cull-Candy, and Mark Farrant Department of Pharmacology, University College London, London WC1E 6BT, United Kingdom
Many neurons express a multiplicity of GABAA receptor subunit isoforms. Despite having only a single source of inhibitory input, the cerebellar granule cell displays, at various stages of development, more than 10 different GABAA subunit types. This subunit diversity would be expected to result in significant receptor heterogeneity, yet the functional consequences of such heterogeneity remain poorly understood. Here we have used single-channel properties to characterize GABAA receptor types in the synaptic and extrasynaptic membrane of granule cells. In the presence of high concentrations of GABA, which induced receptor desensitization, extrasynaptic receptors in outside-out patches from the soma entered long-lived closed states interrupted by infrequent clusters of openings. Each cluster of openings, which is assumed to result from the repeated activation of a single channel, was to one of three main
conductance states (28, 17, or 12 pS), the relative frequency of which differed between patches. Such behavior indicates the presence of at least three different receptor types. This heterogeneity was not replicated by individual recombinant receptors (a1b2g2S or a1b3g2S ), which gave rise to clusters of a single type only. By contrast, the conductance of synaptic receptors, determined by fluctuation analysis of the synaptic current or direct resolution of channel events, was remarkably uniform and similar to the highest conductance value seen in extrasynaptic patches. These results suggest that granule cells express multiple GABAA receptor types, but only those with a high conductance, most likely containing a g subunit, are activated at the synapse. Key words: cerebellar granule cell; GABAA receptor; synaptic; single channel; subunit heterogeneity; differential targeting
GABA is the principal inhibitory neurotransmitter in the CNS, acting on ionotropic GABAA receptors and metabotropic GABAB receptors. GABAA receptors are heteropentamers formed from multiple subunit types. To date, nineteen different mammalian subunit genes have been described (a1– 6, b1– 4, g1–3, d, e, p, and r1–3), with f urther diversity arising from alternative splicing. E xcept for the r subunits, which assemble independently, and the p subunit, which occurs outside the C NS, GABAA receptors can be formed from a pool of some 20 different subunits, inclusive of splice variants (for review, see Barnard et al., 1998). Many neurons express multiple subunit types (Laurie et al., 1992; Wisden et al., 1992) and would be expected to display significant receptor heterogeneity, even allowing for restrictions governing subunit assembly (Connolly et al., 1996a; McKernan and Whiting, 1996). Numerous studies of recombinant receptors have shown that the biophysical and pharmacological properties of GABAA receptors depend critically on their subunit composition (for review, see Macdonald and Olsen, 1994), yet the functional consequences of receptor multiplicity remain poorly understood. For a number of transmitters, it has been suggested that distinct receptor subtypes may be targeted to specific regions of the neuronal membrane, possibly enabling cells to respond in different ways to the same transmitter. For GABAA receptors,
specific targeting mechanisms have been proposed (Connolly et al., 1996b; Fritschy et al., 1998). Furthermore, immunohistochemical studies have provided direct evidence for segregation of subunit proteins within individual neurons (Koulen et al., 1996; Nusser et al., 1996, 1998; Fritschy et al., 1998). Cerebellar granule cells express a particularly wide range of GABAA subunits, despite having a relatively simple morphology and receiving most of their inhibitory input from one cell type. Granule cells originate from progenitors in the external germinal layer, from where they migrate through the molecular layer, past the Purkinje cells, to take up their final positions in the internal granule cell layer. Here they receive GABA-mediated inhibitory input from Golgi cells (Eccles et al., 1967; Bisti et al., 1971; Ha´mori and Taka ´cs, 1989). In the rat, these processes take place during the first 3 postnatal weeks. In situ hybridization and immunohistochemical data indicate that granule cells express, at various developmental stages, more than 10 different GABAA subunits (for review, see Wisden et al., 1996). Indeed, even before synapse formation, granule cells in the external germinal layer contain mRNA for five subunits (a2 , a3 , b3 , g1 , and g2 ) (Laurie et al., 1992; Zdilar et al., 1992), and whole-cell patch-clamp recordings have shown that they express functional GABAA receptors (Farrant et al., 1995). In this study, we have sought to determine whether this diversity of subunit expression is reflected in the functional properties of synaptic and extrasynaptic GABAA receptors. Specifically, we have examined the singlechannel properties of GABAA receptors in granule cells before and immediately after synapse formation. Our results suggest that granule cells express multiple GABAA receptor types, but possess mechanisms capable of differentially targeting these receptors, such that only a selected subset is incorporated into the postsynaptic membrane.
Received Nov. 5, 1998; revised Feb. 3, 1999; accepted Feb. 5, 1999. This research was supported by the Wellcome Trust and the Medical Research Council. We thank Stephen Traynelis, David Colquhoun, and Ioana Vais for providing software; Christopher Connolly, Bernie McDonald, and Stephen Moss for providing GABAA subunit clones and transfected HEK-293 cells; and Michael Ha¨usser, Z oltan Nusser, Angus Silver, Geoff Swanson, and David Wyllie for comments on this manuscript. Correspondence should be addressed to Dr. Mark Farrant, Department of Pharmacology, University College London, Gower Street, London WC1E 6BT, UK. Copyright © 1999 Society for Neuroscience 0270-6474/99/192960-14$05.00/0
Brickley et al. • Synaptic and Extrasynaptic GABAA Receptors
MATERIALS AND METHODS Cerebellar slices. Recordings were made from both premigratory and postmigratory cerebellar granule cells (external germinal layer and internal granular layer, respectively) in parasagittal slices (250 mm) obtained from 7-d-old (P7) Sprague Dawley rats. Slices were prepared and maintained as described previously (Farrant and Cull-C andy, 1991; Farrant et al., 1994). In brief, the animal was decapitated, and the brain was rapidly removed and placed in ice cold “slicing” solution composed of (in mM): NaC l 125, KC l 2.5, C aC l2 1, MgC l2 4, NaHC O3 26, NaH2PO4 1.25, glucose 25, pH 7.4, when bubbled with 95% O2 and 5% C O2. Slices were cut from the cerebellar vermis with a moving blade microtome (DTK1000; Dosaka EM, Kyoto, Japan) and incubated at 30°C for ;1 hr before being transferred to the recording chamber of a fixed-stage microscope (Axioskop-FS; Z eiss, Welw yn Garden C ity, UK). E xpression of recombinant GA BAA receptors. Human embryonic kidney 293 cells (H EK-293 cells; ATCC CRL 1573) were cultured in DM EM / Ham’s F-12 medium (Life Technologies, Gaithersburg, MD) supplemented with 10% fetal bovine serum. Transfections of murine a1 , b2 , b3 , and g2S GABAA receptor subunit cDNAs (within a cytomegalovirus promotor-based mammalian expression vector) were performed using a standard electroporation procedure (Gene Electropulser II; Bio-Rad, Hercules, CA) with 10 mg of total plasmid DNA. The subunits were tagged with the 10 amino acid 9E10 epitope from c-myc to allow independent verification of surface expression by means of antibody staining (Connolly et al., 1996a). Receptors incorporating 9E10-tagged subunits produce GABA-activated responses, which are indistinguishable from receptors composed of wild-type subunits (Connolly et al., 1996a; McDonald et al., 1998). C ells were co-transfected with cDNA for the cell-surface marker protein CD8 and used for recording 24 hr after transfection. Approximately 10 min before recording, cells were exposed to polystyrene beads coated with an antibody to CD8 (Dynal, Great Neck, N Y) at a concentration of 1 mg /ml, allowing visual detection of transfected cells. Solutions and drugs. During recording, cerebellar slices and H EK-293 cells were continuously perf used at room temperature (23–25°C) with a solution containing (in mM): NaC l 125, KC l 2.5, C aC l2 2, MgC l2 1, NaHC O3 26, NaH2PO4 1.25, glucose 25, pH 7.4 when bubbled with 95% O2 and 5% C O2. For whole-cell and outside-out patch recording, the pipette solution (intracellular solution) contained (in mM): C sC l 140, NaC l 4, C aC l2 0.5, H EPES 10, EGTA 5, Mg-ATP 2, adjusted to pH 7.3 with C sOH. The following drugs were added to the external solution as indicated: D-2-amino-5-phosphonopentanoic acid (AP5; Tocris Cookson, Bristol, UK), bicuculline methobromide (Research Biochemicals, Natick, M A), SR-95531 (Research Biochemicals), strychnine (Sigma, Poole, UK), tetrodotoxin (TTX; Sigma), and 6-cyano-7-nitroquinoxaline-2,3dione (C NQX; Tocris Cookson). Recording procedures. Standard whole-cell and outside-out voltageclamp recordings were made using Axopatch-1D and Axopatch-200A amplifiers (Axon Instruments, Foster C ity, CA). C ells were visualized with Nomarski differential interference optics (403 water-immersion objective, total magnification 320 –10003). Patch pipettes were pulled from thick-walled borosilicate glass (GC -150F; C lark Electromedical, Pangbourne, UK), coated with Sylgard resin (Dow Corning 184), and fire-polished to a resistance of ;10 MV. Data acquisition and anal ysis. Granule cell capacitance (3.7 6 0 0.4 pF), input resistance (9.9 6 1.8 GV), and series resistance (39.9 6 6.0 MV) were determined in a subset of cells (n 5 14) from current transients recorded in response to 10 mV hyperpolarizing voltage steps. These currents were low-pass-filtered at 20 kHz (23 dB, eight-pole Bessel-type filter) and digitized at 200 kHz (Intel 80486-based personal computer, Digidata 1200 interface and pCL AM P 6.1 software; Axon Instruments). In other recordings, cell parameters were determined directly from the amplifier settings; no series resistance compensation was used. All other data were recorded on digital audio tape [DTR-1204; BioL ogic, C laix, France (DC to 20 kHz)] with the amplifier filter (fourpole Bessel type) set at 10 kHz. Single-channel currents in outside-out patches. GABA-activated singlechannel currents recorded from outside-out patches were replayed from tape filtered at 1 kHz and digitized at 10 kHz. To determine the slope conductance of the channels, recordings were made at three to five potentials between 240 and 280 mV; all-point amplitude histograms were constructed from openings at each potential (Fetchan; pCL AM P 6.1). The mean single-channel current, determined from Gaussian fits to these amplitude distributions, was plotted against voltage, and the data were fitted by linear regression. In the case of multiple conductance levels
J. Neurosci., April 15, 1999, 19(8):2960–2973 2961
within a single patch, all current–voltage data were fitted simultaneously with the constraint of a common reversal potential. Individual clusters of openings, separated by at least 1 sec, were extracted from the digitized record for f urther analysis. The probability of the channel being open during each cluster (Po ) was calculated according to Po 5 cluster integral /(cluster length 3 cluster main amplitude), where the main amplitude for each cluster was calculated from the all-point amplitude histogram (Colquhoun and Ogden, 1988; Newland et al., 1991). The baseline was taken as the mean of the current value at the beginning and end of each cluster. Single-channel currents were also analyzed using the method of time course fitting (Colquhoun and Sigworth, 1995) (EK DIST; http:// w w w.ucl.ac.uk / Pharmacology/dc.html). Currents were replayed from tape, filtered at 2 kHz, and digitized at 20 kHz (CED 14011 interface; C ambridge Electronic Design, C ambridge, UK). Individual openings were fitted by the step response f unction of the recording system; only openings longer than two filter rise times (reaching 98.8% of their f ull amplitude) were included. The mean amplitude levels of single-channel currents were determined from fits of Gaussian distributions to the cursor-fitted amplitudes. Channel open periods are given as the weighted time constants of exponential f unctions fitted to the distributions of open periods. Distributions were fitted by the method of maximum likelihood (Colquhoun and Sigworth, 1995). Conductance values for single-channel events are given as slope conductance where measured, or as chord conductances (gchord ) at single potentials, determined according to gchord 5 i/(Vcmd 2 Erev ), where i is the observed single-channel current, Vcmd the command voltage, and Erev the reversal potential. Erev was taken as 10.94 mV, the mean value measured from current–voltage relationships in 13 outside-out patches from internal granule cells. Spontaneous IPSCs. For analysis of I PSC s, currents were replayed from tape and filtered at 5 or 2 kHz before digitization at 40 or 10 kHz, for measurement of rise and decay times, respectively. I PSC s were identified by eye from the digitized records and were analyzed using software (“N” v1.0) written by Stephen Traynelis (Emory University, Atlanta, GA). Current decays were fitted using either “N” or Origin 4.10 (Microcal, Northampton, M A). Nonstationar y fluctuation anal ysis. To determine the conductance of synaptic GABAA channels, I PSC s were analyzed by nonstationary fluctuation analysis. To isolate fluctuations in the current decay attributable to stochastic channel gating, the mean waveform was scaled to the peak of individual I PSC s (Traynelis et al., 1993; Silver et al., 1996). The requirements for such analysis include the stability of current decay time course throughout the recording and the absence of any correlation between decay time course and peak amplitude. The relationship between the peak-scaled variance and the mean current is given by r2PS 5 iI# 2 I# 2/NP 1 r2B, where r2PS is the peak-scaled variance, I# is the mean current, i is the weighted-mean single-channel current, NP is the number of channels open at the peak of the I PSC, and r2B is the background variance. In these experiments I PSC s were analyzed from selected epochs in each of 10 cells (25–214 I PSC s) in which the peak amplitude was stable over time and in which there was no correlation between current decay (62% decay time) and peak amplitude ( p . 0.05, Spearman rank-order correlation test). Although the relationship between r2PS and I# can be skewed if channels open for the first time after the peak of the I PSC, meaningf ul values for the weighted-mean single-channel current (i) can be obtained by analyzing the variance of the tail of the I PSC (Traynelis et al., 1993; Nusser et al., 1997; Traynelis and Jaramillo, 1998). However, in this case, the r2PS 2 I# relationships were parabolic, and there was no significant difference ( p 5 0.69; paired Student’s t test) between the estimate of i obtained from fitting the f ull parabola or its initial 50%, corresponding to the tail of the I PSC. The values reported are those from the f ull fit. When pooling the current–variance data across cells, we plotted normalized variance (r2PS 2 r2B/Imax ) against normalized current (I#/Imax ), where Imax is the peak synaptic current for each cell. Direct resolution of synaptic channels. For analysis of channel openings directly resolved in the I PSC decay, all-point amplitude histograms were constructed from individual I PSC s (filtered at 1 kHz and digitized at 5 kHz). A mixture of Gaussian distributions was fitted to the resulting histograms using a maximum likelihood fitting procedure. The amplitudes of steps in the tail of I PSC s were calculated from the inter-peak intervals in each all-point histogram. The presence of additional conductance states within the synaptic channel openings was investigated using a variant of the sublevel detection method of Patlak (1988). In this case, the digitized record was scanned with a rolling window of 9 –15 points and for all positions of the window in which the variance was below an
2962 J. Neurosci., April 15, 1999, 19(8):2960–2973
Brickley et al. • Synaptic and Extrasynaptic GABAA Receptors
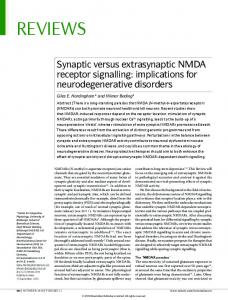
Figure 1. Activation of extrasynaptic GABAA receptors by a high concentration of GABA evokes clusters of channel openings. A, Application of 50 mM GABA (solid bar) to an outside-out patch from the somatic membrane of a P7 internal granule cell caused a large inward current that rapidly desensitized in the continued presence of agonist (holding potential 260 mV). B, Discrete single-channel clusters were separated by prolonged closed periods. C, Expansion of trace in B (open bar) showing two types of single-channel clusters that differ in their main conductances. D, Further expansion of trace in C (open bars) showing more clearly the conductance difference between the two clusters and highlighting an apparent difference in kinetic behavior. For display, records were filtered at 1 kHz. arbitrarily defined limit (typically one to two times the baseline variance), median values were calculated (Mathcad; MathSoft, C ambridge, M A) and used to construct the amplitude histogram. All results are given as mean 6 SEM. Statistical comparisons were performed with STATISTICA 5.1 (StatSoft, T ulsa OK). Differences between groups were tested using either the Student’s t test (when measures were normally distributed; Shapiro –Wilk test) or the Mann –Whitney U test and considered significant at p , 0.05.
RESULTS Extrasynaptic GABAA receptors in internal granule cells are heterogeneous The single-channel properties of cerebellar granule cell GABAA receptors have been studied previously for neurons in culture and in slices (K ilic et al., 1993; Kaneda et al., 1995; Amico et al., 1998). Although multiple conductance states have been observed in both preparations, it remains unclear whether the openings result from multiple states of a single receptor type or from different receptor types (Kaneda et al., 1995). To answer this question, we examined currents evoked by high concentrations of GABA (in a total of 22 patches recorded from 11 different animals) that were sufficient to induce marked receptor desensitization. Under these conditions, GABAA receptors enter longlived closed states, and channel openings occur in infrequent
clusters, each assumed to result from the repeated activation of a single receptor (Sakmann et al., 1980, Hamill et al., 1983; Colquhoun and Ogden, 1988; Newland et al., 1991). Therefore, if different conductance states arise from different receptor types, then their activation should give rise to distinct cluster types. In the presence of 10 mM AP5, 5 mM CNQX, and 200 nM strychnine, to block NMDA, non-NMDA, and glycine receptors, respectively, the application of 50 mM GABA to outside-out patches from granule cells in the internal granular layer resulted in a large inward current (Fig. 1 A). In the continued presence of GABA, the current slowly decayed until it was possible to resolve openings and closures of single channels (Fig. 1 B). Channel openings occurred in prolonged but infrequent clusters. However, each cluster did not necessarily open to the same main conductance state; although not always present in each patch, three distinct cluster types were observed overall. In the example shown in Figure 1, the openings within individual clusters were to one of two levels, corresponding to what we term “highconductance” and “low-conductance” events (Fig. 1C,D). Clusters of high-conductance openings were observed in all 13 patches analyzed. These had a mean slope conductance of 27.6 6 0.7 pS (Fig. 2). A “mid-conductance” cluster-type, with a mean slope conductance of 16.9 6 0.5 pS, was present in 10 of the patches.
Brickley et al. • Synaptic and Extrasynaptic GABAA Receptors
J. Neurosci., April 15, 1999, 19(8):2960–2973 2963
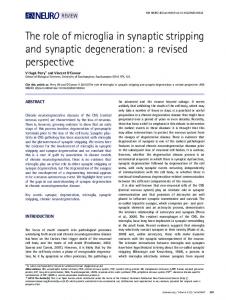
Figure 2. Patches from somatic membrane display different proportions of channel openings to three main conductance states. A, Current–voltage relationships from channels in three different patches. The lef t-hand panel illustrates data from a patch that exhibited clusters of one type, giving a slope conductance of 28 pS. The middle panel shows data from a patch in which clusters opened to one of two current levels, giving slope conductances of 28 and 17 pS. The right-hand panel shows data from a third patch in which clusters exhibited openings to one of three current levels, giving slope conductances of 26, 18, and 12 pS. B, The distribution of different cluster types between patches. High-conductance clusters (F) were recorded in all 13 patches and had a mean single-channel conductance of 27.6 pS, shown by the solid line (dotted lines indicate 61 SEM). Ten of 13 patches also contained clusters of openings that had a mid conductance (M; 16.9 pS). Four patches displayed clusters of openings that had a low conductance (Œ; 11.6 pS). Filled bars indicate the four different combinations of cluster types recorded in different patches and their relative frequency (as a percentage).
Low-conductance clusters were present in four patches and had a mean slope conductance of 11.6 6 1.2 pS. Patches could be divided into four groups according to the cluster types present (Fig. 2). The majority of patches (n 5 7) displayed high- and mid-conductance cluster types, three patches contained all three cluster types, and two patches exhibited only high-conductance clusters, whereas high- and low-conductance clusters were seen in only one patch (Fig. 2 B). Although the total length of recording for each patch differed (;1–15 min), the likelihood of observing clusters of different conductance within a given patch did not reflect any underlying difference in the frequency of opening. Thus, when present, the various cluster types occurred with similar mean frequencies (;0.06, 0.05, and 0.05 Hz, for high-, mid-, and low-conductance clusters, respectively). To test for the presence of channel subconductance states within clusters and to determine any kinetic differences between the three cluster types, we reexamined clusters of openings by the method of time course fitting (Colquhoun and Sigworth, 1995). This approach revealed that high-conductance clusters (n 5 9 patches) contained openings with a main chord conductance of 28.5 6 0.8 pS and a subconductance state of 17.4 6 1.0 pS. This
lower conductance state was present in each cluster and accounted for a consistent but relatively minor fraction of openings (10.1 6 2.6%). In all patches tested, direct transitions were observed between the main and lower conductance states. Time course fitting of the mid-conductance clusters (main state 19.9 6 1.9 pS; n 5 4) also revealed a subconductance of 10.6 pS in two patches (11.2% of openings). Low-conductance clusters were analyzed in five patches and had a single-channel conductance of 14.4 6 0.4 pS, with no apparent subconductance states. In some recordings, high-conductance clusters appeared to display briefer openings than the mid- or low-conductance clusters (Fig. 1 D). Indeed, time course fitting revealed shorter contiguous open periods in the high-conductance clusters (5.2 6 0.9 msec) compared with the mid- (6.5 6 1.2 msec) and low-conductance clusters (9.9 6 2.9 msec). This difference between high- and lowconductance openings was significant ( p , 0.05, Mann–Whitney U test). Together, the subconductance and open period data emphasize the different properties of the three cluster types. To examine the variation between clusters, we next studied all clusters individually, measuring both the main cluster conductance and the proportion of time for which the channel was open during a cluster (Po ) (Colquhoun and Ogden, 1988; Newland et
2964 J. Neurosci., April 15, 1999, 19(8):2960–2973
Brickley et al. • Synaptic and Extrasynaptic GABAA Receptors
Figure 3. Extrasynaptic receptors exhibit channel clusters that fall into distinct classes with different main conductance states and open probabilities. A, Examples of high-, mid-, and low-conductance channel clusters recorded from a single somatic patch from a P7 internal granule cell (260 mV; for display, records were filtered at 1 kHz). The integral is plotted below each current record. Shown to the right of each cluster is its corresponding all-point amplitude histogram with the calculated chord conductance and Po (see Materials and Methods). B, The distribution of all chord-conductance estimates from 310 individual clusters recorded from a total of 21 patches. The histogram was fitted with the sum of three Gaussian distributions, with peaks at 12, 17, and 28 pS (compare with the slope conductance estimates in Fig. 2). The symbols superimposed on the distribution indicate the conductance for each of the three clusters shown in A. C, The relationship between cluster main conductance and cluster Po. The distinction between low-conductance (Œ), mid-conductance (M), and high-conductance clusters (F) is based on the distribution in B and calculated by the method of minimum misclassification (Colquhoun and Sigworth, 1995). Superimposed bars indicate the mean and SD of main conductance and Po for each cluster type.
al., 1991). The main conductance state for individual clusters was obtained from the largest Gaussian component in fits to individual all-point histograms and Po values calculated after the integration of each cluster (see Materials and Methods). The clusters illustrated in Figure 3A are from a single patch that exhibited all three cluster types. The distribution of these three clusters among the entire sample is shown by the symbols in Figure 3B. As shown in Figure 3C, the high-conductance clusters exhibited a lower mean Po than the mid- and low-conductance clusters. The Po calculated for 224 high-conductance clusters (chord conductance 27.9 6 2.7 pS) was 0.6 6 0.2, whereas the mid-conductance (16.7 6 1.6 pS, n 5 92) and low-conductance (11.7 6 1.5 pS, n 5 37) clusters had identical Po values of 0.8 6 0.1. The Po value for high-conductance clusters was significantly lower that those for mid- and low-conductance clusters ( p , 0.05, Mann –Whitney U test).
Multiple receptor types are present before synapse formation One interpretation of these observations is that the clusters of openings represent activity of individual channels and the different types of clusters arise from three or more distinct receptor types with different main conductance states. Granule cells at P7
are in the early stages of synapse formation. GABA-positive Golgi axon terminals are first seen in the internal granular layer at P2–P3 (Meinecke and Rakic, 1990), whereas spontaneous IPSCs can be recorded at P4 and are present in ;70 – 80% of cells by P7 (Brickley et al., 1996; this study). The heterogeneous properties of GABAA channels that we observe at this age could therefore reflect developmental differences between cells. Indeed, it has been suggested that activation of GABAA receptors themselves, for example after synaptogenesis, may be responsible for triggering the expression of different GABAA receptor types (for review, see Carlson et al., 1998). To examine the properties of GABAA receptors before synapse formation, we recorded from premigratory cells in the external granule cell layer at P7. In patches from these cells there were also three distinct cluster types, similar to those present in postmigratory granule cells. Clusters of high-conductance openings (chord conductance 25.2 6 0.9 pS) were observed in eight of nine patches examined, mid-conductance clusters (17.0 6 0.6 pS) were present in four patches, and low-conductance clusters (12.2 6 1.4 pS) were present in three patches. A single patch contained clusters of the mid-conductance type (17 pS) alone and lacked any highconductance clusters. These results suggest, therefore, that het-
Brickley et al. • Synaptic and Extrasynaptic GABAA Receptors
J. Neurosci., April 15, 1999, 19(8):2960–2973 2965
Figure 4. Recombinant a1b2g2S receptors exhibit a single type of channel cluster. A, C lusters of channel openings recorded in an outside-out patch from an HEK-293 cell transiently transfected with a1 , b2 , and g2S subunits in the continued presence of 50 mM GABA (260 mV). All clusters contain high-conductance openings. B, An individual cluster recorded from the same patch. Inset shows an expanded view of part of the cluster (solid bar) illustrating the presence of clear sub-level transitions (for display, records were filtered at 1 kHz). The dotted lines indicate the closed, sub, and main conductance states, as determined from fits to an all-point histogram constructed for this patch (data not shown). C, The distribution of all chord-conductance estimates (main conductance) from 190 individual clusters recorded from a total of 13 patches. Most of the clusters are of the high-conductance type such that a single Gaussian adequately describes this distribution. Five cluster measurements lay outside the single Gaussian distribution. In three of these, high-conductance openings were present within the clusters, but most of the openings were to the subconductance state. D, The relationship between the cluster main conductance and the cluster Po suggests the existence of a single main population of cluster types for this recombinant GABAA receptor.
erogeneity of channel conductance is not solely the result of developmental differences between cells. The simplest explanation for our observations is that the three different cluster types arise from distinct receptor types that differ in their main conductance states. It is also possible, however, that all openings arise from a single receptor type that undergoes some form of “modal” gating to preferred conductance states that are segregated within different clusters. However, intracellular modulation of GABAA receptor activity, for example by phosphorylation, is known to influence channel kinetics but does not affect single-channel conductance (Jones and Westbrook, 1997; Amico et al., 1998). The variable frequency of occurrence of different cluster types between patches also argues against the possibility that a single receptor type is responsible for all three cluster types. However, we tested this possibility f urther by recording from a homogenous population of GABAA receptors in HEK-293 cells. These were transiently transfected with a1 , b2 , and g2S subunits, which, given their preferential coassembly, are thought to form only a single type of GABAA receptor (Angelotti and Macdonald, 1993; Tretter et al., 1997). If each cluster type in granule cells reflects a different “mode” of the same receptor rather than different receptors, then one might also expect to
record clusters with different main conductance states from a “pure” receptor population.
Recombinant GABAA receptors When patches from HEK-293 cells expressing a1 , b2 , and g2S subunits were initially exposed to 50 mM GABA, a large inward current was elicited that rapidly declined until single-channel openings could be observed. This pattern of activity was broadly similar to that seen with native receptors, and the overall cluster frequency (0.17 6 0.03 Hz, n 5 12; after four separate transfections) was not significantly different from that observed in patches from internal granule cells (0.11 6 0.02 Hz, n 5 17; p . 0.05, unpaired Student’s t test). However, unlike native receptors, each cluster of openings from recombinant receptors appeared to be to the same main conductance state (compare Fig. 4 A with 1 B). In 13 patches a sufficient number of clusters was recorded to allow construction of all-point amplitude histograms, yielding a main chord conductance of 25.9 6 0.3 pS. Clear transitions to a lower conductance state were also evident during these highconductance clusters (Fig. 4 B). In four patches this subconductance state was sufficiently frequent to be discernible from the all-point amplitude histograms (data not shown), giving a con-
2966 J. Neurosci., April 15, 1999, 19(8):2960–2973
ductance of 14.6 6 1.1 pS. We next analyzed each cluster independently (as for native receptors; see above). For 190 clusters from 13 patches, the main conductance state (the largest component of the all-point histogram) was 27.9 6 0.2 pS, and the Po value was 0.50 6 0.01 (n 5 190 clusters). These values were similar to those for the native high-conductance clusters (compare Fig. 4C,D with Fig. 3B,C). This relatively simple channel behavior was also seen with a second combination of subunits. Thus, when a transfection was performed with a b3 subunit rather than the b2 subunit, the resulting receptors also gave rise to clusters of an apparently uniform type, with a main single-channel conductance of 28.0 6 1.0 pS, a subconductance state of 17.4 6 1.9 pS (n 5 4), and a Po of 0.40 6 0.02 (89 clusters). In agreement with the impression of uniform cluster type for both a1b2g2S and a1b3g2S receptors, 286 of the 289 clusters analyzed (;99%) contained openings to the high-conductance state (Fig. 4). This is clearly different from the situation in native receptors (internal granule cells) where 107 of 310 clusters (35%) were of a mid- or low-conductance type. Taken together, these results support the idea that, for native receptors, clusters of openings with different main conductance states represent the activity of different receptor types, each having a distinct main conductance and, in the case of high- and mid-conductance types at least, a less frequently occurring subconductance state. Because recombinant GABAA receptors containing different subunits can give rise to channels with similar conductances (see above) (Macdonald and Olsen, 1994), each cluster type seen in granule cells could arise from receptors with several molecular compositions. Thus, we conclude that at least three receptor types are present in the somatic membrane of both premigratory and postmigratory granule cells. Given this diversity of extrasynaptic receptors, we next asked whether such diversity occurred at the synapse.
GABAA receptor-mediated IPSCs in cerebellar granule cells In the presence of 5 mM C NQX and 10 mM AP5, .70% of cells
(86/110, from 34 animals) exhibited spontaneous I PSC s (Fig. 5A). The reversal potential for I PSC s (18.4 6 0.6 mV, n 5 10) was close to the expected C l 2 ion equilibrium potential of 12 mV given the near symmetrical C l 2 ion distribution. The I PSCs were reversibly blocked by the competitive GABAA receptor antagonists bicuculline methobromide (10 mM) and SR-95531 (100 nM) but were unaffected by the glycine receptor antagonist strychnine (200 nM) (data not shown) (Kaneda et al., 1995). As previously reported, the I PSC s were greatly reduced in frequency by 200 nM tetrodotoxin (from ;1 Hz to ,0.1 Hz), indicating that most events result from action potentials in presynaptic Golgi cells (Kaneda et al., 1995; Brickley et al., 1996; Rossi and Hamann, 1998). For each cell, an average I PSC waveform was generated from .50 events aligned on their rising phase. Superimposed events were excluded from analysis, and we included only those IPSCs that had a monotonic rising phase lacking inflections (Fig. 5B,C) and that returned to baseline without contamination from subsequent events. As expected from the electrically compact nature of the granule cell (Silver et al., 1992; C lark et al., 1997), the majority of I PSC s had a rapid rising phase (Fig. 5C) with a 10 –90% rise time that was not correlated with peak amplitude (Fig. 5D). The average I PSC waveforms from 14 cells had a 10 –90% rise time of 372 6 19 msec and a decay best described by
Brickley et al. • Synaptic and Extrasynaptic GABAA Receptors
the sum of three exponentials (t1 5 8.0 6 1.1 msec, 22%; t2 5 33.5 6 2.4 msec, 58%; t3 5 102.9 6 8.2 msec) (Fig. 5E).
Single-channel properties of synaptic GABAA receptors estimated from fluctuation analysis To obtain an estimate of the single-channel conductance for receptors underlying the IPSC we used the method of peakscaled nonstationary fluctuation analysis (Traynelis et al., 1993; DeKoninck and Mody, 1994; Silver et al., 1996; Traynelis and Jaramello, 1998). This approach enables channel conductance to be determined from the variance of individual synaptic events about the mean synaptic waveform. For each of 10 cells, the mean waveform was scaled to the peak of each IPSC, and the mean current and its variance were determined for 30 bins of equal amplitude (Fig. 6 A). In all cases, plotting the mean current against the variance yielded a characteristic parabolic relationship. For the example shown in Figure 6 B, fitting the current– variance relationship (see Materials and Methods) gave a weighted-mean single-channel current of 1.60 pA (corresponding to a chord conductance of 22.5 pS) and a mean of 39 channels open at the peak of the IPSC. The single-channel current values from 10 cells were normally distributed (Shapiro–Wilk test), with a mean of 1.96 6 0.13 pA, corresponding to a conductance of 27.6 6 1.8 pS (Fig. 6C). Plotting the normalized variance against the normalized current (see Materials and Methods) for data pooled from all 10 cells confirmed the almost perfect parabolic relationship between mean current and variance (Fig. 6 D), suggesting that the weighted-mean conductance is the same for channels contributing to different phases of the IPSC decay.
Direct resolution of synaptic channel events In the most favorable whole-cell recordings (baseline current– variance ,330 fA 2; mean 252 6 22 fA 2; n 5 8; 1 kHz filter), the high input resistance and electrical compactness of cerebellar granule cells allowed us to resolve individual channel closures in the tail of IPSCs. This is illustrated in Figure 7A, which shows successive enlargements of the tail of an individual IPSC. For each of eight cells examined, channel-like steps could be clearly identified in the decay phase of all IPSCs, regardless of the IPSC peak amplitude (Fig. 7B). Moreover, for each of the smallest IPSCs observed, their peak was an integer multiple of the last resolvable current step. For example, in the case of the two IPSCs shown in Figure 7C, the waveforms could be divided into five and seven steps of equal amplitude. To quantify the size of the current steps, all-point amplitude histograms were constructed from individual IPSCs (Borst et al., 1994). For the IPSC shown in Figure 8 A, this revealed a series of six equally spaced peaks (inset). The first peak in the histogram corresponds to the closed level ( C), and the five subsequent peaks result from steps in the tail of the IPSC. The histogram was fitted with the sum of six Gaussian distributions, and step sizes were determined from the inter-peak intervals (1.7, 2.2, 1.9, 1.8, and 2.1 pA). In the cell from which this IPSC was recorded, the average step size determined from 47 steps in 27 individual IPSCs was 2.04 6 0.04 pA, corresponding to a single-channel chord conductance of 28.7 pS. The amplitude of these steps appeared consistent within individual IPSCs. Furthermore, the step size was consistent for different IPSCs in the same cell and for IPSCs in different cells. Figure 8 B shows data from one cell in which the step size for the final two resolvable closures (S1 and S2) was determined for 50 consecutive IPSCs. Because these spontaneous IPSCs arise from an unknown number of different synapses, it is
Brickley et al. • Synaptic and Extrasynaptic GABAA Receptors
J. Neurosci., April 15, 1999, 19(8):2960–2973 2967
Figure 5. Spontaneous IPSC s display a rapid rise and slow, multi-exponential decay. A, Continuous record showing spontaneous I PSC s recorded from a P7 internal granule cell in the presence of 5 mM C NQX, 10 mM AP5, and 200 nM strychnine (270 mV; 2 kHz filtering). B, The initial phase of some IPSCs shows obvious inflections caused by superimposition of events (asterisk s; 5 kHz filtering). C, Most I PSC s exhibit monotonic rises with no obvious inflections. Only IPSCs that exhibited such a monotonic rise were included in any f urther analysis. D, The distribution of the resulting 10 –90% rise times is well described by a single Gaussian. The inset illustrates the lack of relationship between rise time and peak amplitude for I PSC s recorded in one cell. E, An example of an averaged I PSC with its decay fitted by the sum (solid line) of three exponentials (dotted lines). The inset shows the average waveform (dots) and single ( 1), double ( 2), or triple ( 3) exponential fits (solid lines) displayed with current on a log scale; only the triple exponential fit adequately describes the current decay (2 kHz filtering).
clear that the conductance of the underlying receptors is similar not only at individual synapses but also at different synapses on the same cell. As is also apparent from Figure 8 B, the amplitudes of the last five steps (S1–S5) determined from all events were remarkably consistent. Finally, as shown in Figure 8C, the IPSC step size (calculated as a single value for each I PSC; taking a mean value when multiple steps were resolved) was normally distributed, with a low coefficient of variation (C V) (mean 1.87 6 0.02 pA, n 5 234 I PSC s, corresponding to a conductance of 26.4 pS; CV 5 0.13). A similar distribution (data not shown) was obtained when all resolved steps (n 5 480) were considered individually and had a C V of 0.17. Together these observations suggest that GABAA receptors in the synaptic membrane of granule cells have a uniform singlechannel conductance, similar to the high-conductance channels identified in the extrasynaptic membrane. As noted above, one feature of the high-conductance extrasynaptic receptors is the occasional presence of a subconductance state. If synaptic recep-
tors are similar to these extrasynaptic receptors, then they too might be expected to display a subconductance state. Indeed, in a small number of IPSCs, channel openings of an apparently lower conductance were detected in conjunction with the highconductance events. To increase the resolution of channel openings and minimize the contribution of background noise, we applied a smoothing procedure to these selected IPSCs (see Materials and Methods). This confirmed that a very small proportion of resolvable synaptic channel openings (;2%; 9 out of the total of 480) were to a distinct lower conductance level. One particularly clear example is illustrated in Figure 8 D. In the tail of this IPSC it is possible to discern a prolonged opening of lower amplitude before the final full-amplitude channel closure. This is made clearer in the smoothed waveform and its associated amplitude histogram (Fig. 8 D, insets). Openings of this type could be resolved in nine IPSCs and had a mean amplitude of 1.07 6 0.06 pA (15.1 pS), significantly lower ( p , 0.05, paired Student’s t test) than the main conductance state determined in the same IPSCs
2968 J. Neurosci., April 15, 1999, 19(8):2960–2973
Brickley et al. • Synaptic and Extrasynaptic GABAA Receptors
Figure 6. Peak-scaled nonstationary fluctuation analysis of I PSC s reveals uniform weighted-mean single-channel conductance of synaptic receptors. A, The average waveform of 74 I PSC s (solid line) is shown scaled to the peak of an individual I PSC ( gray line; 2 kHz filtering). The horizontal dotted lines represent the 30 amplitude bins used to determine values of mean current and variance. B, A plot of mean current against variance for the cell shown in A. The plot is fitted with a parabolic relationship to give the weighted-mean single-channel current (i; also given as conductance, g) and the number of channels open at the peak (Np ). The dotted line indicates the baseline variance. C, Histogram of weighted-mean single-channel current obtained from a total of 10 cells illustrating the uniform distribution of conductance. D, A plot of normalized current against normalized variance with data pooled from all 10 cells (error bars represent SEM).
(1.78 6 0.06 pA; 25.1 pS). The temporal resolution afforded by whole-cell recordings makes it difficult to say whether these openings represent true subconductance states or whether this lower level results from the opening of a separate mid-conductance GABAA receptor. Regardless of its origins, the lower conductance state contributes very little to total charge transfer during a single I PSC. Finally, it is interesting to note that individual channel openings as well as the more obvious channel closures could also be seen during the I PSC decay (Figs. 7C, 8 A). The lack of skew in the parabolic current–variance relationship (Fig. 6) suggests that few, if any, channels open for the first time after the peak of the IPSC (Traynelis et al., 1993). It would thus appear that these events reflect the reopening of GABAA receptors after their synchronous opening at the peak of the synaptic current. This delayed reopening is thought to occur on exit from desensitized states, entered after the brief exposure to high concentrations of transmitter in the cleft, and has been suggested to prolong the decay of the I PSC (Jones and Westbrook, 1995).
DISCUSSION In this study, we have examined the single-channel properties of synaptic and extrasynaptic GABAA receptors in developing cerebellar granule cells. On the basis of differences in channel conductance, we suggest that GABAA receptors in premigratory granule cells before synapse formation are heterogeneous, with at least three receptor types present. This heterogeneity is maintained in granule cells that have recently migrated and whose extrasynaptic GABAA receptors display very similar properties. By contrast, receptors at newly formed synapses open, almost exclusively, to a single, high-conductance state.
Subunit diversity and channel heterogeneity In granule cells the pattern of GABAA receptor subunit expression is developmentally regulated. In situ hybridization studies have shown that premigratory cells express a2 , a3 , b3 , g1 , and g2 subunit mRNA (Laurie et al., 1992). After migration, levels of a2 , a3 , and g1 mRNA decline, whereas levels of a1 and g2 mRNA increase dramatically. After the first postnatal week, a6 and d
Brickley et al. • Synaptic and Extrasynaptic GABAA Receptors
J. Neurosci., April 15, 1999, 19(8):2960–2973 2969
Figure 7. Unitary current steps can be resolved in the decay of spontaneous I PSC s. A, Successive enlargements (solid bars) of the decay phase of a spontaneous IPSC recorded from a P7 internal granule cell (270 mV). The second enlargement clearly shows the stepped nature of the I PSC decay (the equally spaced dashed lines illustrate the approximate amplitude levels of the steps). B, Four representative I PSC s showing the consistent presence of a channel-like step at the end of each I PSC. The peaks of the I PSC s have been truncated for display, and the dotted line indicates the pre-event baseline current. C, Two selected I PSC s, representative of the smallest events recorded. In each case the peak amplitude is an integer multiple (5 and 7) of the last step amplitude (dotted lines). For display, records were filtered at 1 kHz.
subunit expression become significant (Laurie et al., 1992; Jones et al., 1997), leading to the predominance of a1 , a6 , b2 , b3 , g2 , and d subunit mRNAs in the adult. Immunohistochemical studies of adult tissue have confirmed the presence of the corresponding proteins (Z imprich et al., 1991; Fritschy et al., 1992; Nusser et al., 1998), and a combination of techniques have suggested that at least four receptor types may be present (a1b2/3g2 , a6b2/3g2 , a6b2/3d, and a1a6b2/3g2 ) (Nusser et al., 1998). At the age we have examined (P7) it is likely that a6 and d proteins are not yet expressed; nevertheless, multiple a, b, and g subunits will be present. Thus the potential for receptor heterogeneity exists at all stages of granule cell development (for review, see Wisden et al., 1996; C arlson et al., 1998). How does this subunit diversity relate to the heterogeneity of channel conductance? The ion selectivity and conductance of GABAA receptors is determined by the presence of charged residues close to and within the second transmembrane domain
(TM2) of each subunit (Smith and Olsen, 1995). To assess the possible influence of different subunits on single-channel conductance, the primary structure of GABAA receptor subunits was compared, and the net charge for the region encompassing TM2 (between the intracellular end of TM1 and the extracellular end of TM3) was calculated for all a, b, g, and d subunits [after the approach of Fisher and Macdonald (1997)]. The g and d subunits contribute a greater net positive charge (g1 , g2 , d 14; g3 15) to this region than do any of the a or b subunits (13 and 12, respectively). It has been suggested (Fisher and Macdonald, 1997) that this difference may account for the consistent observation of a higher main conductance state for abg or abd combinations when compared directly with ab heterodimers (26 –32 pS vs 11–20 pS) (Puia et al., 1990; Verdoorn et al., 1990; Angelotti and Macdonald, 1993; Fisher and Macdonald, 1997; S. Brickley and M. Farrant, unpublished observations). Our single-channel conductance data indicate the presence of at least three different
2970 J. Neurosci., April 15, 1999, 19(8):2960–2973
Brickley et al. • Synaptic and Extrasynaptic GABAA Receptors
Figure 8. Analysis of resolvable current steps in I PSC s reveals a uniform single-channel conductance and a rare lower conductance state. A, Quantitative analysis of a stepped I PSC waveform recorded from a P7 internal granule cell (1 kHz filtering). The I PSC has five steps in its decay, seen as clearly resolved peaks in its all-point amplitude histogram (inset). The positions of the baseline ( C) and the numbered dashed lines (1–5) are taken from the fit of six Gaussian components to the amplitude histogram. B, Plots of the inter-peak step size for the last two steps (S1 and S2) calculated for 50 consecutive IPSCs recorded in the same cell as A. The bottom panel illustrates the consistency of the step size for the last five channel closures (S1–S5) recorded from a total of eight cells. The mean step sizes (open symbols) and the SD are plotted for each step. The dotted line shows the mean value for S1. C, A histogram of IPSC step size (calculated as a single value for each of 234 I PSC s recorded from 8 cells) fitted with a single Gaussian. D, A single IPSC in which different sized steps were observed in the decay (1 kHz filtering). The inset was obtained after smoothing of the trace (see Materials and Methods) to better illustrate the steps in the waveform. The dotted lines superimposed on the trace show current levels obtained from peaks of the fit to the all-point histogram. C indicates the final closed state, and the dashed lines 1–3 represent the values of the three open levels observed in the decay. The final step size was calculated from the inter-peak interval between C and 2, and the preceding smaller step size was calculated between C and 1.
receptor types in granule cells at P7. Although we cannot equate the high-, mid-, and low-conductance channels (28, 17, and 12 pS) with specific subunit combinations, it seems likely that at P7 the high-conductance openings result from receptors composed of a, b, and g subunits, whereas the lower conductance events result from receptors lacking a g subunit. The significantly lower Po values and briefer open periods of the high-conductance clusters further distinguish these receptors from those giving rise to clusters of lower conductance openings. Not only does the g subunit influence channel conductance, but it is also essential for allosteric modulation by benzodiazepines (for review, see Barnard et al., 1998). Consistent with the presence of g-containing receptors, GABA-induced currents in premigratory and postmigratory granule cells (Farrant et al.,
1995), as well as those in cultured granule cells (Mathews et al., 1994; Mellor and Randall, 1997), are potentiated by benzodiazepines. Most neurons express g subunits, and heteromeric assemblies of a, b, and g subunits are considered to be the most common form of native GABAA receptor (McKernan and Whiting, 1996). Nevertheless, it is clear that, in expression systems at least, combinations of a and b subunits can form functional receptors (Connolly et al., 1996a,b; Gorrie et al., 1997; Tretter et al., 1997). However, because of evidence for preferential coassembly of a, b, and g subunits (Angelotti and Macdonald, 1993; Tretter et al., 1997), the possible existence of native receptors formed from a and b subunits has been largely overlooked. Our data, showing the presence of both low- and high-conductance receptors in developing cerebellar granule cells, suggests an abil-
Brickley et al. • Synaptic and Extrasynaptic GABAA Receptors
J. Neurosci., April 15, 1999, 19(8):2960–2973 2971
Table 1. Single-channel chord conductance values for synaptic and extrasynaptic GABAA receptors in internal granule cells at P7 Extrasynaptic
Synaptic
High conductance
Mid conductance
L ow conductance
Nonstationary fluctuation analysis
Direct resolution
27.9 6 2.7 (n 5 224)
16.7 6 1.6 (n 5 92)
11.7 6 1.5 (n 5 37)
27.6 6 1.8 (n 5 10)
26.4 6 0.2 (n 5 480)
Conductance values are given in pS (mean 6 SEM). Data for extrasynaptic channels were obtained from analysis of individual clusters of openings (n 5 21 somatic patches). For each cluster type, the number of clusters is indicated in parentheses. The conductance value from nonstationary fluctuation analysis is from estimates of weighted-mean conductance in 10 cells. The conductance value from direct resolution of synaptic channel events is the mean of all resolvable steps in 234 I PSC s from eight cells.
ity of neurons to independently assemble either ab- or abgcontaining receptors. Moreover, these receptors appear to be targeted to different regions of the neuronal membrane.
Targeting of GABAA receptors At least three receptor types are present in the extrasynaptic membrane of granule cells, but only a high-conductance type is found at the synapse. The conductance of synaptically activated GABAA receptors was calculated by peak-scaled nonstationary fluctuation analysis and from direct resolution of channel closures in the tail of I PSC s. For several reasons, we believe that the synaptic channel is of a single type. There was a remarkable correspondence between the weighted-mean single-channel conductance obtained with fluctuation analysis and the unitary conductance determined from directly resolved channel openings. Moreover, the parabolic relationship between mean current and variance indicates that there is no difference in the weightedmean conductance of channels contributing to different phases of the IPSC decay. This was supported by the consistency of step size throughout the I PSC and by the fact that the smallest IPSCs had peak amplitudes that were integer multiples of the unitary step size. It is important to note that a single conductance state does not establish the presence of a single GABAA receptor population. In studies of recombinant receptors, all abg combinations examined so far give rise to similar high-conductance channels. For example, in this study, the substitution of a b3 for a b2 subunit did not significantly alter single-channel conductance. Nevertheless, the high conductance of the synaptic receptors (Table 1) clearly indicates that they contain a g subunit. This conclusion is supported by the fact that I PSC s at P7 are prolonged by benzodiazepines (Farrant and Brickley, unpublished observation) in a manner similar to that reported for granule cells in slightly older animals (Rossi and Haman, 1998).
Potential mechanisms of receptor targeting It has been known for some time that the g subunits are concen-
trated at many GABAA synapses (Somogyi et al., 1996). The most novel aspect of our results is the suggestion that GABAA receptors lacking a g subunit are specifically e xcluded from the synapse. In this context it is interesting to note that in adult granule cells the g subunit is found in both synaptic and extrasynaptic membrane, whereas the d subunit, which is thought to substitute for the g in some heteromeric assemblies, is found only extrasynaptically (Nusser et al., 1998). Recently, several mechanisms have been identified that may account for the differential targeting of receptors containing a g subunit. A novel microtubule-associated protein GABAR AP (GABAA-receptor-associated protein) has been identified and shown to interact preferentially with the g2 subunit, linking it to the cytoskeleton and promoting receptor
clustering (Wang et al., 1999). The protein gephyrin has also been implicated in the clustering of GABAA receptors at synaptic sites (Craig et al., 1996; Giustetto et al., 1998), and in neurons from mice lacking the g2 subunit, both GABAA receptor and gephyrin clusters are disrupted (Essrich et al., 1998). Whether either of these interactions accounts for the preferential incorporation of g-containing receptors at granule cell synapses remains to be determined. Although differential targeting of receptors is an attractive explanation for our observations, other interpretations of the data need to be considered. Recent studies suggest that the conductance of certain ligand-gated ion channels may be influenced by agonist concentration (Eghbali et al., 1998; Rosenmund et al., 1998). If this were the case, the difference in conductance of extrasynaptic and synaptic GABAA receptors could simply reflect the difference between steady-state activation of receptors in the presence of 50 mM GABA and the activation of synaptic receptors by a brief pulse of transmitter of much higher concentration. We think this is unlikely. Brief application (1 msec) of 1 mM GABA to outside-out patches from internal granule cells (P7) results in the activation of GABAA receptors with a range of conductances similar to those seen in the present steady-state experiments (our unpublished observation). As in the steady-state experiments, most of the openings are of a high-conductance type (;30 pS), but lower conductance openings are also present. Moreover, channels activated by low micromolar concentrations of GABA also display similar conductances (Kaneda et al., 1995; Amico et al., 1998). Thus, for GABAA receptors in cerebellar granule cells at least, the concentration of transmitter does not affect singlechannel conductance. Because our experiments identify only functional receptors, we cannot of course exclude the possibility that multiple receptor types are present in the postsynaptic membrane, with a specific subset being nonfunctional or “silent” (Lewis et al., 1990; Poisbeau et al., 1997).
Functional consequences of differential receptor localization Although granule cells receive synaptic input only on their distal dendrites, most of the GABAA receptor subunits are localized to proximal dendritic and somatic membrane (Nusser et al., 1995). The significance of these extrasynaptic GABAA receptors remains unclear. However, in older animals, extrasynaptic a6b2/3g2 or a6b2/3d GABAA receptors may be involved in generating a tonic conductance attributable to their activation after spillover of GABA from the synaptic cleft (Kaneda et al., 1995; Brickley et al., 1996; Tia et al., 1996; Wall and Usowicz, 1997; Nusser et al., 1998; Rossi and Haman, 1998). More speculatively, in immature cells the extrasynaptic receptors could be important in some
2972 J. Neurosci., April 15, 1999, 19(8):2960–2973
aspects of the migration and differentiation of cerebellar granule cells. The depolarizing action of GABA in developing cerebellar granule cells (Brickley et al., 1996) could underlie possible trophic roles for this transmitter system that precede its more conventional inhibitory actions (C arlson et al., 1998).
REFERENCES Amico C, Cupello A, Fossati C, Robello M (1998) Involvement of phosphatase activities in the run-down of GABAA receptor f unction in rat cerebellar granule cells in culture. Neuroscience 84:529 –535. Angelotti TP, Macdonald RL (1993) Assembly of GABAA receptor subunits: a1b1 and a1b1g2S subunits produce unique ion channels with dissimilar single-channel properties. J Neurosci 13:1429 –1440. Barnard EA, Skolnick P, Olsen RW, Mohler H, Sieghart W, Biggio G, Braestrup C, Bateson AN, Langer SZ (1998) International Union of Pharmacology. XV. Subtypes of g-aminobutyric acidA receptors: classification on the basis of subunit structure and receptor f unction. Pharmacol Rev 50:291–313. Bisti S, Iosif G, Marchesi GF, Strata P (1971) Pharmacological properties of inhibitions in the cerebellar cortex. E xp Brain Res 14:24 –37. Borst JG, Lodder JC, K its K S (1994) Large amplitude variability of GABAergic IPSCs in melanotropes from Xenopus laevis: evidence that quantal size differs between synapses. J Neurophysiol 71:639 – 655. Brickley SG, Cull-Candy SG, Farrant M (1996) Development of a tonic form of synaptic inhibition in rat cerebellar granule cells resulting from persistent activation of GABAA receptors. J Physiol (L ond) 497:753–759. Carlson BX, Elster L, Schousboe A (1998) Pharmacological and f unctional implications of developmentally-regulated changes in GABAA receptor subunit expression in the cerebellum. Eur J Pharmacol 352:1–14. Clark BA, Farrant M, Cull-C andy SG (1997) A direct comparison of the single-channel properties of synaptic and extrasynaptic NMDA receptors. J Neurosci 17:107–116. Colquhoun D, Ogden D (1988) Activation of ion channels in the frog end-plate by high concentrations of acetylcholine. J Physiol (L ond) 395:131–159. Colquhoun D, Sigworth F (1995) Fitting and statistical analysis of singlechannel records. In: Single-channel recording (Sakmann B, Neher E, eds), pp 483–587. New York: Plenum. Connolly CN, Krishek BJ, McDonald BJ, Smart TG, Moss SJ (1996a) Assembly and cell surface expression of heteromeric and homomeric g-aminobutyric acid type A receptors. J Biol Chem 271:89 –96. Connolly CN, Wooltorton JR, Smart TG, Moss SJ (1996b) Subcellular localization of g-aminobutyric acid type A receptors is determined by receptor b subunits. Proc Natl Acad Sci USA 93:9899 –9904. Craig AM, Banker G, Chang W, McGrath M E, Serpinskaya AS (1996) Clustering of gephyrin at GABAergic but not glutamatergic synapses in cultured rat hippocampal neurons. J Neurosci 16:3166 –3177. DeKoninck Y, Mody I (1994) Noise analysis of miniature I PSC s in adult rat brain slices: properties and modulation of synaptic GABAA receptor channels. J Neurophysiol 71:1318 –1335. Eccles JC, Ito M, Szenta´gothai J (1967) The cerebellum as a neuronal machine. Berlin: Springer. Eghbali M, Curmi JP, Birnir B, Gage PW (1998) Hippocampal GABAA channel conductance increased by diazepam. Nature 388:71–75. Essrich C, Lorez M, Benson JA, Fritschy JM, L u ¨scher B (1998) Postsynaptic clustering of major GABAA receptor subtypes requires the g2 subunit and gephyrin. Nat Neurosci 1:563–571. Farrant M, Cull-Candy SG (1991) E xcitatory amino acid receptorchannels in Purkinje cells in thin cerebellar slices. Proc R Soc L ond B Biol Sci 244:179 –184. Farrant M, Feldmeyer D, Takahashi T, Cull-C andy SG (1994) NMDAreceptor channel diversity in the developing cerebellum. Nature 368:335–339. Farrant M, Kaneda M, Cull-C andy SG (1995) Benzodiazepine modulation of GABA-activated currents in granule cells of the rat cerebellum. J Physiol (Lond) 498P:17. Fisher JL, Macdonald RL (1997) Single channel properties of recombinant GABAA receptors containing g2 or d subtypes expressed with a1 and b3 subtypes in mouse L929 cells. J Physiol (L ond) 505:283–297. Fritschy JM, Benke D, Mertens S, Oertel W H, Bachi T, Mohler H (1992) Five subtypes of type A g-aminobutyric acid receptors identified in
Brickley et al. • Synaptic and Extrasynaptic GABAA Receptors
neurons by double and triple immunofluorescence staining with subunit-specific antibodies. Proc Nat Acad Sci USA 89:6726 – 6730. Fritschy JM, Johnson DK , Mohler H, Rudolph U (1998) Independent assembly and subcellular targeting of GABAA receptor subtypes demonstrated in mouse hippocampal and olfactory neurons in vivo. Neurosci Lett 249:99 –102. Giustetto M, K irsch J, Fritschy JM, C antino D, Sassoe `-Pognetto M (1998) L ocalization of the clustering protein gephyrin at GABAergic synapses in the main olfactory bulb of the rat. J Comp Neurol 395:231–244. Gorrie GH, Vallis Y, Stephenson A, Whitfield J, Browning B, Smart TG, Moss SJ (1997) Assembly of GABAA receptors composed of a1 and b2 subunits in both cultured neurons and fibroblasts. J Neurosci 17:6587– 6596. Hamill OP, Bormann J, Sakmann B (1983) Activation of multipleconductance state chloride channels in spinal neurones by glycine and GABA. Nature 305:805– 808. Ha´mori J, Taka´cs J (1989) T wo types of GABA-containing axon terminals in cerebellar glomeruli of cat: an immunogold-EM study. Exp Brain Res 74:471– 479. Jones A, Korpi ER, McKernan RM, Pelz R, Nusser Z, Ma ¨kela¨ R, Mellor JR, Pollard S, Bahn S, Stephenson FA, Randall AD, Sieghart W, Somogyi P, Smith AJH, Wisden W (1997) Ligand-gated ion channel subunit partnerships: GABAA receptor a6 subunit gene inactivation inhibits d subunit expression. J Neurosci 17:1350 –1362. Jones M V, Westbrook GL (1995) Desensitized states prolong GABAA channel responses to brief agonist pulses. Neuron 15:181–191. Jones M V, Westbrook GL (1997) Shaping of I PSC s by endogenous calcineurin activity. J Neurosci 17:7626 –7633. Kaneda M, Farrant M, Cull-C andy SG (1995) Whole-cell and singlechannel currents activated by GABA and glycine in granule cells of the rat cerebellum. J Physiol (L ond) 485:419 – 435. K ilic G, Moran O, Cherubini E (1993) Currents activated by GABA and their modulation by Z n 21 in cerebellar granule cells in culture. Eur J Neurosci 5:65–72. Koulen P, Sassoe`-Pognetto M, Gru ¨nert U, Wa¨ssle H (1996) Selective clustering of GABAA and glycine receptors in the mammalian retina. J Neurosci 16:2127–2140. Laurie DJ, Seeburg PH, Wisden W (1992) The distribution of 13 GABAA receptor subunit mRNAs in the rat brain. II. Olfactory bulb and cerebellum. J Neurosci 12:1063–1076. Lewis CA, Ahmed Z, Faber DS (1990) Developmental changes in the regulation of glycine-activated C l - channels of cultured medullary neurons. Dev Brain Res 51:287–290. Macdonald RL, Olsen RW (1994) GABAA receptor channels. Annu Rev Neurosci 17:569 – 602. Mathews GC, Bolos-Sy AM, Holland K D, Isenberg KE, Covey DF, Ferrendelli JA, Rothman SM (1994) Developmental alteration in GABAA receptor structure and physiological properties in cultured granule neurons. Neuron 13:149 –158. McDonald BJ, Amato A, Connolly C N, Benke D, Moss SJ, Smart TG (1998) Adjacent phosphorylation sites on GABAA receptor b subunits determine regulation by cAM P-dependent protein kinase. Nat Neurosci 1:23–28. McKernan RM, Whiting PJ (1996) Which GABAA-receptor subtypes really occur in the brain? Trends Neurosci 19:139 –143. Meinecke DL, Rakic P (1990) Developmental expression of GABA and subunits of the GABAA receptor complex in an inhibitory synaptic circuit in the rat cerebellum. Dev Brain Res 55:73– 86. Mellor JR, Randall AD (1997) Frequency-dependent actions of benzodiazepines on GABAA receptors in cultured murine cerebellar granule cells. J Physiol (L ond) 503:353–369. Newland CF, Colquhoun D, Cull-C andy SG (1991) Single channels activated by high concentrations of GABA in superior cervical ganglion neurones of the rat. J Physiol (L ond) 432:203–233. Nusser Z, Roberts JDB, Baude A, Richards JG, Somogyi P (1995) Relative densities of synaptic and extrasynaptic GABAA receptors on cerebellar granule cells as determined by a quantitative immunogold method. J Neurosci 15:2948 –2960. Nusser Z, Sieghart W, Benke D, Fritschy JM, Somogyi P (1996) Differential synaptic localization of two major g-aminobutyric acid type A receptor alpha subunits on hippocampal pyramidal cells. Proc Natl Acad Sci USA 93:11939 –11944. Nusser Z, Cull-C andy S, Farrant M (1997) Differences in synaptic
Brickley et al. • Synaptic and Extrasynaptic GABAA Receptors
GABAA receptor number underlie variation in GABA mini amplitude. Neuron 19:697–709. Nusser Z, Sieghart W, Somogyi P (1998) Segregation of different GABAA receptors to synaptic and extrasynaptic membranes of cerebellar granule cells. J Neurosci 18:1693–1703. Patlak JB (1988) Sodium-channel subconductance levels measured with a new variance-mean analysis. J Gen Physiol 92:413– 430. Poisbeau P, Williams SR, Mody I (1997) Silent GABAA synapses during flurazepam withdrawal are region-specific in the hippocampal formation. J Neurosci 17:3467–3475. Puia G, Santi MR, Vicini S, Pritchett DB, Purdy RH, Paul SM, Seeburg PH, Costa E (1990) Neurosteroids act on recombinant human GABAA receptors. Neuron 4:759 –765. Rosenmund C, Stern-Bach Y, Stevens CF (1998) The tetrameric structure of a glutamate receptor channel. Science 280:1596 –1599. Rossi DJ, Hamann M (1998) Spillover-mediated transmission at inhibitory synapses promoted by high affinity a6 subunit GABAA receptors and glomerular geometry. Neuron 20:783–795. Sakmann B, Patlak J, Neher E (1980) Single acetylcholine-activated channels show burst-kinetics in presence of desensitizing concentrations of agonist. Nature 286:71–73. Silver RA, Traynelis SF, Cull-C andy SG (1992) Rapid-time-course miniature and evoked excitatory currents at cerebellar synapses in situ. Nature 355:163–166. Silver RA, Cull-Candy SG, Takahashi T (1996) Non-NMDA glutamate receptor occupancy and open probability at a rat cerebellar synapse with single and multiple release sites. J Physiol (L ond) 494:231–250. Smith GB, Olsen RW (1995) Functional domains of GABAA receptors. Trends Pharmacol Sci 16:162–168. Somogyi P, Fritschy JM, Benke D, Roberts JD, Sieghart W (1996) The g2 subunit of the GABAA receptor is concentrated in synaptic junctions containing the a1 and b2/3 subunits in hippocampus, cerebellum and globus pallidus. Neuropharmacology 35:1425–1444. Tia S, Wang JF, Kotchabhakdi N, Vicini S (1996) Developmental
J. Neurosci., April 15, 1999, 19(8):2960–2973 2973
changes of inhibitory synaptic currents in cerebellar granule neurons: role of GABAA receptor a6 subunit. J Neurosci 16:3630 –3640. Traynelis SF, Jaramillo F (1998) Getting the most out of noise in the central nervous system. Trends Neurosci 21:137–145. Traynelis SF, Silver R A, Cull-C andy SG (1993) Estimated conductance of glutamate receptor channels activated during EPSC s at the cerebellar mossy fiber-granule cell synapse. Neuron 11:279 –289. Tretter V, Ehya N, Fuchs K , Sieghart W (1997) Stoichiometry and assembly of a recombinant GABAA receptor subtype. J Neurosci 15:2728 –2737. Verdoorn TA, Draguhn A, Ymer S, Seeburg PH, Sakmann B (1990) Functional properties of recombinant rat GABAA receptors depend upon subunit composition. Neuron 4:919 –928. Wall MJ, Usowicz MM (1997) Development of action potentialdependent and independent spontaneous GABAA receptor-mediated currents in granule cells of postnatal rat cerebellum. Eur J Neurosci 9:533–548. Wang H, Bedford F K , Brandon NJ, Moss SJ, Olsen RW (1999) GABAA-receptor-associated protein links GABAA receptors and the cytoskeleton. Nature 397:69 –72. Wisden W, Laurie DJ, Monyer H, Seeburg PH (1992) The distribution of 13 GABAA receptor subunit mRNAs in the rat brain. I. Telencephalon, diencephalon, mesencephalon. J Neurosci 12:1040 –1062. Wisden W, Korpi ER, Bahn S (1996) The cerebellum: a model system for studying GABAA receptor diversity. Neuropharmacology 35:1139 –1160. Zdilar D, L untz-Leybman V, Frostholm A, Rotter A (1992) Differential expression of GABAA / benzodiazepine receptor b1 , b2 and b3 subunit messenger-RNAs in the developing mouse cerebellum. J Comp Neurol 326:580 –594. Z imprich F, Z ezula J, Sieghart W, Lassmann H (1991) Immunohistochemical localization of the a1 , a2 and a3 subunit of the GABAA receptor in the rat brain. Neurosci Lett 127:125–128.